Automated classification of variable stars in the asteroseismology program of the Kepler space mission
Abstract
We present the first results of the application of supervised classification methods to the Kepler Q1 long-cadence light curves of a subsample of 2288 stars measured in the asteroseismology program of the mission. The methods, originally developed in the framework of the CoRoT and Gaia space missions, are capable of identifying the most common types of stellar variability in a reliable way. Many new variables have been discovered, among which a large fraction are eclipsing/ellipsoidal binaries unknown prior to launch. A comparison is made between our classification from the Kepler data and the pre-launch class based on data from the ground, showing that the latter needs significant improvement. The noise properties of the Kepler data are compared to those of the exoplanet program of the CoRoT satellite. We find that Kepler improves on CoRoT by a factor 2 to 2.3 in point-to-point scatter.
1 Introduction
The Kepler satellite, launched in March 2009, is NASA’s first mission capable of finding Earth-size and smaller planets (Borucki et al., 2010; Koch et al., 2010). It has an 0.95-m aperture Schmidt telescope with a photometer comprised of 42 CCDs having a fixed field of view of 105 square degrees in the constellations Cygnus and Lyrae. It is designed to monitor continuously the brightness of stars during the first year, reduced to stars later in the mission. This results in high-quality light curves, not only interesting for the detection of planets, but also of great importance for asteroseismology.
In this Letter, we present data from the asteroseismology program of the NASA Kepler Mission (Gilliland et al., 2010). We present a search for variable stars and the application of supervised classification methods to the Kepler long-cadence Q1 data of its asteroseismology program, covering 33.5 days in total. All the light curves have 29.4-min time sampling. Both the total time span and sampling are very well suited to study short period eclipsing and ellipsoidal binaries, classical pulsators such as RR Lyr stars and Cepheids, and nonradial pulsators such as Cep stars, Slowly pulsating B stars (SPBs), Sct stars and Dor stars (see Aerts et al. (2010) for a definition of all these classes). We used the stellar fluxes as they were delivered to us after preliminary data processing (Jenkins et al., 2010). In total, we analyzed 2288 Kepler light curves.
We compare our results to a pre-launch classification based on data in the Kepler Input Catalog (KIC hereafter) and prepared by the Kepler Asteroseismic Science Consortium (KASC, Gilliland et al. 2010). Finally, we compare the point-to-point scatter of the Kepler data to the one of CoRoT’s exoplanet data of the first long run (5 months) of that mission.
2 Adopted Methodology
To detect and extract the variables, we relied on the automated variability characterization method as described in detail in Debosscher et al. (2007, 2009). This method searches for three independent frequencies for every star, which are used to make a harmonic best-fit to the trend-subtracted time series. In this way we obtain a homogeneous set of parameters for each star, irrespective of its variability nature. The goal is not to achieve a good light curve model, but rather to deduce a set of light curve parameters which is sufficient to classify the variability.
Using this set of parameters, we classified the stars using a modified version of the classifier based on Gaussian mixtures, described in Debosscher et al. (2007), with the definition stars from Debosscher et al. (2009). We improved the performance of the algorithm presented in Debosscher et al. (2009) by classifying the objects using a multi-stage tree. In each node, we decide which groups of stars we want to distinguish. The best parameters are then selected for that node and for each group the parameter distribution is approximated with a mixture of multi-dimensional Gaussians. To each variable stellar target we assign a probability that it belongs to a particular group.
In order to obtain the final probability for each variability class we multiply the probabilities along the corresponding root-to-leaf path (see, e.g., Ripley et al. (1996) for a general introduction and definition of tree-structured classifiers). In practice, this works as follows for our application: the probability of a stellar target being an RR Lyr star of type ab is, e.g., the probability of not being an eclipsing binary (first stage) times the probability of belonging to the RR Lyr group (second stage) times the probability of being an RR Lyr star of type ab.
This procedure was followed to compute class probabilities for each target. In order to obtain the best candidates, we additionally used the Mahalanobis distance, which is a multi-dimensional generalization of the one-dimensional statistical or standard distance as described in Debosscher et al. (2009). A visual check has been performed as well.
3 Classification results
The variability classes we currently take into account, and the number of good candidate class members, are listed in Table 1. While we classified more than 200 stars securely, the majority of targets still has a too ambiguous class assignment, mainly due to the limited time base and to the large fraction of red giants among the sample (see below). Nevertheless, we managed to identify numerous new pulsators and binaries from the short time series and from early data reduction. All the illustrations presented in this paper contain stars that were either unknown as variables or were misclassified prior to launch.
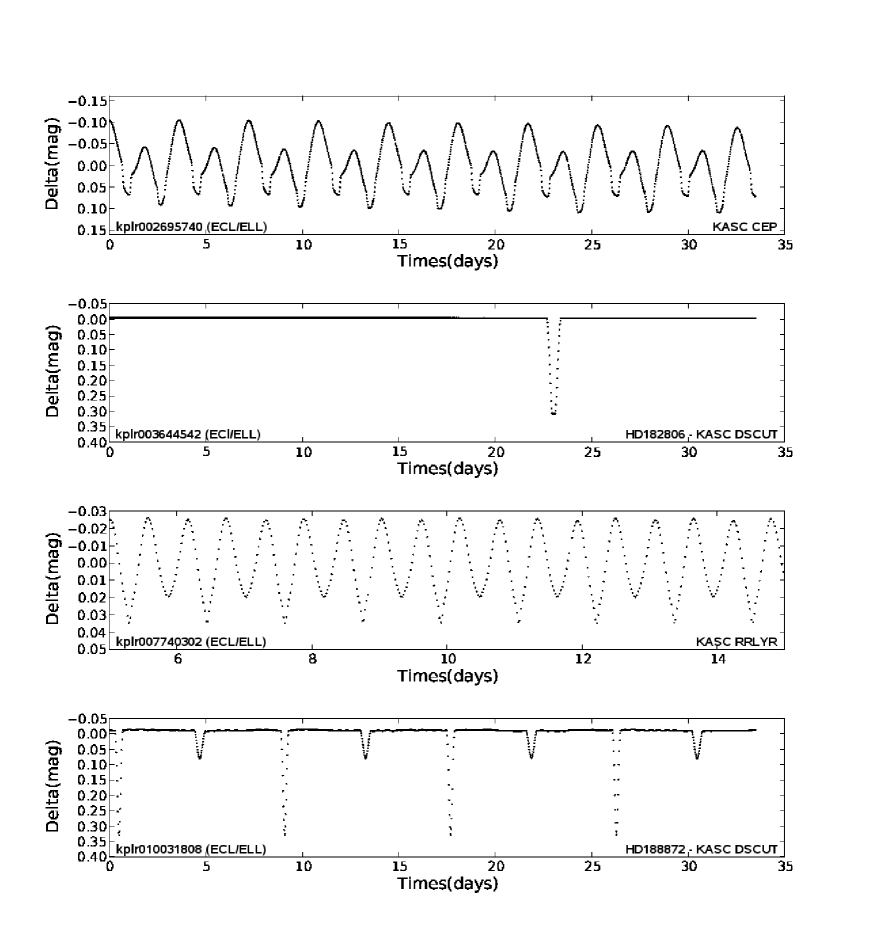
We evaluated our classification results by visual inspection and manual analysis of the best candidates based on the Mahalanobis distance, and by comparing them with the pre-launch classification which is often insecure due to limited ground data. The results are summarized in Table 1. In the second and third column, a Mahalanobis distance smaller than 3 and 2 is taken, respectively, without visual inspection. In the fourth column the final numbers of candidates are given, taking a Mahalanobis distance less than 3 and performing an additional visual inspection. In the last column, the pre-launch classification done by KASC members is given. Note that several targets occur in more than one pre-launch class. For the majority of the classes in Table 1, our results appreciably improve the pre-launch results, which were necessarily based on ground-based data and could not take into account Kepler’s high quality light curves. Good agreement is obtained for binaries and classical pulsators such as RR Lyr stars and Cepheids, but even there, we are able to improve the pre-launch results as some RR Lyr candidates were reclassified by us as eclipsing binaries. One example is given in the third panel of Fig. 1.
We could also identify many new (eclipsing) binaries, some of which are shown in Fig. 1. An example of a red giant pulsator with solar-like oscillations in an eclipsing binary is discussed in detail in Hekker et al. (2010).
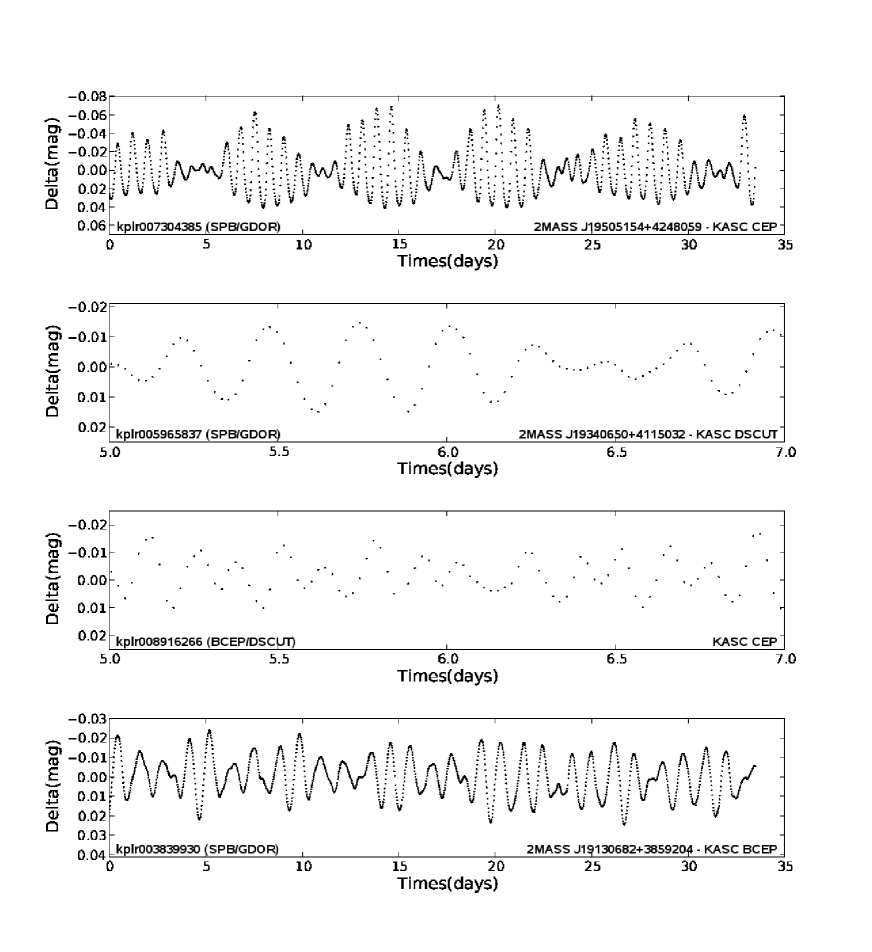
For main-sequence nonradial pulsators, such as Cep, Sct, SPB and Dor stars, there is much discrepancy between the pre-launch and our classification. Few of the pre-launch candidates turn out to be actual class members. Indeed, we do not find high-probability candidates among these stars with a pre-launch class assignment. On the other hand, we identified new nonradial pulsators not present in the pre-launch lists. Some examples are shown in Fig. 2. Similar light curves, albeit for fainter stars, were found in the CoRoT exoplanet database (Degroote et al., 2009, e.g.).
We have not yet been able to compare our results for the long period variables along or past the Asymptotic Giant Branch, such as Miras or RV Tau stars, since the current total time span of the light curves is only a fraction of the typical pulsation periods of those objects. Moreover, we did not yet search for short-period pulsators, such as solar-like pulsators along the main sequence, rapidly oscillating Ap stars, subdwarf OB variables and white dwarf pulsators (see Aerts et al. (2010) for class definitions), given that we do not yet have short-cadence data.
Another point of attention is the classification of solar-like pulsators. Stochastic pulsations are more easily recognized from a broad power excess than from the methodology adopted here. Indeed, the automated selection of the three highest frequency peaks will almost always be peaks due to granulation and/or background noise. Thus, to find such pulsators, one better uses an extractor-type approach. This involves fitting and subtraction of the granulation and background signal to characterize the type of star, after which the oscillations can be sought. We refer to Chaplin et al. (2010) , Bedding et al. (2010) and Stello et al. (2010) for a study of solar-like pulsators among Kepler targets.
Finally, we stress that our classifiers solely use the information contained in the Kepler light curves. This implies that we cannot discriminate well between the class pairs of B-type Cep and A-type Sct stars with periodicities of the order of hours, and B-type SPB versus F-type Dor stars with oscillation periods of days. Both pairs of classes contain light curves with very similar characteristics. To discriminate between them, at least some spectral information, such as a properly dereddened B-V color index or a stellar spectrum, is needed. According to the Initial Mass Function, most of these candidates should be AF-type pulsators.
| Stellar variability classes | MD 3 | MD 2 | MD 3 | KASC |
|---|---|---|---|---|
| + visual inspection | pre-launch class | |||
| Mira variables (MIRA) | 0 | 0 | 0 | 305 |
| RV-Tauri stars (RVTAU) | 1 | 1 | 0 | 2 |
| Cepheids (CEP) | 7 | 3 | 6 | 35 |
| Compact pulsators (Compact) | - | - | - | 4 |
| RR-Lyr stars (RRLYR) | 28 | 28 | 28 | 51 |
| Cep or Sct stars (BCEP/DSCUT) | 65 | 15 | 28 | 57 |
| SPB or Dor stars (SPB/GDOR) | 28 | 13 | 28 | 20 |
| Ellipsoidal variables (ELL) | 31 | 8 | 23 | 0 |
| Eclipsing binaries (ECL) | 101 | 92 | 101 | 100 |
| Red giants (RG) | - | - | - | 1513 |
| Rapidly oscillating Ap stars (ROAP) | - | - | - | 4 |
| Oscillations in clusters (OS-clus) | - | - | - | 178 |
| Solar-like oscillations (SOL) | - | - | - | 73 |
4 Noise properties of the Kepler data in the asteroseismology program
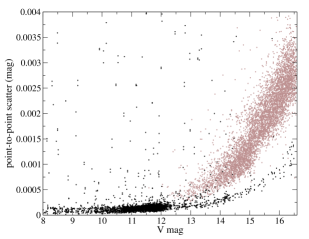
Figure 3 reveals the point-to-point scatter in the Kepler data of its asteroseismology program as described in Gilliland et al. (2010), as well as a comparison with that for the CoRoT space mission’s exoplanet data for its first long run of 5 months (Auvergne et al., 2009; Aigrain et al., 2009). We rescaled the CoRoT data to the same integration time of 29.4 min as for the long-cadence mode of Kepler in order to ensure an appropriate comparison. Duty cycles of these CoRoT and Kepler data are some 90% and 99%, respectively. It can be seen that the Kepler data with still preliminary processing (Jenkins et al., 2010) already outperforms the CoRoT exoplanet data by a factor 2 for objects with a visual magnitude of around 14 to a factor of 2.3 for objects of magnitude around 16. This is more or less as expected based on the difference in aperture size of the two instruments. Importantly for follow-up studies of the most interesting variable stars, the Kepler asteroseismology sample focuses on brighter objects.
Typical noise levels of the least variable stars in the Kepler asteroseismology program, estimated as the average amplitude in the Fourier transform avoiding the low-frequency regime below 1 cycle per day, range from 1.3 mag for an 8th magnitude star to 34 mag for a 16th magnitude star. More than 70 % of the KASC stars are variable in one way or another, even taking into account residual instrumental effects. Note that this is a much higher fraction than for the CoRoT exoplanet programme, because the KASC target selection was aimed at focusing on variable stars while the CoRoT exoplanet sample is unbiased with respect to variability.
5 Conclusions
We presented the first results of the application of automated supervised classification methods to 2288 Kepler light curves. Comparison with existing pre-launch classification and manual classification of the light curves shows the capabilities of our methodology: we are able to improve the pre-existing classification results seriously, and to identify new class members, unknown prior to launch.
We will repeat the classifications as more and longer time-span light curves become available. This way, we will also be able to identify variables with longer periodicities and have much better capacity to unravel beat periods in multiperiodic pulsators. More classes will be included in the classification scheme, and, even more importantly, the class definition stars will be updated using the high quality Kepler light curves themselves. Access to 1-min cadence data will allow us to classify shorter period variables, in additional to those presented here. With each new set of data, our results will be updated and made available.
References
- Aerts et al. (2010) Aerts C., Christensen-Dalsgaard, J., & Kurtz, D.W. 2010, Asteroseismology, Springer-Verlag (ISBN 978-1-4020-5178-4)
- Aigrain et al. (2009) Aigrain, S., et al. 2009, A&A, 425, 429
- Auvergne et al. (2009) Auvergne, M., et al. 2009, A&A, 506, 411
- Bedding et al. (2010) Bedding, T.R., et al. 2010, ApJ, submitted
- Borucki et al. (2010) Borucki, W.J., et al. 2010, PASP, in press
- Chaplin et al. (2010) Chaplin, B.W., et al. 2010, ApJ, submitted
- Debosscher et al. (2007) Debosscher, J., Sarro, L.M., Aerts, C., Cuypers, J., Vandenbussche, B., Garrido, R., & Solano, E. 2007, A&A, 475, 1159
- Debosscher et al. (2009) Debosscher, J., et al. 2009, A&A, 506, 519
- Degroote et al. (2009) Degroote, P., et al. 2009, A&A, 506, 471
- Gilliland et al. (2010) Gilliland, R.L., et al. 2010, PASP, in press
- Hekker et al. (2010) Hekker, S., et al. 2010, ApJ, submitted
- Jenkins et al. (2010) Jenkins, J.M., et al. 2010, ApJ, submitted
- Koch et al. (2010) Koch, D., et al. 2010, PASP, in press
- Ripley et al. (1996) Ripley, B.D. 1996, Pattern Recognition and Neural Networks, Cambridge University Press
- Stello et al. (2010) Stello, D., et al. 2010, ApJ, submitted