Photometric Evolution of SNe Ib/c 2004ao, 2004gk and 2006gi
Abstract
Photometric observations of three core collapse supernovae (SNe 2004ao,
2004gk and 2006gi), covering about 200 days of evolution are presented and
analyzed. The photometric behaviour of the three objects is consistent with
their membership of the envelope-stripped type Ib/c class.
Pseudo-bolometric light curves are constructed.
The corresponding measured
-folding times are found to be faster compared to the 56Co decay
(i.e. 111.3 d), suggesting that a proportion of -rays increasing
with time have escaped without thermalization, owing to the low mass nature
of the ejecta.
SN 2006gi has almost identical post maximum decline phase luminosities
as SN 1999ex, and found to be
similar to both SNe 1999dn and 1999ex in terms of the
quasi-bolometric shape,
placing it among the fast decliner Ib objects.
SN 2004ao appears to fit within the slow decliner Ib SNe.
SNe 2004ao and 2004gk display almost identical
luminosities in the [50-100] days time interval, similar to SN 1993J.
A preliminary simplified ray deposition model is described and
applied to the computed pseudo-bolometric light curves, allowing one to find
a range in the ejecta and 56Ni masses.
The optical and quasi-bolometric light curves, and the colour
evolution of SN 2004gk are found to show a sudden
drop after day 150. Correlating this fact to dust formation is premature
and requires further observational evidence.
Subject headings:
supernovae: general — supernovae: individual: SN 2004ao — supernovae: individual: SN 2004gk — supernovae: individual: SN 2006gi— techniques: photometric1. INTRODUCTION
Stripped-envelope SNe (SESNe)commonly display variety in their photometric evolution (Clocchiatti and Wheeler. 1997; Richardson, Branch and Baron. 2006). The heterogeneity in this class of events is also imprinted in their spectra (Elmhamdi et al. 2006; Taubenberger et al. 2009; Maurer et al. 2010). These facts together with the appearance of highly energetic objects with extremely broad spectral features, labeled ‘Hypernovae’, and the established association with the long-timescale Gamma-Ray Bursts have stirred much interest in the scientific community during the past decade.
As far as the photometry is concerned, extensive studies in the literature have argued that the shape of the type Ib/c light curves and the way they decline from the peak are related to the the progenitor star properties, in particular the ejected mass, explosion energy, the progenitor radius and the degree of mixing (Arnett 1982; Ensman & Woosley 1998). The smaller the ejected mass to explosion energy ratio and the closer the 56Ni to the surface, the faster the light curve declines (Shigeyama et al. 1990). One scenario for type Ic SNe indicates in fact that they originate from slightly smaller masses at the time of explosion compared to type Ib objects (Yamaoka Nomoto 1991). For type Ic SNe, two subclasses having different light curve behaviour are observed, namely fast and slow decliners (Clocchiatti and Wheeler 1997). The events like 1990B, 1992ar and the bright 1998bw belong to the slow declining subgroup. SN IIb 1993J has similar behaviour at the post-maximum phase as the slow Ic class. SNe 1983V, 1983I, 1987M and the well observed 1994I are fast declining objects. Two points of interest should be mentioned in this respect. First, the brightest Ic objects display broader peak widths and smaller peak-to-tail contrast values with a greater delay in the occurrence of maximum light. Second, some of type Ic, such as SNe 2002ap and 2004aw, appear to belong to an intermediate class between the fast Ic and the slow Ic events. Whether a continuity exists in the Ic SNe variety from the fast-less bright to the slow-bright objects is questionable. Worthy of note here is that also for type Ib light curves, the observed homogeneity, i.e being all slow decliners, is broken by cases such as SN Ib 1991D (Benetti et al. 2002), SN 1990I (Elmhamdi et al. 2004) and SN 1999dn (Benetti et al. 2010) showing a fast light curve decline from maximum light. The diversity within SESNe subclass hence increases with our ability to detect and study them. Although still few, sample comparative studies are a potential tool for a major physical understanding of SESNe.
The main goal of the present work is to contribute to enriching the observational set of SESNe data. We present and analyze original photometry observations of three events namely, SNe 2004ao(Ib), 2004gk(Ic) and 2006gi(Ib). Until now only few data for these events, mainly spectra, have been published. Some late phase spectra of SNe 2004ao and 2004gk have been presented by Modjaz et al. (2008). By means of analyzing properties of the nebular lines the authors report a double-peaked [O I] 6300,6364 Å profile in SN 2004ao. The SN appears to be peculiar in exhibiting a decreasing intensity ratio, [O I] 6300Å to [O I] 6364 Å, contrary to what is expected for the optically thin limit. SN 2004gk is found to show single-peaked [O I] 6300,6364 Å profile. The authors argued that asphericities are more likely present in a wide variety of SESNe. For SN 2006gi, Taubenberger et al. 2009 provide a nebular spectrum of the object among a sample of SESNe late spectra. The spectrum shows emission lines typical for a type Ib object, with single-peaked [O I] 6300,6364 Å profile.
The present paper is organized as follows. In Section 2, we describe the observations and data reduction techniques. Broad-band photometry data are presented and analyzed in Section 3. In Section 4 we discuss the light curves and colour evolution. The pseudo-bolometric light curves are constructed in Section 5, and then compared with the computed bolometric light curves of other SESNe events. By means of a simplified ray deposition model we recover the ejecta and 56Ni masses after discussing restrictions on the kinetic energies. We conclude with a summary in Section 6.
2. OBSERVATIONS AND DATA REDUCTION
| Star | ||||||||
|---|---|---|---|---|---|---|---|---|
| 2004ao-1 | 15.37 | 0.02 | 14.71 | 0.03 | 14.31 | 0.01 | 13.95 | 0.01 |
| 2004ao-2 | 15.41 | 0.03 | 14.45 | 0.02 | 13.90 | 0.01 | 13.37 | 0.02 |
| 2004ao-3 | 16.12 | 0.05 | 15.39 | 0.03 | 14.99 | 0.03 | 14.58 | 0.03 |
| 2004ao-4 | 16.83 | 0.07 | 16.01 | 0.04 | 15.54 | 0.03 | 15.07 | 0.04 |
| 2004ao-5 | 17.40 | 0.12 | 16.71 | 0.06 | 16.30 | 0.05 | 15.92 | 0.06 |
| 2004ao-6 | 18.74 | 0.23 | 17.21 | 0.11 | 16.02 | 0.05 | 14.65 | 0.05 |
| 2004gk-1 | 14.81 | 0.03 | 14.10 | 0.03 | 13.72 | 0.04 | 13.34 | 0.03 |
| 2004gk-2 | 16.10 | 0.04 | 15.43 | 0.04 | 15.06 | 0.02 | 14.62 | 0.04 |
| 2006gi-1 | 13.40 | 0.01 | 12.57 | 0.02 | 12.13 | 0.01 | 11.75 | 0.01 |
| 2006gi-2 | 16.59 | 0.02 | 16.02 | 0.03 | 15.67 | 0.02 | 15.37 | 0.04 |
| 2006gi-3 | 17.28 | 0.05 | 16.43 | 0.04 | 15.95 | 0.03 | 15.45 | 0.04 |
The photometric observations were carried out mostly with the 70-cm reflector of the Sternberg Astronomical Institute in Moscow (M70) using Apogee AP-47p (a) and AP-7p (b) CCD cameras, and also with the 60-cm reflector of the Crimean Observatory of the Sternberg Astronomical Institute (C60) and 38-cm reflector of the Crimean Astrophysical Observatory (C38), both equipped with Apogee AP-47p cameras.
All reductions and photometry were made using IRAF111IRAF is distributed by the National Optical Astronomy Observatory, which is operated by AURA under cooperative agreement with the National Science Foundation. Photometric measurements of the SNe were made relative to local standard stars using PSF-fitting with the IRAF DAOPHOT package. The background of the host galaxy was negligible for SN 2006gi, which occurred very far from the center of NGC 3147. The projected distance of this SN from the center of the galaxy is 31.1 kpc, while the radius of the galaxy is 24.7 kpc (de Vaucouleurs et al. 1991; as given in the RC3 Catalogue of Bright Galaxies and Nasa/Ipac Extragalactic Database). SN 2004ao was superimposed on a faint spiral arm of UGC 10862, and SN 2004gk was located near the ridge line of an edge-on spiral galaxy IC 3311. For these two objects we applied subtraction of galaxy background before PSF photometry. We used SDSS222http://das.sdss.org images of the fields for subtraction, because no high-quality images of these galaxies could be obtained at our telescopes after the SNe faded.
The passbands of the SDSS photometric system are different from the response curves of our instruments, and we studied the possible effect of this fact on the results of our photometry. We carried out the photometry with galaxy subtraction and without subtraction and compared the results. On most of the dates the differences are negligible, and only for few later dates they slightly exceed , where is the uncertainty of photometry as reported in Tables 3, 4. We also carefully checked the quality of subtraction and found that it is quite clear, with no sign of underlying features in the galaxies. The examination of SDSS images of the host galaxies showed that there are no bright features at the positions of SNe that could have any effect on the photometry. We conclude that in the cases of SNe 2004ao and 2004gk the use of SDSS frames for galaxy subtraction cannot result in significant errors, comparable to the uncertainties of our photometry.
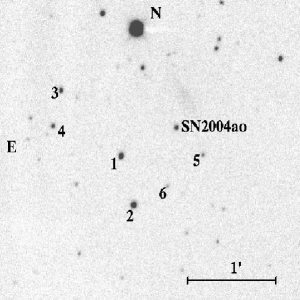
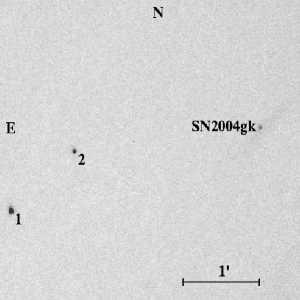
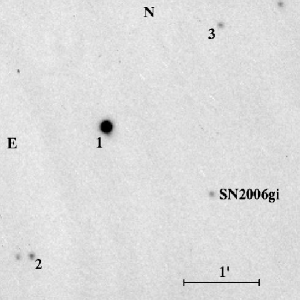
The images of SNe with local standard stars are shown in Fig. 1. The magnitudes of local standards were calibrated on photometric nights, when we observed standards from Landolt (1992) and standard regions in the clusters M 67 (Chevalier and Ilovaisky, 1991), M 92 and NGC 7790333http://cadcwww.hia.nrc.ca/standards/. They are reported in Table 1. The filters used at all the telescopes were intended to match Johnson and Cousins passbands. The instrumental colour terms were derived from observations of standard stars. They are presented in Table 2, where the number after the codes for telescope and camera denotes the filter set.
The optical photometry and their uncertainties for the three SNe are reported in Tables 3, 4 and 5.
3. Light Curves
In this section we describe the main parameters of the individual events, and we present their light curves and colour evolution.
| Telescope,CCD,Filters | ||||||||
|---|---|---|---|---|---|---|---|---|
| M70a1 | -0.18 | 0.01 | -0.011 | 0.007 | -0.21 | 0.02 | -0.45 | 0.03 |
| M70a2 | -0.21 | 0.02 | -0.023 | 0.008 | 0.09 | 0.01 | -0.39 | 0.03 |
| M70b | -0.14 | 0.01 | -0.023 | 0.009 | -0.12 | 0.02 | -0.38 | 0.02 |
| C38 | -0.24 | 0.02 | -0.026 | 0.012 | 0.14 | 0.02 | -0.33 | 0.03 |
| C60 | 0.01 | 0.01 | -0.050 | 0.011 | -0.07 | 0.01 | -0.38 | 0.02 |
3.1. SN 2004ao
SN 2004ao was discovered on March 7.54 by the Lick Observatory Supernova Search (Singer & Li, 2004; IAUC 8299), with an unfiltered magnitude of 14.9. The supernova was located at h28m09s.35, 07∘24′55′′.5 , and lies close to the southern arm of its host galaxy UGC 10862 (SBc Galaxy). Matheson, Challis & Kirshner (2004) reported that an optical spectrum444available at http: //www.cfa.harvard.edu/supernova/spectra obtained on March 14.53 was that of a type Ib SNe soon after maximum. The spectrum showed characteristics similar to those of SN Ib 1998dt 8 days past maximum (Matheson et al. 2001). A nebular spectrum, taken about 3 months after discovery (on June 8.1) at the -band, shows a P-Cygni feature with absorption component at 10430 Å. The line has been identified as He I 10830 Å, expected from the type Ib nature of the object (Gomez et al. 2004; IAUC 8430).
| JD 2453000+ | Tel. | ||||||||
|---|---|---|---|---|---|---|---|---|---|
| 75.59 | 16.91 | 0.06 | 15.52 | 0.02 | 14.95 | 0.02 | 14.51 | 0.03 | M70a1 |
| 79.60 | 17.05 | 0.05 | 15.66 | 0.03 | 15.15 | 0.03 | 14.67 | 0.03 | M70a1 |
| 101.51 | 17.30 | 0.06 | 16.11 | 0.05 | 15.63 | 0.03 | 15.07 | 0.04 | M70a1 |
| 110.54 | 17.49 | 0.08 | 16.29 | 0.03 | 15.77 | 0.03 | 15.27 | 0.03 | M70a1 |
| 115.54 | 17.42 | 0.14 | 16.19 | 0.05 | 15.85 | 0.06 | 15.32 | 0.06 | M70a1 |
| 120.43 | 16.22 | 0.11 | 16.06 | 0.15 | M70a1 | ||||
| 130.51 | 17.57 | 0.13 | 16.56 | 0.06 | 16.03 | 0.06 | 15.57 | 0.06 | M70a1 |
| 147.43 | 17.76 | 0.09 | 16.73 | 0.07 | 16.26 | 0.05 | 15.75 | 0.06 | M70a1 |
| 158.45 | 16.68 | 0.05 | 16.50 | 0.04 | M70a1 | ||||
| 207.36 | 17.73 | 0.08 | 17.32 | 0.04 | M70b | ||||
| 220.36 | 17.62 | 0.12 | 17.35 | 0.07 | M70b | ||||
| 235.32 | 18.58 | 0.13 | 17.73 | 0.05 | M70b | ||||
| 249.31 | 17.76 | 0.12 | M70b |
| JD 2453000+ | Tel. | ||||||||
|---|---|---|---|---|---|---|---|---|---|
| 341.58 | 15.23 | 0.04 | 14.12 | 0.03 | 13.84 | 0.03 | 13.44 | 0.04 | C38 |
| 389.64 | 16.75 | 0.05 | 15.44 | 0.03 | 15.14 | 0.02 | 14.39 | 0.02 | M70a2 |
| 406.41 | 16.91 | 0.03 | 15.71 | 0.03 | 15.45 | 0.04 | 14.77 | 0.03 | M70a2 |
| 432.47 | 17.13 | 0.04 | 16.13 | 0.03 | 15.76 | 0.02 | 15.25 | 0.03 | M70a2 |
| 446.50 | 17.18 | 0.05 | 16.29 | 0.03 | 15.91 | 0.03 | 15.37 | 0.03 | M70a2 |
| 455.50 | 17.46 | 0.05 | 16.40 | 0.04 | 16.06 | 0.02 | 15.55 | 0.04 | M70a2 |
| 463.39 | 17.61 | 0.06 | 16.51 | 0.04 | 16.07 | 0.04 | 15.64 | 0.06 | M70a2 |
| 468.43 | 17.43 | 0.06 | 16.69 | 0.04 | 16.20 | 0.05 | 15.70 | 0.05 | M70a2 |
| 506.39 | 18.15 | 0.06 | 17.64 | 0.07 | 16.97 | 0.04 | 16.70 | 0.07 | M70b |
| JD 2453000+ | Tel. | ||||||||
|---|---|---|---|---|---|---|---|---|---|
| 998.67aaMeasured on ALFOSC-camera images (NOT observatory). | 17.03 | 0.06 | 16.30 | 0.04 | 15.91 | 0.02 | 15.64 | 0.07 | NOT |
| 999.22 | 17.10 | 0.05 | 16.18 | 0.05 | 15.91 | 0.04 | 15.63 | 0.05 | M70b |
| 1003.54 | 17.52 | 0.05 | 16.37 | 0.03 | 15.97 | 0.02 | 15.72 | 0.03 | M70b |
| 1006.58 | 18.27 | 0.12 | 16.69 | 0.06 | 16.05 | 0.04 | 15.80 | 0.05 | M70b |
| 1026.52 | 18.95 | 0.17 | 17.66 | 0.14 | 16.99 | 0.04 | M70b | ||
| 1044.44 | 17.67 | 0.07 | 17.22 | 0.04 | C60 | ||||
| 1048.62 | 19.15 | 0.21 | 17.98 | 0.06 | 17.35 | 0.03 | 16.84 | 0.14 | C60 |
| 1059.61 | 19.18 | 0.04 | 18.02 | 0.02 | 17.53 | 0.04 | C60 | ||
| 1060.57 | 19.49 | 0.16 | 18.09 | 0.05 | 17.54 | 0.05 | C60 | ||
| 1118.43 | 18.95 | 0.16 | 18.31 | 0.07 | 17.90 | 0.11 | M70b | ||
| 1131.34 | 19.00 | 0.40 | 18.45 | 0.27 | M70b |
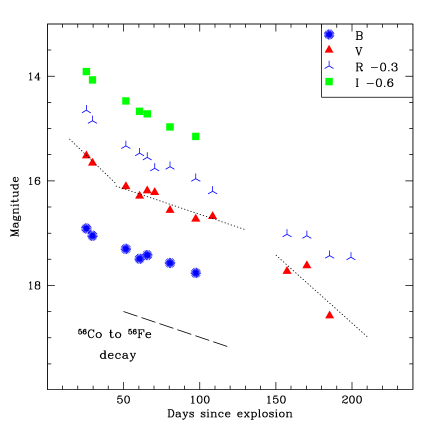
In Fig. 2, the light curves are displayed. The early photometric evolution together with the nature of the March 14.53 spectrum (Matheson, Challis & Kirshner, 2004) provide the possibility of estimating the explosion date. In fact, based on our early photometric data, and bearing in mind the typical rise time for type Ib/c SNe, between shock breakout and maximum light, to be days, we estimate the explosion time to be January 21, 2004 within an uncertainty of 5 days (JD 2453050 5 d).
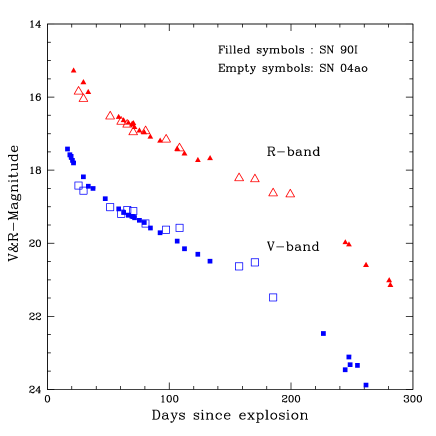
A comparison, in the and bands, with the well studied SN Ib 1990I (Elmhamdi et al. 2004) is displayed in Fig. 3, where the SN 2004ao data are vertically shifted to fit SN 1990I data. The match in the time range [25-110] days is good. Later , SN 2004ao seems to evolve slightly less steeply than SN 1990I, although the lack of late photometric observations in SN 2004ao, after day 200, inhibits a complete comparison between the two events. The good early match however provides support for our explosion time estimate. Our first photometric observations occur then at the end of the post-maximum decline phase.
SN 2004ao suffers high galactic extinction, mag, according to maps of the galactic dust distribution by Schlegel, Finkbeiner Davis (1998). This corresponds to a colour excess of about , where the standard reddening laws of Cardelli et al. (1989) have been used. The available early spectra of the object do not display an obvious interstellar Na I D absorption at the velocity of the host galaxy, however an upper limit to the line equivalent width (EW) of 0.07Å is estimated (M. Modjaz, Private communication). Adopting the general correlation between Na I D EW and colour excess, derived by Turatto et al. (2003), the total extinction suffered by SN 2004ao is then mag.
The radial velocity of the host galaxy with respect to the CMB radiation is 1668 km s-1, while the one corrected for the Local Group infall onto the Virgo Cluster is 1813 km s-1 (Theureau G. et al. 1998; Paturel et al. 2003; as given by LEDA555http://leda.univ-lyon1.fr extragalactic database). This later value translates into a distance modulus (using H70 km s-1Mpc-1).
3.2. SN 2004gk
The discovery of SN 2004gk was reported on November 25.5 by R. Quimby et al. 2004 (IAUC 8446). The SN is located at , (equinox 2000.0), corresponding to west and north of the center of the host Sc galaxy IC 3311. An image taken on June 12.17, with the McDonald Observatory 0.45-m ROTSE-IIIb telescope, shows nothing at the supernova position, limiting its magnitude to about 17.9 (IAUC 8446). The object was classified as a type Ic supernova near maximum. Indeed the optical spectrum obtained on November 27.52 by M. Shetrone V. Riley with the 9.2-m Hobby/Eberly telescope resembles that of the intensively studied Ic SN 1994I near maximum light (IAUC 8446). Moreover, the radio observation of SN 2004gk on November 30.5 indicates a comparable radio luminosity ( erg/s/Hz) to that of SN Ic 2002ap at similar epoch (Soderberg et al. 2004). A nebular spectrum was reported by Modjaz et al.(2008). It also shows a clear a type Ic nebular behaviour.
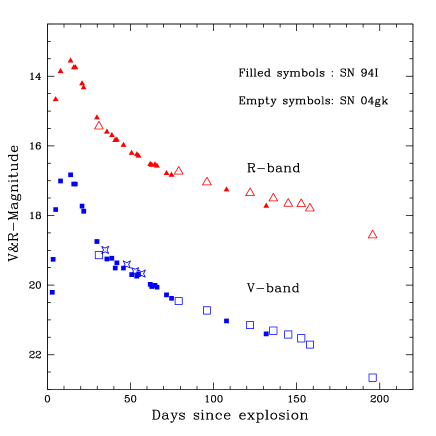
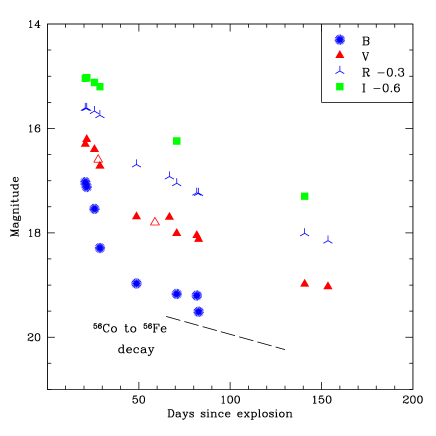
The light curves are illustrated in Fig. 4. The Figure includes also four early -band estimates from “Astrosurf” amateur astronomers service666http://www.astrosurf.com/snweb2/index.html (plotted as empty triangles). According to the evolution of the observed early photometry and the nature of the November 27.52 spectrum (IAUC 8446), taking into account as well the typical rise time in type Ib/c SNe, it is possible to constrain the explosion date. We estimate it to be November 2, 2004 (JD 2453312) and with an uncertainty of 5 days. An alternative method supporting our estimated date is by comparing SN 2004gk with the well studied type Ic SN 1994I. Fig. 5 compares the and light curves of the two events. SN 2004gk data are vertically displaced to fit SN 1994I data. The goodness of the match indicates the epoch of our first photometric observations to be near the end of the post-maximum decline phase. Data around day 120 and later seem to indicate a less steep decline rate in SN 2004gk than in SN 1994I, although the data point around day 195 shows a similar evolution trend.
The galactic extinction toward the host IC 3311, according to maps of the galactic dust distribution by Schlegel et al. (1998), is mag. The standard reddening laws of Cardelli et al.(1989) are again adopted. Additional intra-galaxy reddening is supported by the presence in the spectra of narrow Na I D line at the host galaxy redshift with an equivalent width of EW0.75 (Robert Quimby; Private communication). Adopting the general correlation between Na I D EW and colour excess, derived by Turatto et al. (2003), we estimate mag. The total extinction suffered by SN 2004gk is then mag.
The radial velocity of the host galaxy corrected for the Local Group infall onto the Virgo Cluster is -79 km s-1 while the one with respect to the CMB radiation is 160 km s-1 (Springob C. M. et al. 2005; Paturel et al. 2003; as reported in the LEDA database). These small redshifts are unreliable indicators of Huble flow and their corresponding distances are unusable. However since IC 3311 is found to be close to the center of the Virgo cluster one can then adopt the mean distance of the cluster. An accurate recent value has been found by Mei et al. (2007), to be 16.5 Mpc, adopted in our paper.
3.3. SN 2006gi
SN 2006gi was discovered on September 18.8 by K. Itagaki with an unfiltered magnitude of 16.3 (IAUC 8751). With coordinates of , (equinox 2000.0). SN 2006gi was located west and north of the center of the host Sbc galaxy NGC 3147. Nothing was seen at the location of the supernova on March 22 and June 3 images (limiting magnitude 19.0; Nakano Itagaki 2006). Moreover, a NOT (Nordic Optical Telescope) spectrum taken on September 19 displays similarities with the well studied type Ib SNe 1984L and 1990I around maximum light777See http://www.supernovae.net/sn2006/sn2006gi.pdf, indicating the type Ib nature of the event (Stanishev et al. 2006). Four SNe have been already detected in the host NGC 3147, namely SNe 1972H, 1997bq, 2006gi and the very recent event 2008fv.
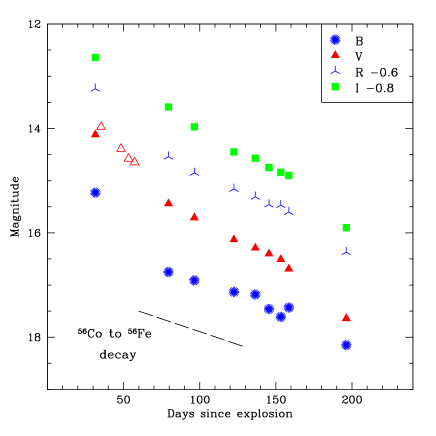
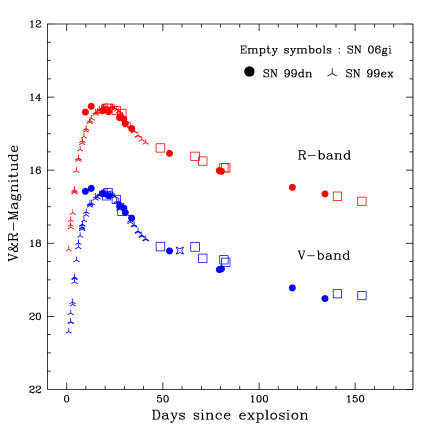
Fig. 6 presents the light curves of SN 2006gi. Two additional band photometric points from “Astrosurf” amateur astronomers service are added in the figure. On the one hand the shape of the early photometry indicates the observations to occur near maximum light. On the other hand, the features in the NOT spectrum together with the discovery date suggest constraints on the age of the SN. We indeed estimate the explosion time to be August 20, 2006 (JD 2453978) with an uncertainty of 5 days. In Fig. 7 SN 2006gi is compared with the type Ib SNe 1999ex (Hamuy et al. 2002) and 1999dn (Benetti et al. 2010) , where SNe data are vertically displaced to fit together. Our first observations correspond to the near post-maximum declining stage. The good match supports our estimate of the explosion date. Note in addition the good fit with SN 1999dn data at late times.
The galactic extinction due to the Milky Way toward the parent galaxy of SN 2006gi, according again to maps of the galactic dust distribution by Schlegel et al. (1998), is mag, the standard reddening laws of Cardelli et al. (1989) again being adopted. Furthermore, the NOT spectrum shows the presence of narrow Na I D line at the host galaxy redshift with an equivalent width of EW0.6 (V. Stanishev, Private commmunication). The general correlation by Turatto et al. (2003) is then used to translate this EW to reddening. The total extinction suffered by SN 2006gi is estimated to be mag.
The recession velocity of the host galaxy NGC 3147 relative to the CMB radiation and the one corrected for the Local Group infall onto the Virgo Cluster respectively are 2875 km s-1 and 3077 km s-1 (Saunders W. et al. 2000; Springob C. M. et al. 2005; Paturel et al. 2003; as given in the the LEDA extragalactic database). This latter translates into a distance modulus .
Hereafter, throughout the paper, we will adopt the above constrained parameters for the three events (i.e. explosion date, total extinction and distance modulus).
4. Photometric evolution
In the following analysis we discuss the nature of the light
curves and their different evolutionary phases,
comparing our three SNe Ib/c with other well studied events.
In Fig. 2 three possible different phases are recognizable for SN 2004ao, with approximate time intervals [0-50] days, [50-150] days and later than 150 days. The corresponding decline rates are indicated by the dotted lines. The exponential life-time of 56Co , 111.26 days or 0.976 mag per 100 days, is also shown for comparison. Similar phases are observed in both SN 2004gk (Fig. 4) and SN 2006gi (Fig. 6). The weighted linear least-squares fits to the observations and their errors for the three events at the “possible three” phases are summarized in Table 6.
Clearly, the three different decline stages appear more prominent in SN 2004ao compared to SNe 2004gk and 2006gi. This may be due to the better temporal coverage for SN 2004ao. In addition, the phases become clearer and better resolved as we progress toward the blue. As can be seen from Fig.6 and Table 6, the post-maximum decline rate is higher in SN 2006gi, ( 6.2 mag (100 d)-1), and for both SNe 2004gk and 2006gi seems to be much faster in the blue bands than in the red ones, while in SN 2004ao it increases toward the red bands. During this early phase, SN 2006gi resembles SNe Ib 1990I (Elmhamdi et al. 2004) and 1999ex (Hamuy et al. 2002) in the large decline rate with a decrease toward the red bands. We note here that our first photometric data for SN 2004gk occur at the tail part of the early post maximum decline phase (see comparison with SN Ic 1994I). This means that the computed early decline is under-estimated. Indeed most type Ic SNe seem to have a much faster decline rate at this phase than SNe Ib ( 11 mag (100 d)-1 and 8.5 mag (100 d)-1 for the well observed SNe Ic 1994I and 1983I, respectively; Elmhamdi et al. 2004).
| Supernova | |||||
|---|---|---|---|---|---|
| name | mag (100 d)-1 | mag (100 d)-1 | mag (100 d)-1 | mag (100 d)-1 | |
| SN04ao | 2.5 | 2.9 | 3.6 | 3.5 | |
| Phase 1 | SN04gk | 3.1 | 2.8 | 2.7 | 2 |
| SN06gi | 6.2 | 5.4 | 4.1 | 2.3 | |
| SN04ao | 0.91 | 1.02 | 1.37 | 1.47 | |
| Phase 2 | SN04gkaaThe first and last data are excluded. | 1.02 | 1.5 | 1.27 | 1.71 |
| SN06gi | 1.1 | 1.26 | 1.46 | 1.51 | |
| SN04ao | 2.6 | 1.32 | |||
| Phase 3 | SN04gkbbUsing only the last three points | 1.49 | 2.58 | 2.07 | 2.52 |
| SN06gi |
.
During the second phase SN 2006gi is found to be much faster in the red bands than in the blue ones, opposite to what is seen during the first phase. This rate increase trend toward the red is also observed in SN 2004ao. SN 2004ao has a band slope very close to the full -ray trapping rate. This may be of interest since this behaviour characterizes type II SNe, which have higher ejecta masses, rather than Ib/c events, but is also reminiscent of what was seen in the peculiar type Ib SN 1984L (Schlegel Kirshner, 1989) although their behaviour differs at later phases.
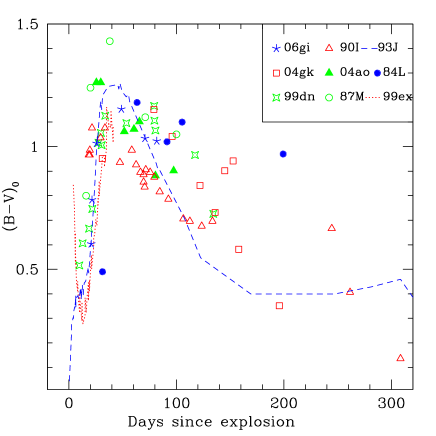
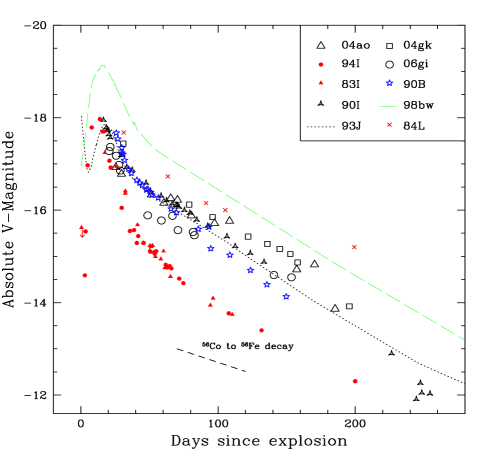
In Figure 8 the absolute light curves of SNe 2004ao, 2004gk and 2006gi are compared with other type Ib/c core collapse events. Around day 100 since explosion SN Ib 1984L appears 0.3 mag brighter than SN 2004ao, whereas the difference becomes 1 mag at day 200. The SN 2004gk photometric point around day 200 reflects a deviation, possibly occurring after day 150, from a second phase slope trend . Figure 9 reports the intrinsic colour of our three SNe together with that of other type Ib/c SNe for comparison. of SN IIb 1993J is also shown (dashed line). The figure highlights the similar evolutionary trend followed by the sample events, displaying a rapid reddening during the first 50 days, reflecting the cooling due to the envelope expansion. After the peak the SNe turn to the blue with almost similar slopes. Then the events settle on a less varying colour phase. Later on SNe 1990I and 2004gk show a sudden drop, with different epochs of occurrence. While SN 1990I colour falls around day 250, SN 2004gk exhibits a steep decline at day 150 after explosion, with a rate of 0.6 mag in 50 days.
5. The Bolometric luminosities and the physical parameters
The fundamental physics of SNe is imprinted on the bolometric luminosities. Indeed, in order to obtain an accurate estimate of the physical parameters one needs to treat and model the bolometric light curves rather than only analyzing the individual broad band photometry evolution, especially for cases where the optical light curves do not track the bolometric ones. Unfortunately, to date only a few core collapse SNe have good coverage with broad-band photometry (spanning the X-ray to the IR regions of the electromagnetic spectrum), thus limiting a complete and correct understanding of how physically these classes of events behave and evolve.
5.1. Bolometric light curves
Two methods are usually adopted to construct the bolometric luminosities. The first uses a SED, spectral energy distribution, analysis in deriving the equivalent corresponding BB luminosities, while in the second method the observed broad band magnitudes are directly integrated.
In the present work we adopt the second method. Our broad band observations are corrected for extinction effects adopting the standard reddening curve of Cardelli et al. (1989). The magnitudes are converted then into monochromatic fluxes. The distance to the SN host galaxy is used to convert the summed fluxes to luminosities. We note here that when for a given passband a night is lacking we extend the corresponding data using interpolation or extrapolation of the existing data nights adopting low order polynomial fits.
Moreover, the derived luminosities should include the near-IR. At present few Ib/c objects were photometrically followed in the IR. In the case of SN 1998bw, a near-IR fraction of 42 at day 370 was estimated to be added to the (Sollerman et al. 2002), whereas Patat et al. (2001) have derived a fraction of about 35 on day 65.4. Taubenberger et al. (2006) found that, for SN Ic 2004aw, the near-IR contribution increases from 31 to 45 between day 10 and day 30 past B-maximum light. Recently, SN Ib 2008D was found to have a near-IR contribution about 24 at age 30 days since outburst (Modjaz et al. 2009). Though not precise, in view of the possible increasing importance of the near-IR fraction with time (e.g. SN 1998bw; Sollerman et al. 2002), here we simply adopt 35 as a constant scaling factor due to the contribution of the near-IR fluxes.
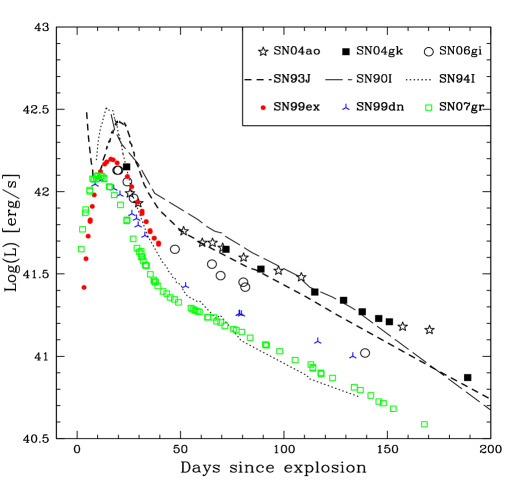
The resulting quasi-bolometric light curves for the 3 SNe are displayed in Fig. 10, and compared with those of other stripped-envelope events. These include: SN Ib 1990I (Elmhamdi et al. 2004), SN Ic 1994I (Richmond et al. 1996a), SN IIb 1993J (Barbon et al. 1995; Richmond et al. 1996b), SN Ib 1999ex (Stritzinger et al. 2002), SN Ib 1999dn (Benetti et al. 2010) and SN Ic 2007gr (Valenti et al. 2008; Hunter et al. 2009). The reported quasi-bolmetric light curves were constructed following the same steps as explained earlier (i.e. for SNe 2004ao, 2004gk and 2006gi), and adopting extinction values and distance moduli from the cited corresponding reference papers.
SNe 2004ao, 2004gk, 1993J appear to have similar luminosities over the time interval [50-100] days. After day 100, both SNe 2004ao and 2004gk evolve slower, i.e greater folding time, compared to SNe 1990I and 1993J. At this phase, SN 2006gi is found to be 0.15 dex fainter than SNe 2004ao and 2004gk and 0.15 dex brigther than SN 1999dn. Interestingly, SN 2006gi is similar to SN 1999ex at earlier epoch, in the interval [10-50] days, with almost identical luminosities and decline rate. Furthermore, although SN 1999dn appears fainter than SN 2006gi, their observed decline rates indicate an overall shape similarity in the interval [15-100] days. Around day 140, the luminosity difference seems decreasing between the two events. Later on, the derived luminosity of SN 2004ao around day 170 is 0.2 dex brighter than SNe 1990I and 1993J. Around day 190, SN 2004gk seems to change its previous trend converging to a comparable luminosity as SN 1993J. SNe 1994I and 2007gr are the objects with the lowest luminosities over the late evolutionary phase.
5.2. Physical parameters
After constructing the bolometric light curves, we adopt a simple model for radioactive powering especially during the radioactive tail after the steep decline from the maximum brightness. A reasonable fit to the data provides quantitative insights on the ejecta and 56Ni masses being the basic parameters responsible for the bolometric light curve shape.
Our principal goal is to model-fit the bolometric behaviour starting at the transition phase, i.e. about 50 days up to about 150 days. In this time range we ignore the contributions from radioactive elements other than 56Ni and 56Co. Longer lived isotopes would have little effect.
The simple model describes the luminosity evolution in an homologously expanding spherical ejecta with a point source -ray deposition from 56Ni56Co56Fe. It is based on the simple approach adopted by Swartz Wheeler (1991) and Clocchiatti Wheeler (1997). By assuming free expansion of the ejecta (), a power law density distribution () and a -ray opacity () constant throughout the ejecta, the equations for the mass, kinetic energy and -ray optical depth can be solved. The total -ray optical depth can be expressed then in terms of the main physical parameters (Clocchiatti Wheeler 1997):
| (1) |
Where t refers to time since explosion. For a power index we have , adopted in our calculations.
With these simplified considerations, the emergent luminosity attenuated by the ejecta, i.e thermalized by the ejecta, at a given time t, reads:
| (2) |
L is the -rays luminosity from radioactive decay.
L0 at a given time is estimated from the radioactive energy properties of the 56Ni56Co56Fe decay, adopting the main parameters presented by Jeffery (1999) and Nadyozhin (1994). Once the total rate of radioactive energy production at a given time is computed we then combine it with equations 1 and 2. This provides a general description of the simple radioactive decay energy deposition model in a spherical geometry.
A consistent light curve model should consider simultaneously details from the bolometric light curve and the velocities. To break the degeneracy between and , we rely on the available information about the velocity of the events. In a recent work, Maurer et al. (2010) have studied the velocity of a sample of 56 stripped-envelope supernovae by means of their nebular spectra. The sample includes both SN 2004ao and SN 2004gk. The authors report two characteristic velocities for the whole sample, namely (related to the ratio of core kinetic energy to core mass as estimated from spectral modeling; equations 2 and 3 in Maurer et al. 2010) and (directly measured from the half width of the oxygen doublet [O I] 6300,6364 Å at half maximum intensity). Both velocities, i.e. and , characterize the inner ejecta of the sample events. For most SNe of a given class, the study revealed a quit similar average core velocities: 5126 816 km s-1 for 27 Ic SNe; 4844 935 km s-1 for 13 Ib SNe and 4402 403 km s-1 for SNe of type IIb. The energetic subclass, termed broad-lined SNe (BL-SNe or hypernovae; 12 objects in the studied CCSNe sample), show on average a higher velocity of 5685 842 km s-1. One of the most important results of the cited paper is that not all the BL objects behave in the same way as they evolve in time. In fact, while at early epochs the BL-SNe seem to be homogeneous in having their outer ejecta moving at very high velocities, the core velocities show a large variations at late phases. The asphericity of the inner ejecta of the BL SNe class might be an explanation.
As far as SNe 2004ao and 2004gk are concerned, they appear to belong to the regular velocity behaviour classes (see table 3 in Maurer et al. 2010).
Therefore, we find it reasonable to adopt a “standard” kinetic energy of the order ergs for these two SNe. For SN 2006gi, some information might be inferred from the only two, until now published spectra. Indeed, the NOT spectrum888can be found at http://www.supernovae.net/sn2006/sn2006gi.pdf obtained around maximum displays lower expansion velocities relative to SNe Ib 1990I and 1984L (as seen from the absorption troughs of He I and Fe II optical lines). A similar conclusion, i.e low expansion velocity, is drawn from the nebular spectrum displayed by Taubenberger et al. 2009 by means of the reported FWHM of the [O I] 6300,6364 Å line compared to a large sample of SESNe. Combining these facts with the noted fast decline of the bolometric light curve, a late folding decay time of 62 days, might lead one to speculate that the kinetic energy is lower than a “regular” value of ergs.
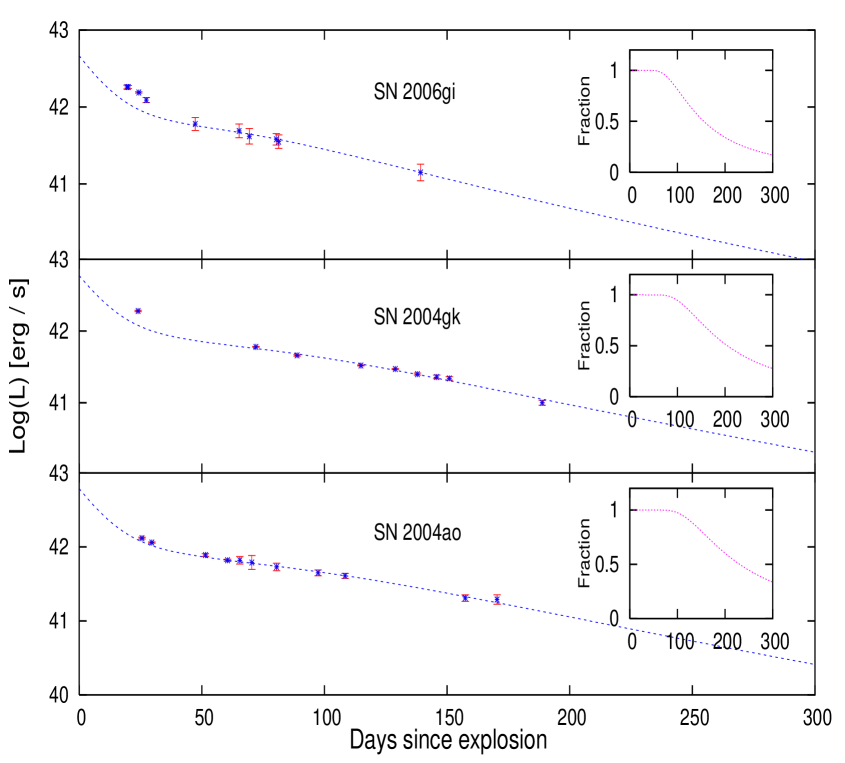
As mentioned above, restricting the energy to ergs our favored model fit indicates the following values: SN 2004ao and ; and SN 2004gk and . For SN 2006gi, using ergs gives and . In Fig. 11 we illustrate the best fit corresponding to these data. The windows in the panels of figure 10 highlight the evolution of the fraction of the ray luminosity deposited into the envelope corresponding to our best fits.
Adopting an energy of ergs for SNe 2004ao and 2004gk and not changing -ray optical depth would increase the derived ejecta masses by about 15-20.
Though simple, the model reproduces reasonable fits especially the initial part of the radioactive tail. In the [50-120] days time interval SN 2004ao and SN 2004gk are found to have almost identical luminosities (similar masses), while later on SN 2004ao seems to evolve higher and more slowly (greater ). The recovered SN 2006gi luminosities and the model fit require both the lowest nickel and ejecta masses compared to the other two events.
6. Summary and conclusions
We have presented optical photometry of three ESSNe, namely SN Ib 2004ao, SN Ic 2004gk and SN Ib 2006gi covering about 200 days of evolution. Constraints on explosion dates, distance moduli and total reddening are given and adopted throughout the paper. Colour evolution and light curve similarities and differences with some well-studied type Ib/c objects are highlighted and discussed. The observed -light curve of SNe 2004ao displays a three-phase behaviour, seen also in SN 2004gk if considering the deviation of the last observational data around day 200.
The broad-band photometry is used to construct the quasi-bolometric light curves after adopting a constant contribution from part of the spectrum. The resulting light curves are compared to those of other hydrogen deficient SNe, all constructed following the same method. Around day 25 SNe Ib 2004ao and 2006gi are found to have similar luminosity, whereas thereafter at age 70 days 2006gi has 0.18 dex fainter luminosity compared to that of SN 2004ao. As far as the bolometric light curve shape is concerned, SN 2006gi is most similar to SNe 1999dn and 1999ex, belonging to the fast declining type Ib class. SN 2004ao appears to fit within the slow declining Ib subgroup. SNe 2004ao and 2004gk are found to converge to similar luminosities in the time interval [50-100] days, while at early post-maximum phase SN 2004gk is brighter.
A simple ray deposition model is described and then applied to estimate the main physical parameters of our sample. After adopting constraints on the explosion kinetic energy from the available published spectroscopy observations, SN 2006gi appears to have both the lowest nickel and ejecta masses compared to SNe 2004ao and 2004gk.
A comparison of the resulting quasi-bolometric light curves for the three SNe, shown in Fig. 10 and Fig. 11, reveals the following. 1.All folding decay times are faster than the 56Co decay time, i.e. 111.3 d, in the time interval [50-150] days. 2.The decay times appear to correlate with absolute luminosity, such that the faintest SN 2006gi has a decay time of 62 days, while SN 2004ao the has a decay time of 90 days and SN 2004gk has a decay time of 80 days. 3. SN 2004gk shows a third phase starting near or before 150 days.
On the one hand, this observed late deficit in SN 2004gk is also reported in both optical light curves and colour evolution, reminiscent of what seen in type Ib SN 1990I (Elmhamdi et al. 2004). In SN 1990I however the sudden drop was also associated to a spectral blueshift (seen in the [O I] 6300,6364 Å and [Ca II] 7291,7324 Å doublets), and explained in the framework of dust condensation as the ejecta expand and cool causing a drop in temperature below the threshold where dust can form (Elmhamdi et al. 2004) and absorb and block shorter wavelength radiation.
On the other hand, from the spectroscopic point of view, nebular lines of SN 2004gk, especially [O I] 6300,6364 Å and [Ca II] 7291,7324 Å doublets, show only a small shift to the blue (10 Å around day 200 corresponding to 500 km.s-1 ; Robert Quimby, Private communication). However in Modjaz et al. 2008, the published late time spectrum of SN 2004gk, taken at 260 days, displays a single-peaked [O I] 6300,6364 Å profile with no evidence for a blueshift deviation. Various mechanisms have been invoked to explain the line shape nature and properties of the nebular [O I] 6300,6364 Å line in SESNe ( i.e. moderate and extreme shifts in single- and double-peaked line profile cases; See Modjaz et al. 2008 and Taubenberger et al. 2009 for detailed discussions). Taubenberger et al. propose residual opacity effects as the most likely reason for less extreme [O I] 6300,6364 Å line blueshifts. Moreover, dust should manifest its presence in a line blueshift amount increasing in time, while that seems not be the case for SN 2004gk.
It should be noted that so far only two type Ib/c events have showed observational evidence of possible dust formation, namely SN Ib 1990I and SN Ib 2006jc. Based on evidences from line profiles and optical-infrared light curves (seen as early as day 50 since maximum) the event was a clear case where dust formed or was present in the CSM and not the envelope. Indeed while the broad lines from the envelope were not shifted, the narrow He I line from the CSM was (Smith, Foley and Filippenko 2008; Nozawa et al. 2008; Mattila et al. 2008)
The principal goal of the present work has been to enrich the photometric observations of the hydrogen deficient class of core collapse SNe for future sample studies. Indeed, such analyzes are stimulating for understanding common and diverse physical aspects within the members of the sample. Worth considering here is our discussion about the dust formation correlated effects in 2004gk (as being one of the rare Ibc SNe showing such possibility). As a consequence of the present paper we encourage future quantitative investigations of dust formation in SESNe. This would help us better understand this subclass and their environments and might and might help explain the origin of interstellar dust considering that core collapse SNe are among the dust sources in the universe.
Clearly, much is still to be done in order to eventually disclose new frontiers in both observations and theory of SESNe.
Acknowledgments:
The work of A. Elmhamdi was supported by KSU College of Science-Research center project No (Phys/2009/18). The work of D.Tsvetkov was partly supported by the Russian Leading Scientific Schools Foundation under grant NSh.433.2008.2 and by the RFBR grant 10-02-00249a. We would like to thank R. Kirshner, R. Quimby, M. Modjaz, T. Matheson and C. Wheeler for helpful comments and stimulating discussions about SNe 2004ao and 2004gk observations. A. Elmhamdi thanks V.Stanishev and T. Purismo (at NOT observatory) for the insightful discussions about SN 2006gi. The authors are grateful to S.Yu. Shugarov, who made some of the observations. A. Elmhamdi thanks S. Benetti for the useful data and comments on SN 1999dn. We acknowledge the usage of the HyperLeda and NED databases. We thank the referee for the very helpful and constructive suggestions.
References
- (1) Arnett, W. D. 1982, ApJ, 253, 785
- (2) Barbon et al. 1995, AAS, 110, 513
- (3) Benetti S., Turatto M., Valenti S. et al. 2010, MNRAS (accepted; arxiv:1010.3199B)
- (4) Cardelli, J. A., Clayton, G. C. Mathis, J. S. 1989, ApJ, 345, 245
- (5) Chevalier, C. Ilovaisky, S. A. 1991, AAS, 90, 225
- (6) Clocchiatti, A. Wheeler, J. C. 1997, ApJ, 491, 375
- (7) de Vaucouleurs, G. et al. 1991, Third reference Catalogue of Bright Galaxies (New York: Springer) (RC3)
- (8) Elmhamdi A., Danziger I. J., Cappellaro E. et al. 2004, AA, 426, 963
- (9) Elmhamdi, A.; Danziger, I. J.; Branch, D. et al. 2006, AA, 450, 305
- (10) Ensman, L. M. Woosley, S. E. 1998, ApJ, 333, 754
- (11) Gomez, G., Lopez, R., Acosta-PPulido, J. A. 2004, IAUC 8430
- (12) Hamuy, M., Maza, J., Pinto, P. A. et al. 2002, AJ, 124, 41
- (13) Hunter, D. et al., 2009, AA, 508, 371
- (14) Itagaki, K., Nakano, S., Puckett, T., Toth, D. 2006, IAUC 8751
- (15) Jeffery, D. J. 1999, Astro-ph/9907015.
- (16) Landolt, A. U. 1992, AJ, 104, 340
- (17) Matheson, T., Challis, P. Kirshner, R. 2004, IAUC 8304
- (18) Matheson, T., Filippenko, A. V., Li, W., Leonard, D. C. Shields, J. C. 2001, AJ, 121, 1648
- (19) Mattila, S. et al. 2008, MNRAS, 389, 141
- (20) Maurer, J.I. et al. 2010, MNRAS, 402, 161
- (21) Mei, S., et al. 2007, ApJ, 655, 144
- (22) Modjaz, M., Kirshner, R. P., Blondin, S., Challis, P. Matheson, T. 2008, ApJ, 687, 9
- (23) Modjaz, M. et al. 2009, ApJ, 702, 226
- (24) Nadyozhin, D. K. 1994, ApJS, 92, 527
- (25) Nakano, S. Itagaki, K. 2006, CBET, 640
- (26) Nozawa, T. et al. 2008, ApJ, 684, 1343
- (27) Patat, F., Cappellaro, E., Danziger, J. et al. 2001, AJ, 555, 900
- (28) Paturel, G. et al. 2003, AA, 412, 45
- (29) Quimby, R. et al. 2004, IAUC 8446
- (30) Richardson, D.; Branch, D. Baron, E. 2006, AJ, 131, 2233
- (31) Richmond M. W., et al., 1996, AJ, 111, 327
- (32) Richmond M. W., Treffers R. R., Filippenko A. V., Paik Y., 1996, AJ, 112, 732
- (33) Saunders, W., Sutherland, W. J. Maddox, S. J., 2000, MNRAS, 317, 55
- (34) Schlegel, E. M. Kirshner, R. P. 1989, AJ, 98, 577
- (35) Schlegel D. J., Finkbeiner D. P. Davis M. 1998, 500, 525
- (36) Shigeyama, T., Nomoto, K., Tsujimoto, T., Hashimoto, M. 1990, ApJ, 361, 23
- (37) Singer, D. Li, W. 2004, IAUC 8299
- (38) Smith, N., Foley, R. Filippenko, A. V. 2008, ApJ, 680, 568
- (39) Soderberg, A. M., Kulkarini, S. R. Frail, D. A. 2004, ATel, 351
- (40) Sollerman, J., Holland, S. T., Challis, P. et al. 2002, AA, 386, 944
- (41) Springob, C. M., Haynes, M. P., Giovanelli, R. Kent, B. R., 2005, ApJS, 160, 149
- (42) Stanishev, V., Pursimo, T., Henriksen, C. Sharapov, D. 2006, CBET, 635, 1
- (43) Stritzinger M., et al., 2002, AJ, 124, 2100
- (44) Swartz, D. A. Wheeler, J. C. 1991, ApJ, 379, 13
- (45) Taubenberger, S. et al. 2006, MNRAS, 371, 1459
- (46) Taubenberger, S. et al. 2009, MNRAS, 397, 677
- (47) Theureau, G. et al. 1998, AAS, 130, 333
- (48) Turatto, M., Benetti S. and Cappellaro E., 2003, From Twilight to Highlight: The Physics of Supernovae: Proceedings of the ESO/MPA/MPE Workshop Held at Garching. Springer, Berlin, p. 200
- (49) Valenti S. et al., 2008, ApJ, 673, 155
- (50) Yamaoka, Y. Nomoto, K. 1991, In Proc. Workshop on “”, p. 193, ed. Danziger I. J., ESO, Munich.