First Overtone CO Bands in the Giant Component of RS Ophiuchi: the 12C/13C Ratio in 2008
Abstract
We present an analysis of a high resolution () infrared spectrum of the RS Oph secondary around the first overtone CO bands, obtained in 2008 May on the Gemini South 8 m. The 12CO and 13CO bands are well-resolved, and we compute synthetic spectra to determine the 12C/ 13C ratio. We find 12C/ 13C , consistent with the interpretation of the secondary as red giant which has evolved beyond the first drege-up phase of evolution.
keywords:
binaries: symbiotic — novae, cataclysmic variables — stars: abundances — stars: individual (RS Oph)1 INTRODUCTION
RS Ophiuchi is a recurrent nova (RN), an interacting binary system in which multiple nova outbursts have been observed; it has undergone eight known or suspected outbursts since 1898 (Anupama, 2008), the most recent occurring on 2006 February 12.83; we take this date as .
RS Oph consists of a white dwarf (WD) primary close to the Chandrasekhar limit, accreting material from a red giant (RG) secondary with a substantial wind (Fekel et al., 2000). The RN eruption is explained in terms of a thermonuclear runaway (e.g., Starrfield, 2008; Anupama, 2008) following the accretion of sufficient mass by the WD to trigger ignition. If the mass accreted by the WD is greater than the mass ejected then the mass of the WD must increase, so the ratio of mass accreted to mass ejected will determine whether or not RS Oph is a potential Type Ia supernova progenitor (Sokoloski et al., 2006; Panagia et al., 2006). Drake et al. (2009), modeling the X-ray absorption spectra observed with Chandra after the 2006 February outburst, argue that the mass ejected from the WD in the RS Oph system is . However, Worters et al. (2007) argue that the RG in the RS Oph system loses , while WD accretes at rates of Ṁ, suggesting that of material is accreted during the inter-outburst interval. Intercomparison of mass-loss rates from the RG, to the amount of material ejected by the WD, can determine whether symbotic systems are candidate SN progenitors (Panagia et al., 2006); however mass-loss rates are of course difficult to pin down observationally.
Pavlenko et al. (2008) showed that the secondary in RS Oph is a RG with = K and solar metallicity, but with a deficit of carbon and an overabundance of nitrogen with respect to solar. Rushton et al. (2009) have modeled the spectral energy distribution of RS Oph in the near-IR (1–5m) and found that is essentially constant over the period 2006 August – 2008 July. Nitrogen overabundance, and carbon underabundance, is typical of “normal” red giants due to the conversion of C to N in the CN-cycle of hydrogen burning and the subsequent dredge-up of the products on the RGB (e.g., Smith & Lambert, 1985, 1986; Smiljanic et al., 2009). Furthermore, the material accreting onto the WD from the M giant secondary in the RS Oph system likely is N-enhanced (see Fig. 14 of Ness et al., 2009). Interestingly, the C and N abundances for RS Oph found by Pavlenko et al. (2008) are similar to those in the RG-WD binary (star #69) in the open cluster IC 4756 (Smiljanic et al., 2009).
The 12C/ 13C isotopic ratio is of key importance for understanding the evolutionary status of RGs. At the beginning of the RG branch (RGB), the deepening convective envelope brings nuclear-processed matter from the core up to the surface of the star. As a result of the first dredge-up, the carbon isotopic ratio decreases up to a factor , depending on stellar mass and metallicty (Charbonnel, 1994), and standard models of stellar evolution predict no change in 12C/ 13C thereafter. However, observations of evolved RGs with progenitor mass M⊙ indicate that the 12C/ 13C ratio continues to decrease after the completion of the first dredge-up event (Smith et al., 2002; Tautvaišienė et al., 2005; Smiljanic et al., 2009, and references therein). Most probably further mixing, or some non-standard mixing mechanisms, work in low mass stars as they are ascending the RGB (Charbonnel, 1994, 1995). Anti-correlation of the carbon and nitrogen abundances, as is seen in RS Oph (Pavlenko et al., 2008), is well known for a variety of RGs with a range of metallicities (Smith et al., 2005, and references therein).
The 12C/ 13C ratio is also of fundamental importance in understanding the nature of the secondary of RNe, as it is a reflection of the relative importance of 12C, 13C processing and dredge-up. Following the 1985 eruption, Evans et al. (1988) estimated a 12C/ 13C ratio of for the RG in RS Oph on the basis of a low resolution infrared (IR) spectrum, while Scott et al. (1994) found that the strength of the first overtone CO bands declined by a factor over the first 7 years after the eruption (see also Harrison et al., 1993).
In this paper, we discuss Phoenix echelle observations of the first overtone vibration-rotation features of CO, obtained in May 2008, some days after the 2006 outburst, to determine the 12C/ 13C ratio in the atmosphere of the RS Oph secondary.
2 OBSERVATIONS AND REDUCTION
High-resolution -band spectral observations of RS Oph were carried out on the Gemini-South 8 m telescope using the Phoenix spectrograph (Hinkle et al., 2003) during queue observing runs on the nights of 23 and 24 May 2008 UT (days 830.7, 831.7 from the 2006 eruption), as part of our Gemini program GS-2008A-Q47. Defining zero orbital phase as maximum RG radial velocity, the observations discussed here were obtained at binary phase 0.78, when approximately 88% (assuming the adopted inclination ; Fekel et al., 2000; Ribeiro et al., 2009) of the visible photosphere of the RG was illuminated by the WD.
Observations of RS Oph (as well as the telluric standard HR6378 at a comparable airmass) were obtained by nodding the target at multiple positions along the long axis of the slit (e.g., Smith et al., 2002). Observations of the telluric standard were conducted immediately before and after observations of RS Oph, with flats and darks being obtained at the conclusion of each observational sequence comprising a given grating and order-sorting filter combination. With our instrument configuration, the Phoenix spectrograph produces single-order echelle spectra with a resolution of (corresponding to a resolution element of pixels). Individual spectra were reduced and combined using standard IR data reduction techniques, as well as those unique to Phoenix (Hinkle et al., 2003, 2007). Table 1 summarizes the observational data discussed herein.
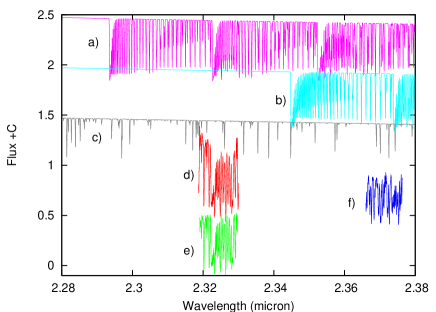
The echelle spectra discussed here covered the m and m spectral regions; we refer to these as spectra “B” and “R” respectively. Both spectra are affected by curvature of the echelle orders. We reduce the intensities of spectral features in most regions using the theoretical spectrum continuum as reference points. The effects are more pronounced in the “B” spectral region (see Fig. 1) and we work with the spectra in terms of residual fluxes. We cannot determine the real continuum due to noise at the minimum fluxes. Therefore, we carried out fits to the observed spectrum using different levels of the continuum. These values of the virtual continuum we specify as pseudo-continuum. The results of the fits depends on the pseudo-continuum level, as discussed in section 4.
3 ANALYSIS PROCEDURE
3.1 Spectral synthesis
We have used the technique of synthetic spectra to carry out our analysis of the IR spectrum of RS Oph; details may be found in Pavlenko et al. (2004, 2008). We computed the spectra within the classical framework, assuming LTE, plane-parallel media, and no sinks or sources of energy in the atmosphere; transfer of energy is provided by the radiation field and by convection. Strictly speaking, these assumptions are not completely valid in the atmosphere of the RG in RS Oph; however, this approach allows us to describe the IR spectral energy distribution of RS Oph over a wide range of wavelengths, and we consider that none of our assumptions is of crucial importance in the spectrum formation processes.
In the most general case, any determination of abundance depends on many adopted parameters: , and , and the abundance of other elements. In this paper we solve a restricted task using fits to the two observed narrow spectral regions in the inrared. Therefore, to reduce the number of fitted parameters in the minimization procedure, we adopt for the secondary atmosphere = 4200 K and , obtained from fitting near-IR low resolution spectra (Pavlenko et al., 2008). We then fix the abundances of carbon and nitrogen at and on the scale , as also determined from fitting the low resolution spectra by Pavlenko et al. (2008); other abundances are taken to be solar.
We assume that the observed spectra are broadened by macroturbulence in the RG atmosphere, and by instrumental broadening; both are implemented in the modelling by smoothing the computed spectra with a gaussian of FWHM 1.9Å, which is a reasonable approach for fitting stellar spectra. In fact, the appropriate values of FWHM were determined by our minimisation procedure fitting to observed spectrum (see Pavlenko et al., 2004).
To determine the isotopic ratio 12C/ 13C we follow conventional procedures. Namely, we define as the fraction of 12CO molecules, i.e. , where is the number density of the molecule M. Then, the fraction of 13CO molecules is clearly . In this approach we operate with two parameters, i.e. the abundance of carbon, (as specified above) and the isotopic ratio . Then all synthetic spectra are computed for the 12CO and 13CO molecular densities, determined by taking into account the input isotopic ratio 12C/ 13C.
The “B” spectrum contains no 13CO lines, only 12CO (Fig. 1). Again, we note that, in the most general case, the intensities of these lines depend on both log N(C) and . We used this spectrum to determine the microturbulent velocity for the adopted value of log N(C) in the atmosphere of the RG. The “R” spectrum contains both 12CO and 13CO lines; we used this spectrum to determine the carbon isotopic ratio 12C/ 13C.
| Date | Filter | range | Exposure | Airmass |
|---|---|---|---|---|
| (2008 UT) | (m) | (s) | ||
| 23 May | K4308 | 1650 | 1.18 | |
| 24 May | K4220 | 1870 | 1.12 |
A set of continuum opacity sources from ATLAS9 (Kurucz, 1993) with some additional amendments (Pavlenko et al., 2004) was used in our modeling, as well as the VALD atomic line list (Kupka et al., 1999), and line lists of 12CO and 13CO from Goorvitch (1994). The quality of the Goorvitch data is demonstrated by the fact that Pavlenko (2008) recently fitted theoretical spectra to a high signal-to-noise 2.3m spectrum of Arcturus, giving excellent fits to the CO bands. Water vapor lines were not included because numerical experiments with the Barber et al. (2006) H2O line list showed that their contribution to the total opacity in the wavelength range under consideration is negligible. We adopt the Voigt profile for the shape of each line; here (see Gray, 2005, for details). Damping constants , , and are respectively due to the natural, van der Waals and Stark broadening of atomic and molecular lines, computed using data from various databases (Kurucz, 1993; Kupka et al., 1999), or the approximation of Unsöld (1955). Natural and van der Waals broadening dominate in the case of RS Oph, due to the low pressure and electron density in the RG atmosphere. We note that
-
–
molecular lines are less sensitive to pressure broadening, because they form in low density regions of the RG atmosphere;
-
–
thermal velocities of the CO molecule are lower than those of C and O atoms due to its higher mass. For the CO molecular lines, broadening by microturbulence dominates, especially in the low temperature regime; we determine the microturbulence velocity in Section 4.
-
–
the wings of molecular lines are blended in the spectra of the RG.
The contributions of the various molecular and atomic species to the total opacity in the 2.28–2.39m spectral region are shown in Fig. 1, from which we see that absorption by CO dominates.
Full details of our procedure of fitting theoretical fluxes to observed SEDs may be found in Pavlenko et al. (2004).
3.2 The effect of circumstellar dust
Dust is present in the RS Oph system (Evans et al., 2007; van Loon, 2008; Woodward et al., 2008), emitting primarily at m. However Rushton et al. (2009) have shown that there is also evidence for dust emission at shorter (m) wavelengths, and that emission by the dust envelope may be variable.
The properties of the dust shell around RS Oph have been discussed by Evans et al. (2007), van Loon (2008) and Woodward et al. (2008). Pavlenko et al. (2008) and Rushton et al. (2009) have shown that the 2m spectral region of RS Oph is not affected by emission from the hot ( K) dust known to currently envelop RS Oph, which is likely a permanent feature of the system. As this dust emission becomes prominent longward of 3m, we are justified in carrying out our analysis for the dust-free case.
4 RESULTS
In principle the 12C/ 13C isotopic ratio can be determined from any pair of the unblended lines of 12CO and 13CO. However, in our spectra these lines are blended and we are unable to distinguish the 12CO lines from the weaker 13CO lines at our spectral resolution. Absorption of both species form common blends in the observed and modelled spectra. Only the band heads of the CO system can be clearly indentified in the spectrum, formed by saturated lines which have rather weak dependence on the CO abundances. Moreover, they form in the outermost layers of RG atmosphere which cannot be modelled in the framework of classical approach. Non-saturated lines, especially those of intermediate strength, are a better choice for the abundance determination; however they are sensitive to the microturbulent velocity.
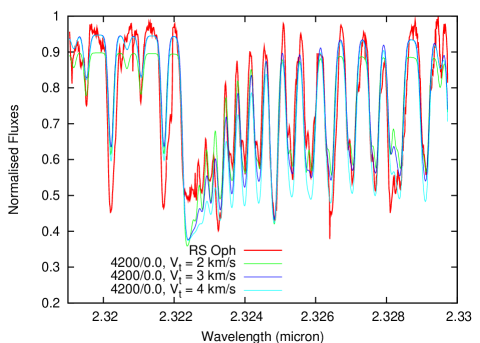
We determined the microturbulent velocity from the fits to the “B” spectrum (m), which is formed completely by absorption of 12CO lines. The spectrum shows a strong dependence on (Fig. 2). The minimization procedure for the parameter (see below) gives a definite value for the microturbulent velocity of = km s-1 (close to the value assumed in Pavlenko et al. 2008). In what follows, we compute spectra with = 3 km s-1 to fit the “R” spectrum and determine the 12C/ 13C ratio in RS Oph.


To determine the 12C/ 13C ratio, we fitted computed spectra to the observed “R” spectrum. We note that:
-
1.
in the computed spectrum we see flux maxima which can be treated as continuum. At these wavelengths the contribution of absorption in the line wings is negligible.
-
2.
the “R” spectrum is affected by noise, as already noted. We attribute these features to noise because their widths do not match the spectral resolution;
-
3.
to study the effect the continuum level has on our results we varied the level of continuum in the observed spectrum; for each individual level we found values of 12C/ 13C.
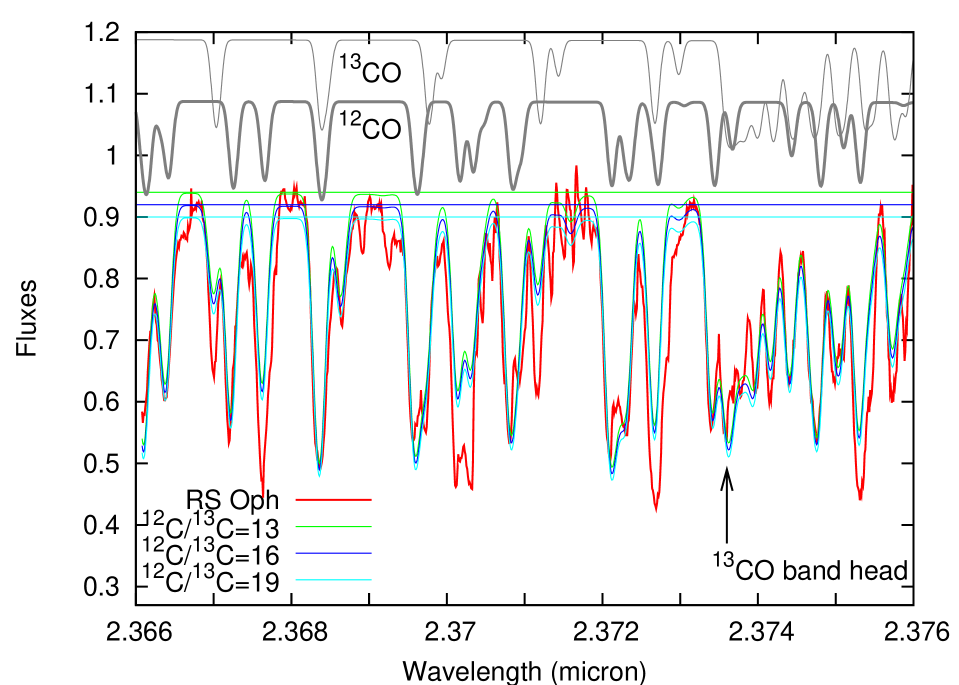
The continuum level in the observed spectrum was adopted at the following points: , the value corresponding to the level of the formal maximum flux in the observed spectrum, here is the residual flux. Adopted levels of continuum in the observed spectrum are clearly seen in Fig. 3.
In the Fig. 3 we show the dependence of the synthetic spectra on the 12C/ 13C ratio for =3 km s-1, while in Fig. 4 we show the dependence of the best-fit parameter on the 12C/ 13C ratio for different levels of continuum in the observed spectrum.
Using our fitting procedure, we found a clear dependence of the minimum value and of the 12C/ 13C ratio on the level of pseudo-continuum. The formal best-fit (12C/ 13C) is obtained with . However, visual comparison with the observed spectrum shows that the level of the theoretical pseudo-continuum is too low in this case. As we see from Fig. 3, the best-fits with 12C/ 13C well reproduce the profiles of the CO lines, dependent on the chosen pseudo-continuum and noting that the values of are high due to the presence of unidentified spectral features. Most likely, these features form beyond the atmosphere of the RG (see below). Therefore, using goodness of fit as judged “by eye” to complement our minimization procedure, we choose the value from the best-fits of synthetic spectra and pseudo-continuum, computed for our assumed , and abundances to the observed “R” spectrum.
Interpretation of the “R” spectrum is not as straight-forward as that of the “B” spectrum, in that the noise level increases to longer wavelengths. Indeed the noise level in the “R” spectral region is generally higher than that in the “B”, likely due to a decrease in atmospheric transmission longward of about 2.4m. Also, absorption features are seen in the “R” spectrum which cannot be identified with CO; most likely, these are a consequence of the data reduction procedure, where time-variable telluric features are not adequately removed from the spectra. Indeed comparison of the computed and “R” spectra reveals the presence of some unidentified features in the observed spectrum, although some of these may be artifacts produced by the removal of the telluric spectrum. This is not true for the “B” spectrum. The 13CO lines, which are our main interest, are clearly seen in the “R” spectral region; none of the unidentified features in the “R” spectrum region are identified with 12CO, 13CO lines and so their presence does not affect our conclusions.
5 DISCUSSION
We have determined the 12C/ 13C isotopic ratio in the atmosphere of the RS Oph secondary for orbital phase 0.78 – when approximately 88% of the visible RG surface was irradiated by ultraviolet radiation emitted by the WD – to be . This is consistent with that expected after the first dredge-up (Charbonnel, 1994), and suggests that the RG in RS Oph has undergone first dredge-up and has evolved beyond this evolutionary stage.
In spectra shown by Rushton et al. (2009), numerous emission lines are visible in the spectral regions around m. These form in material ejected in the 2006 eruption, or in the shocked or ionized RG wind, in each case well away from the photosphere of the secondary. Moreover, in optical spectra we see pronounced effects of irradiation.
By the time of our observations in 2008, RS Oph had essentially returned to quiescence, and we do not expect irradiation to have a strong impact on the spectrum in the 2m region. Furthermore, the molecular bands we observe in the IR are formed deep in the atmosphere of the RG. However, as evidenced by the strong emission line spectrum (Rushton et al., 2009), a hot circumstellar envelope exists and may affect the spectral details, even in the IR. As we see in Fig. 2, the fits to the saturated 12CO band at 2.32m are imperfect, in that the observed molecular lines are shallower than the theoretical bands, which are more saturated. This poorer fit could, in part, be due to the uncertainty in the continuum level in the “R” spectrum (Fig. 3). On the other hand, weakening of the CO can be interpreted as a consequence of higher temperatures in the regions where it is formed, so that the structure of the outer layers of the atmosphere of the RG may differ from the classical model atmosphere assumed here.
We note that Rushton et al. (2009) report weaker CO first overtone absorption in their 2007 observations than in their 2006 and 2008 observations. Similar changes were observed following the 1985 outburst by Scott et al. (1994), who attributed this behaviour to contamination of the RG by the 1985 ejecta. Rushton et al. conclude that the RG is intrinscially variable. In addition we may expect strong effects due to inhomogeneities, a stellar wind, and NLTE, but a consideration of these factors is beyond the scope of this paper. These phenomena affect the spectra of single canonical giants like Arcturus (see discussion in Tsuji 2009).
With the mass function from Fekel et al. (2000), inclination from Fekel et al. (2000) and Ribeiro et al. (2009), we determine a mass M⊙ for the RG if the WD is close to the Chandrasekhar limit. While the 12C/ 13C ratio after first dredge up is insensitive to the mass of the RG progenitor (and of course the situation in RS Oph is complicated by its binarity and RN eruptions), the 12C/ 13C ratio we find is consistent with this value because, on the basis of the 12C/ 13C ratio, we can probably exclude a progenitor mass for the RG below M⊙ (cf. Fig. 2 of Charbonnel, 1994). We can also of course conclude that the WD progenitor had mass M⊙ so that some 0.8 M⊙ of material has been deposited in the environment of RS Oph in addition to any material contributed by the RG wind.
6 CONCLUSIONS
We have carried out an analysis of a high resolution spectrum of the RG component of the RN RS Oph. We find 12C/ 13C, which sheds new light on the history and evolution of the RS Oph system. The secondary star in RS Oph is a RG with a deficiency of carbon and an overabundance of nitrogen, as predicted by theories of the first approach to the RGB after first dredge up. The 12C/ 13C ratio we have found is consistent with the typical values (Smiljanic et al., 2009) observed in the atmospheres of RG stars in open clusters after first dredge up, and further suggests that the RG in RS Oph has undergone some further mixing, which would have depressed the 12C/ 13C ratio still further.
Furthermore, in view of the strong variability of the CO bands following the 1985 (Harrison et al., 1993; Scott et al., 1994) and 2006 (Rushton et al., 2009) eruptions, it is important to monitor the IR spectrum of the RG in RS Oph to understand the reason for the changes observed.
We will provide a detailed analysis of abundances in the RG in RS Oph in forthcoming papers.
7 Acknowledgments
This manuscript is based on observations obtained at the Gemini Observatory, which is operated by the Association of Universities for Research in Astronomy, Inc., under a cooperative agreement with the NSF on behalf of the Gemini partnership: the National Science Foundation (United States), the Science and Technology Facilities Council (United Kingdom), the National Research Council (Canada), CONICYT (Chile), the Australian Research Council (Australia), Ministério da Ciéncia e Tecnologia (Brazil) and Ministerio de Ciencia, Tecnología e Innovación Productiva (Argentina).
This work was supported by an International Joint Project Grant from the UK Royal Society. YP’s and BK’s studies are partially supported by a program Cosmomicrophysics of NASU Ukraine. This research has made use of the SIMBAD database, operated at CDS, Strasbourg, France. We thank an anonymous Referee for helpful comments on an earlier version of this paper.
References
- Anupama (2008) Anupama, G. C. 2008, in ASP Conference Series 401, RS Ophiuchi (2006) and the recurrent nova phenomenon, eds. A. Evans, M. F. Bode, T. J. O’Brien, M. J. Darnley, (San Franscico: ASP), 31
- Barber et al. (2006) Barber R.J., Tennyson J., Harris G.J., Tolchenov R. 2006, MNRAS, 368, 107
- Brandi et al. (2009) Brandi, E., Quiroga, C., Mikołajewska, J., Ferrer, O. E., Garcıa, L. G. 2009, A&A, 497, 815
- Charbonnel (1994) Charbonnel. C. 1994, A&A, 282, 811
- Charbonnel (1995) Charbonnel. C. 1995, ApJ, 453, L41
- Drake et al. (2009) Drake, J. J., et al. 2009, ApJ, 691, 418
- Evans et al. (1988) Evans, A., Callus, C. M., Albinson, J. S., Whitelock, P. A., Glass, I. S., Carter, B., Roberts, G. 1988, MNRAS, 234, 755
- Evans et al. (2007) Evans, A., et al. 2007, ApJ, 671, L175
- Fekel et al. (2000) Fekel, F. C., Joyce, R. R., Hinkle, K. H., Skrutskie, M. F. 2000, AJ, 119, 1375
- Goorvitch (1994) Goorvitch, D. 1994, ApJs, 95, 535
- Gray (2005) Gray, D. F., 2005, The Observation and Analysis of Stellar Photospheres, Third edition, Cambridge University Press
- Harrison et al. (1993) Harrison, T. E., Johnson, J. J., Spyromilio, J. 1993, AJ, 105, 320
- Hinkle et al. (2003) Hinkle, K. H., et al. 2003, Proc. SPIE, 4834, 353
- Hinkle et al. (2007) Hinkle, K. H., et al. 2007, ApJ, 664, 501
- Kupka et al. (1999) Kupka, F., Piskunov, N., Ryabchikova, T. A., Stempels, H. C., Weiss, W. W. 1999, A&As, 138, 119
- Kurucz (1993) Kurucz, R. L. 1993, CD ROM 9, 18 (Harvard-Smithsonian Observatory)
- Ness et al. (2009) Ness, J.-U., et al. 2009, ApJ, 137, 3414
- Panagia et al. (2006) Panagia, N., Van Dyk, S. D., Weiler, K. W., Sramek, R. A., Stockdale, C. J., Murata, K. P. 2006, ApJ, 646, 369
- Pavlenko (1997) Pavlenko, Ya. V. 1997, Astron. Reps, 41, 537
- Pavlenko (2008) Pavlenko, Ya. V. 2008, Astronomy Reports, 52, 749
- Pavlenko & Jones (2002) Pavlenko, Ya. V., Jones, H. R. A. 2002, A&A, 396, 967
- Pavlenko et al. (2004) Pavlenko, Ya. V., Geballe, T. R, Evans, A., Smalley, B., Eyres, S. P. S., Tyne, V. H., Yakovina, L. A. 2004, A&A, 417, L39
- Pavlenko et al. (2008) Pavlenko, Ya. V., Evans, A., Kerr, T., Yakovina, L. A., Woodward, C. E., Lynch, D., Rudy, R., Pearson, R. L., Russell, R. W. 2008, A&A, 485, 541
- Ribeiro et al. (2009) Ribeiro, V. A. R. M., et al. 2009, ApJ, 703, 1955
- Rushton et al. (2009) Rushton, M., et al. 2009, MNRAS, in press.
- Sokoloski et al. (2006) Sokoloski J. L., Luna G. J. M., Mai K., Kenyon S. J. 2006, Nature, 442, 276
- Scott et al. (1994) Scott, A. D., Rawlings, J. M. C., Krautter, J., Evans, A. 1994, MNRAS, 268, 749
- Smiljanic et al. (2009) Smiljanic, R., Gauderon, R., North, P., Barbuy, B., Charbonnel, C., Mowlavi, N. 2009, A&A, in press (arXiv:0810.1701v2)
- Smith et al. (2005) Smith, G. H, Briley, M. M., Harbeck, D. 2005, AJ, 129, 1589
- Smith & Lambert (1986) Smith, V. V., Lambert, D. L. 1986, ApJ, 311, 843
- Smith & Lambert (1985) Smith, V. V., Lambert, D. L. 1985, ApJ, 294, 326
- Smith et al. (2002) Smith, V. V., Hinkle, K. H., Cunha, K. 2002, AJ, 124, 3241
- Starrfield (2008) Starrfield, S. 2008, in ASP Conference Series 401, RS Ophiuchi (2006) and the recurrent nova phenomenon, eds. A. Evans, M. F. Bode, T. J. O’Brien, M. J. Darnley, (San Franscico: ASP), 4
- Tautvaišienė et al. (2005) Tautvaišienė, G., Edvardsson, B., Puzeras, E., Ilyin, I. 2005 A&A, 431, 933
- Tsuji (2009) Tsuji, T. 2009, astro-ph/0907.0065.
- Unsöld (1955) Unsöld, A. 1955, Physik der Sternatmospheren, 2nd ed. (Springer: Berlin)
- van Loon (2008) van Loon, J. Th. 2008, in ASP Conference Series 401, RS Ophiuchi (2006) and the recurrent nova phenomenon, eds. A. Evans, M. F. Bode, T. J. O’Brien, M. J. Darnley, (San Franscico: ASP), 90
- Wallerstein et al. (2008) Wallerstein, G., Harrison, T., Munari, U., Vanture, A. 2008, PASP, 120, 492
- Woodward et al. (2008) Woodward, C. E., et al. 2008, in ASP Conference Series 401, RS Ophiuchi (2006) and the recurrent nova phenomenon, eds. A. Evans, M. F. Bode, T. J. O’Brien, M. J. Darnley, (San Franscico: ASP), 260
- Worters et al. (2007) Worters, H. L., Eyres, S. P. S., Bromage, G. E., Osborne, J. P. 2007, MNRAS, 379, 1557