Measurement of the c-axis optical reflectance of AFe2As2 (A=Ba, Sr) single crystals: Evidence of different mechanisms for the formation of two energy gaps
Abstract
We present the c-axis optical reflectance measurement on single crystals of BaFe2As2 and SrFe2As2, the parent compounds of FeAs based superconductors. Different from the ab-plane optical response where two distinct energy gaps were observed in the SDW state, only the smaller energy gap could be seen clearly for Ec-axis. The very pronounced energy gap structure seen at a higher energy scale for Eab-plane is almost invisible. We propose a novel picture for the band structure evolution across the SDW transition and suggest different driving mechanisms for the formation of the two energy gaps.
pacs:
74.25.Gz, 74.70.Xa, 75.30.FvFor quasi-two dimensional layered materials, striking differences could exist in the in-plane and out-of-plane charge transport and dynamics. For example, in some high-Tc cuprates, metallic in-plane charge transport coexists with nonmetallic conductivity along the c-axisAndo ; Uchida . The contrasting behavior violates the conventional concept of band electron transport, and has been the subject of intensive study. Fe-pnictide superconducting materials also crystalize in the layered structure with Fe-As layers separated by alkaline metal ions or other insulator-like layers. Band structure calculations based on the local-density approximation (LDA) or generalized gradient approximations (GGA) indicate dominantly two-dimensional (2D) cylinder-like Fermi surfaces (FSs) along the c-axisLebegue ; Singh ; Ma . It is important to see whether or not the Fe-pnictides share similar anisotropic charge dynamical properties with cuprates.
Optical spectroscopy is a powerful technique to investigate charge dynamics and band structure of a material as it probes both free carriers and interband excitations. In particular, it yields direct information about the energy gap formation in the broken symmetry state. Optical spectroscopy studies on the ab-plane properties of different Fe-pnictides and chalcogenides systems have been reported by several groups.Li ; Hu122 ; Pfuner ; Yang ; DWu ; Qazilbash ; GFChen1 ; Hu111 ; Akrap ; Moon ; Chen1111 ; Heumen ; Kim For the parent compounds of Fe-pnictides, the measurements provide clear evidence for the formation of the partial energy gaps in the magnetic phase, supporting the itinerant picture that the energy gain for the antiferromagnetic ground state is achieved through the opening of a spin-density-wave (SDW) gap on the FSs.Hu122 ; DWu ; Akrap ; Moon ; Chen1111 For the superconducting samples, the superconducting pairing gaps were also detected by the technique.Li ; Heumen ; Kim However, optical investigations have not been carefully done on the c-axis response of Fe-pnictide materials. There is only one work in the literature containing optical data along the c-axis.DWu Unfortunately, the data were limited to the high frequencies, above 700 cm-1 . Because of this limitation, neither the free-carrier response nor any feature related to the SDW gap were observed. In fact, the reported reflectance data appear to have extraordinarily low values. As information about the anisotropic charge dynamics is extremely important for understanding the materials, a detailed and careful determination of the c-axis optical response is highly necessary.
In this letter we present the c-axis (Ec) optical reflectance measurement over broad frequencies on thick BaFe2As2 and SrFe2As2 single crystal samples. We observed the SDW energy gap formation in the low-T magnetic ordered state. However, different from the ab-plane response where two distinct energy gaps were identified for AFe2As2 (A=Ba, Sr), only the gap corresponding to the smaller energy scale of Eab-plane could be clearly seen for the polarization parallel to the c-axis. The more pronounced gap structure at the higher energy scale for Eab-plane becomes almost invisible. The significant difference between the two polarizations has important implication for the electronic structure of those compounds. A schematic picture for the band structure evolution across the structural/magnetic transition was proposed to understand the experimental findings.
Large-sized single crystals of BaFe2As2 and SrFe2As2 were grown from the FeAs flux in Al2O3 crucibles sealed in quartz tubes. The growth procedure is similar to the description in our earlier work Chen2 except for one major difference: the crucible and quartz tube were placed in a direction of 45 degree relative to the vertical. After completing the growth procedure and breaking the crucible, we can easily find relatively thick crystals growing from the inner surface of the crucible along the direction at 45 degree relative to the crucible cylinder axis (i.e. crystals grow vertically). The dc resistivity measured by the four contact technique on cleaved ab-plane was found to be almost identical to the data presented in our early work, showing a sharp drops at 138 K and 200 K for BaFe2As2 and SrFe2As2, respectively, being ascribed to the formation of SDW order.Hu122 We performed x-ray diffraction measurement to check the single crystalline nature of our samples and their orientation. The crystals were then cut in a direction perpendicular to the cleaved ab-plane. The cutting surfaces were finely polished for the c-axis polarization measurement.
The optical reflectance measurements with Ec-axis were performed on a Bruker IFS 66v/s spectrometer in the frequency range from 50 to 25000 cm-1. An in situ gold and aluminium overcoating technique was used to get the reflectivity R(). The real part of conductivity is obtained by the Kramers-Kronig transformation of R(). A Hagen-Rubens relation was used for low frequency extrapolation. A dependence was used for high frequency extrapolation up to 300000 cm-1 , above which a dependence is employed.
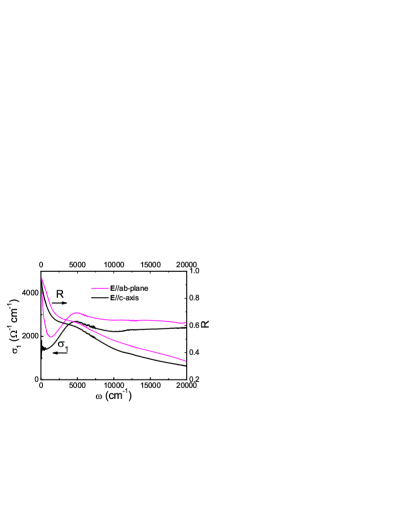
Figure 1 shows the c-axis R() and at room temperature over a broad frequency range up to 20000 cm-1 for BaFe2As2. For a comparison, we also plot the optical spectra with Eab-planeHu122 . We can see that the overall R() along the c-axis is quite similar to that in the ab-plane except for relatively lower values. This is dramatically different from the optical spectra of some high-Tc cupratesUchida and other layered compounds, for example, layered ruthenatesKatsufuji , where the c-axis R() shows much lower values and quite different frequency-dependent behavior from the ab-plane. This observation suggests that the band structure of Fe-pnictide should be quite three-dimensional (3D), in contrast to the expectation based on its layered crystal structure. The difference in spectra between ab-plane and the c-axis seems to become larger at low frequencies. An extrapolation to zero frequency, or the dc conductivity, shows an anisotropy ratio of about 2.8. This matches well with the anisotropy ratio determined directly from the dc resistivity measurement by a careful Montgomery technique (about 31)Tanatar . We noticed that the c-axis reflectance values obtained here are much higher than the data presented by Wu et al. on a EuFe2As2 sampleDWu . The reflectance values in their measured frequency range (above 700 cm-1 ) are already below 0.4, leading to extremely low values of conductivity (below 100 cm-1 at 700 cm-1 ). We remark here that we repeated measurement of Ec on another crystal grown from a different batch and achieved almost identical result.
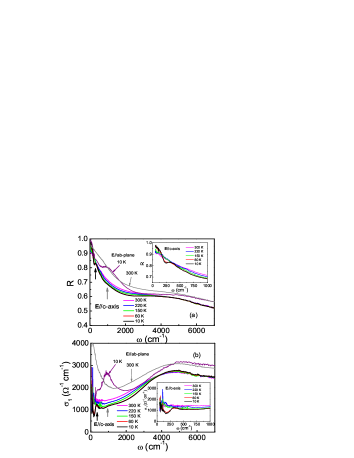
The temperature dependences of the R() and spectra of BaFe2As2 below 7000 cm-1 (1eV) are plotted in Fig. 2 (a) and (b), respectively. In the mid-infrared region (near 4000 cm-1 ), there is a strong suppression feature in both R() and spectra. Essentially, the same feature is seen in the ab-plane optical response at slightly higher frequencies (near 5000 cm-1 ). For a comparison we also plot the in-plane R() and spectra at 300 K and 10 K in the figure.Hu122 The suppressed spectral weight in is largely transferred to the high frequencies above 5000 cm-1 for both polarizations. The suppression is a common feature for Fe-pnictide materials and is not directly related to the SDW order as it is seen well above the structural/magnetic transition temperature.Hu122 ; Hu111 ; Chen1111 Its origin remains to be explored. Most remarkably, the reflectance is strongly suppressed below 320 cm-1 upon entering the SDW ordered state. A sharp upturn appears at lower energy scale. The strong suppression in R() results in a prominent gap structure in . The sharp upturn at lower frequencies in R() leads to a narrow residual Drude component at very low frequencies (see the inset of Fig. 2 (a) and (b)). Above TSDW, the Drude feature is not clear for Ec-axis, being different from the spectra in the ab-plane. The data provide clear evidence for the partial energy gap formation along the c-axis in the SDW ordered phase as well. In the ab-plane optical spectra,Hu122 we observed two energy gaps in the SDW state with the conductivity peak energies near 360 cm-1 and 890 cm-1 . Here we found that the energy scale of the gap for Ec is close to the smaller one seen in the ab-plane . The more pronounced gap structure at higher energy in the ab-plane becomes extremely weak for the c-axis polarization in both R() and , as indicated by an upward grey arrow in the figure.
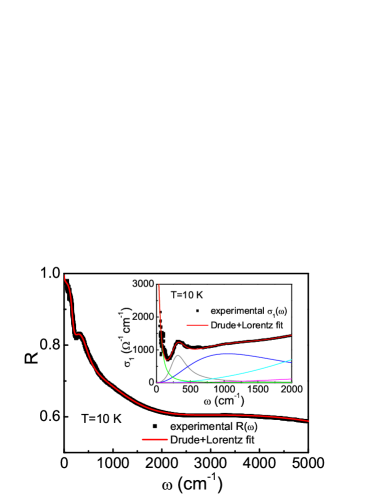
It is tempting to analyze the data in a more quantitative way. Since a residual narrow Drude component is present at very low temperature in the SDW state, it is relatively easy to isolate its spectral weight. We use a standard Drude-Lorentz model to decompose the spectra into different components:
| (1) |
Here, is the dielectric constant at high energy, the middle and last terms are the Drude and Lorentz components, respectively. The experimental R() and spectra at 10 K could be well reproduced by using a Drude and several several Lorentz peaks, as shown in Fig. 3Remark . This analysis leads to =3600 cm-1 and 1/=47 cm-1 for the Drude component at 10 K. Our earlier study on the ab-plane properties indicates that those two parameters are 4660 cm-1 and 55 cm-1 at 10 K, respectively.Hu122 Then we find that the anisotropy ratio of the spectral weight, which is equal to the ratio of the square of plasma frequency /, is about 60 at 10 K. The value indicates that the anisotropy of the band structure reconstructed in the SDW order state is not very strong. Since the Drude-like features above TSDW are not very clear, there is no unique or unambiguous way to isolate the Drude components from the overall spectra, we did not try to estimate those parameters at high temperatures.
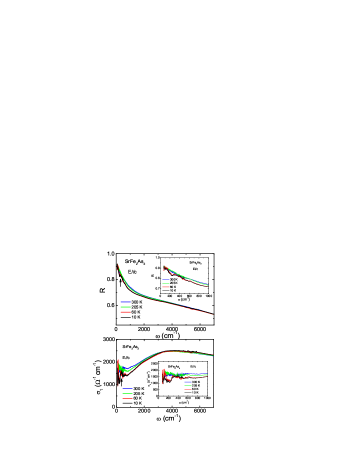
The substantial difference of low frequency gap structures in the SDW state between the two polarizations has important implication for the electronic structure of Fe-pnictides. It is important to check whether the observations are generic for 122-type parent compounds. For this purpose, we performed optical measurement on SrFe2As2 single crystals. Because the obtained SrFe2As2 crystals have smaller dimension along the c-axis, the signal-to-noise ratio at low frequencies is much smaller. Nevertheless, we observed essentially the same spectral features for SrFe2As2 as well. As shown in Fig. 4, only the smaller gap could be seen for Ec-axis in the SDW state, the large energy gap is almost invisible. Those experiments indicate that the observed spectral features are generic for 122-type undoped compounds.
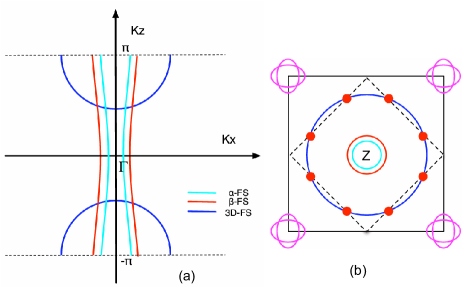
Understanding why two distinct gaps could be observed for Eab-plane but only a smaller one could be clearly seen for Ec-axis is a crucial issue here. It has important implication for the band structure evolution across the transition. We found that our data could be naturally explained by assuming that there are two types of FSs in the system: the 2D cylinder like FSs and a large-size 3D ellipsoid like FS, as schematically presented in Fig. 5. Presence of the large-size 3D ellipsoid FS with dominant Fe-3d orbital is indicated by the recent ab-initio LDA+Gutzwiller calculations, where electron correlations are taken into account beyond LDA Wang . Recent transportTanatar , upper critical fieldYuan , as well as ARPES experimentsLiu ; Malaeb also suggest the presence of a 3D FS.
If we neglect the small dispersion of those 2D FSs along the c-axis, the Fermi velocity along the c-axis becomes zero and the electrons on the 2D FSs would only couple to the polarized light with Eab-plane. On the other hand, the electrons on the 3D FS can couple to the light polarized along any direction. We suggest that the 2D cylinder-like hole FSs around and the 2D electron FSs around the corner of the Brillouin zone are strongly nested, which is the main driving force for the SDW instability of the system, while the 3D ellipsoid FS does not show any nesting with other FSs. Nevertheless, with the formation of the SDW order driven by the () nesting of 2D FSs, the new magnetic Brillouin zone boundary would cut the large-size 3D ellipsoid FS and result in an energy gap at the intersecting points as shown in Fig. 5 (b). This can be seen by optics in both Eab-plane and Ec. Then we ascribe the larger gap seen most clearly for Eab-plane to the nesting-driven gap opened on 2D FSs, the smaller one to the gap formed on 3D FS which could be considered as the consequence of the SDW order. Because the 2D FSs are more dramatically affected by the SDW instability than the 3D FS, we expect a reduction of the anisotropy in the magnetic ordered state.
To summarize, we have successfully grown thick single crystals of AFe2As2 (A=Ba, Sr) and investigated their optical properties. Our study revealed a clear difference in optical conductivity for Eab-plane and Ec-axis in the SDW state. The very pronounced energy gap structure seen at a higher energy scale for Eab-plane is almost invisible for Ec-axis, whereas the smaller energy gap could be seen in both polarizations. We propose a novel picture for the band structure evolution and suggest different driving mechanisms for the two energy gaps. The strong () nesting between disconnected 2D cylinder-like FSs is the main driving force for the SDW instability, leading to the opening of larger energy gap in the 2D FSs. The cutting of the magnetic Brillouin zone on the 3D FS leads to a smaller gap at the crossing region.
Acknowledgements.
This work is supported by the National Science Foundation of China, the Knowledge Innovation Project of the Chinese Academy of Sciences, and the 973 project of the Ministry of Science and Technology of China.References
- (1) Y. Ando et al., Phys. Rev. Lett. 77, 2065 (1996).
- (2) S. Uchida, K. Tamasaku, and S. Tajima, Phys. Rev. B 53, 14558 (1996).
- (3) S. Lebegue, Phys. Rev. B 75, 035110 (2007).
- (4) D.J. Singh and M.H. Du, Phys. Rev. Lett. 100, 237003 (2008).
- (5) Fengjie Ma and Zhong-Yi Lu, Phys. Rev. B 78, 033111 (2008).
- (6) G. Li et al., Phys. Rev. Lett. 101, 107004 (2008).
- (7) W. Z. Hu et al., Phys. Rev. Lett. 101, 257005 (2008).
- (8) F. Pfuner et al., Eur. Phys. J. B 67, 513 (2009).
- (9) J. Yang et al., Phys. Rev. Lett. 102, 187003 (2009).
- (10) D. Wu et al., Phys. Rev. B 79, 155103 (2009).
- (11) M. M. Qazilbash et al., Nature Physics 5, 647 (2009).
- (12) G. F. Chen et al., Phys. Rev. B 79, 140509(R) (2009).
- (13) W. Z. Hu et al., Rev. Phys. B 80, 100507(R) (2009).
- (14) A. Akrap et al., Phys. Rev. B 80, 180502(R) (2009).
- (15) S. J. Moon et al., Phys. Rev. B 81, 205114 (2010).
- (16) Z. G. Chen et al., Phys. Rev. B 81, 100502(R) (2010).
- (17) E. van Heumen et al., EPL 90, 37005 (2010).
- (18) K. W. Kim et al., Phys. Rev. B 81, 214508 (2010).
- (19) G.F. Chen et al., Phys. Rev. B 78, 224512 (2008).
- (20) T. Katsufuji, M. Kasai, and Y. Tokura, Phys. Rev. Lett. 76, 126 (1996).
- (21) M. A. Tanatar et al., Phys. Rev. B 79, 134528 (2009).
- (22) The low- and mid-infrared R() and could be well reproduced by one Drude and three Lorentz components centered at 320, 1000, and 4500 cm-1 (for SDW gap and interband transitions). To reproduce the spectra upto 20000 cm-1 , one extra Lorentz term at higher energy has to be added.
- (23) G. T. Wang et al., Phys. Rev. Lett. 104, 047002 (2010).
- (24) H. Q. Yuan et al., Nature 457, 565 (2009).
- (25) C. Liu et al., Phys. Rev. Lett. 101, 177005 (2008).
- (26) W. Malaeb et al., J. Phys. Soc. Jpn. 78, 123706 (2009).