Criticality of Vacancy-Induced Metal-Insulator Transition in Graphene
Abstract
The criticality of vacancy-induced metal-insulator transition (MIT) in graphene is investigated by Kubo-Greenwood formula with tight-binding recursion method. The critical vacancy concentration for the MIT is determined to be . The scaling laws for transport properties near the critical point are examined showing several unconventional 2D localization behaviors. Our theoretical results have shed some new lights to the understanding of recent experiments in H-dosed graphene [Phys. Rev. Lett. 103, 056404 (2009)] and of 2D disordered systems in general.
pacs:
73.63.-b, 72.15.Rn, 71.55.-i, 81.05.ueGraphene, a single atomic layer of graphite, has drawn much interest in the last few years Sci04-Nov . Because of the linear dispersion relation near the Dirac point, many unconventional transport behaviors have been shown in the pristine 2D graphene quantum_hall ; Nat07-Nov ; weak_localization . On the other hand, defects and impurities are often present in graphene, so their effects on graphene transport properties are of significant scientific interests and practical implications. Vacancy, one of the natural defects present in graphene, as observed in experiment Nat04-Has , has been a subject of intense theoretical study PRL06-Per ; PRB06-Pere ; PRB08-Per ; PRB08-Huang ; PRB08-Wu ; PRB08-Pal ; PRB08-Sch . Vacancy is predicted to induce quasi-localized states in the vicinity of Fermi energy PRL06-Per ; PRB08-Per ; PRB08-Wu , leading to a metal-insulator transition (MIT). However, some fundamental properties, especially the criticality of the vacancy-induced MIT in graphene remains unclear. One important question is what is the critical vacancy concentration for MIT. Furthermore, what are the scaling laws characterizing the transport properties close to the critical point? The answers to these questions will help us not only to explain recent experiment results in graphene PRL09-Bos but also to better understand, in general, localization and transport behaviors in 2D disordered systems.
In this Letter, we report a theoretical study of criticality of the vacancy-induced MIT in graphene. Most importantly, we determine the critical vacancy concentration for MIT to be , which may be compared to the experimentally observed critical H coverage of for the H-dosing-induced MIT in graphene PRL09-Bos . We found that electrical conductivity scales with the diffusion length in a power-law, in contrast to the logarithmic scaling predicted for a conventional 2D localization behavior PR58-And ; RMP85-Lee . Above , there exists a mobility edge defining a transition point of energy from the localized states to the extended states, and the transition is discontinuous as characterized by a non-zero minimum conductivity at . is found to vary from to , different from the universal value of expected in a conventional 2D localization system RMP85-Lee . Our results are consistent with the most salient features of the H-dosing-induced MIT in graphene observed recently PRL09-Bos , suggesting that both vacancy and H belong to short-range disorder in graphene.
The graphene is described by the -band, nearest-neighbor tight-binding Hamiltonian as
| (1) |
where i and j are the neighboring sites on the lattice, is spin index. is the on-site energy set to zero, and eV is the hopping energy. To calculate the conductivity, the real-space recursion method recursion in Kubo-Greenwood formula is adopted, which has been proved to be a powerful tool in treating various disordered graphene systems PRL08-Roc1 ; PRL08-Roc2 . The DC conductivity at zero temperature can be calculated as . Here is area per atom. is average density of states (ADOS). is diffusion coefficient, which is defined as , where is the x-component of the position operator, is time evolution operator, and is diffusion time. Periodic boundary conditions are used with a supercell sizes nm and nm. Vacancies are introduced simply by removing the atoms from the lattice PRL06-Per ; PRB08-Per .
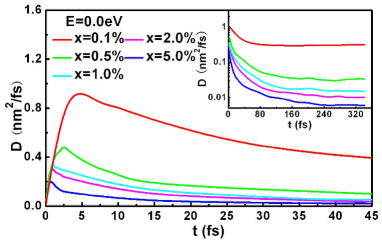
Figure 1 shows the time dependence of diffusion coefficient at Fermi energy ( eV) for different vacancy concentration () in the range of . The inset shows the behavior of at large time scale. Three main features are observed: (1) first increases linearly with time and reaches its maximum at a very short time, less than fs. is much smaller than for perfect graphene, where Fermi velocity . This means that the transport leaves the ballistic regime () quickly and enters the diffusive regime () due to vacancies. However, the diffusive regime is very short, without a plateau often seen in other systems. (2) Beyond , the system enters the localization regime, where decays in a power law , similar to the behavior of disordered carbon nanotude PRB04-Tri . This indicates that the system stays in the localization regime () when at large time scale, in agreement with the previous analytical results PRL06-Per ; PRB08-Per ; PRB08-Wu . (3) decreases with the increasing (inset of Fig. 1). This is because higher vacancy concentration leads to stronger scattering, reducing the diffusion coefficient. We note that at a given vacancy concentration, is a constant independent of time. Therefore, the conductivity will have the same power-law scaling with time, , as . Moreover, higher concentration will cause faster decay (larger ) in both diffusion coefficient and conductivity.
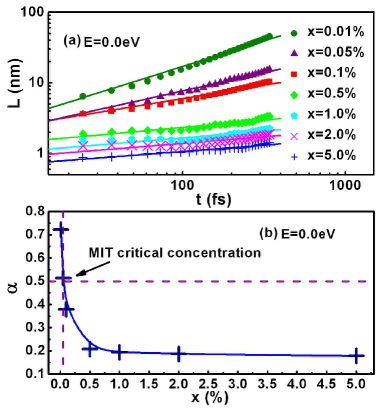
The relationship between conductivity and diffusion length is very useful to better understand the transport behavior. By definition, , then we can easily find that , which is verified for all the concentrations simulated, as shown in Fig. 2(a) with a Log-Log plot of diffusion length () versus time (). Substituting with , scales with as . By dimensional analysis, can be expressed as
| (2) |
where is the conductivity in the diffusive regime in unit of and is the electron mean free path. It is important to note that such power-law dependence of conductivity on diffusion length is different from the usual logarithmic dependence, , as predicted by 2D scaling theory of localization RMP85-Lee . We attribute this difference to the distinct nature of the quasi-localization induced by vacancies. The wave-function amplitude of the localized state induced by vacancies decays with the distance as PRL06-Per ; PRB08-Per , which is not normalizable in 2D. Therefore, such quasi-localized state PRL06-Per ; PRB08-Per is different from the usual localized state, whose wave function decays exponentially with the distance RMP85-Lee .
It has been predicted that the vacancy-induced quasi-localization will lead to MIT in graphene PRL06-Per ; PRB08-Per . However, the critical vacancy concentration where the MIT occurs remains unknown. Here, we will determine the critical vacancy concentration for the MIT. From Fig. 2(a), we derive the scaling exponent, , from the linear fitting of versus , and the resulting are plotted as a function of in Fig. 2(b). The curve of can be fit nicely by , in the whole range of concentration. Notice that when , , then because , which means defines the position of diffusive regime. () means the ballistic regime and () means the localization regime. Thus, the power-law scaling holds true for all three transport regimes. initially decreases rapidly with the increasing , indicating the system quickly leaves the ballistic regime entering the localization regime. The transition point at defines the critical vacancy concentration for MIT, which is found to be in Fig. 2(b). This value seems to agree quite well with the recent experimental result of critical concentration of MIT () in H-dosed graphene PRL09-Bos . It implies that similar transport behavior exists in these two disordered systems that both vacancy defect and H impurity create similar localization phenomena in graphene. In addition, the experiment suggested other unknown defects rather than H may induce MIT at even lower defect concentrations PRL09-Bos , which might be attributed, at least partly, to vacancies according to our calculation.
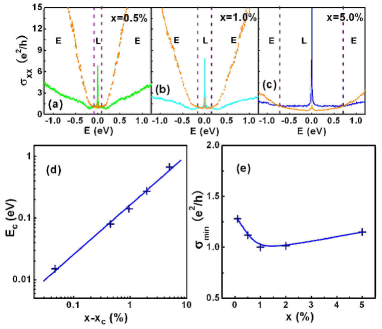
Next, we examine another criticality of the vacancy-induced MIT in graphene, the mobility edge (), which defines the critical energy where the system changes from the localized state to the extended state above the critical vacancy concentration . We only need to consider , because when the electronic states become extended over the whole energy range. Figures 3(a), (b) and (c) show the energy dependence of conductivity at two different times for three vacancy concentrations of , , and , respectively. One time is chosen at where reaches its maximum, ), and the other is chosen at a much later time ( fs ). At the low energies closed to , , but at the high energies away from , . This is because the low-energy electronic states are localized whose conductivity decreases with time; while the high-energy electronic states are extended whose conductivity increases with time. This is in qualitative agreement with the previous analysis of the inverse participation ratio (IPR) of electron wavefunction PRL06-Per ; PRB08-Per . Then, the mobility edge can be obtained as the energy for . In Figs. 3(a), (b) and (c), we see that the mobility edge increases with the increasing vacancy concentration, as the increasing vacancy concentration expands the energy range of localization when .
In Fig. 3(d), we plot as a function of , in a Log-Log scale, which clearly shows a power-law dependence of on . Fitting the simulation data, we obtain the scaling relation of , with the scaling exponent . Importantly, a non-zero minimum conductivity appears at the mobility edge. Figure 3(e) shows that first decreases and then increases with , but the reason for such trend is unclear. The existence of is possibly due to the quasi-localized nature of electronic states induced by vacancy in graphene. It indicates that the transition from the localized states to the extended states at the mobility edge is discontinuous as Mott argued RMP85-Lee , suggesting the break-down of one-parameter scaling theory. Also, our simulated varies from to , different from the universal value of as expected in conventional 2D localization system RMP85-Lee .
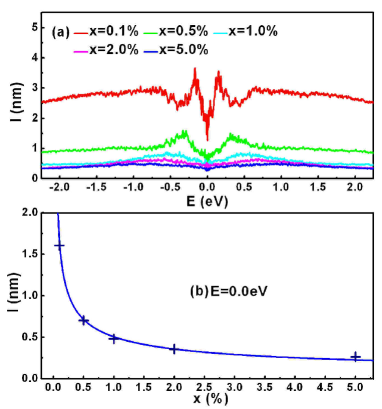
Last, we examine the electron mean free path , an important length scale characterizing the degree of electron scattering by disorder. In Fig. 4(a), the energy dependence of is shown, which is obtained by PRB04-Tri ; PRL97-Roc . is the average wave-packet velocity at energy , extracted from the diffusion coefficient in the ballistic regime at short times as . It is interesting to observe a minimal mean free path at . This distinguishes vacancies from other disorders in graphene that give rise to a maximal mean free path at PRL08-Roc1 ; PRL08-Roc2 . The minimal mean free path means that the lifetime of electrons is the shortest near in the localization regime, violating graphene’s ordinary Fermi liquid behavior Nat07-Bos . Such an unusual behavior has also been experimentally observed in graphene dosed with a high concentration of H atoms PRL09-Bos .
Near , the mean free path is much less than the average distance between vacancies (). This is because the quasi-localized states substantially reduce in the low-energy region. For example, when , is found to be nm, while is in the order of nm. In Fig. 4(b), we plot as a function of , which shows that scales with in a power law () at . Fitting the simulation data, we obtained the parameter nm. This power-law scaling has been derived before from the full self-consistent Born approximation (FSBA) PRB06-Pere , but the FSBA is limited to extremely low concentration and can not describe the localization behavior near and give the quantitative values of .
Our quantitative results indicate that vacancies are short-range disorders similar to H atoms in graphene as suggested by a recent experiment PRL09-Bos . The similar results between vacancy defect and H impurity can be understood by the dramatic reconstruction of the energy spectrum near the Dirac point in both cases, while the Fermi energy is preserved. As short-range local scatters, both vacancy and H lead to strong localization by significant scattering. We note that at low defect/impurity concentration, the mean free path is shorter for vacancy ( nm at ) than for H atom ( nm at ). This is because vacancy produces a much stronger local scattering center (creating an infinite barrier) than H (inducing a structural transition from to hybridization). However, we find that the rate of decreases faster with for H () PRL09-Bos than that for vacancy (). This is possibly because the scattering center produced by vacancy is more localized limited to single atomic site, while the scattering center produced by H atom is relatively more extended as the hybridization induces reconstruction in the neighboring atoms around it. Consequently, at high concentration, multiple scattering by H atoms becomes more and more important, leading to a faster decay of . A different case was shown in graphene substituted with boron or nitrogen, where the long-range scattering is induced by chemical disorder with PRL08-Roc2 .
In conclusion, the criticality of vacancy-induced MIT in graphene has been investigated with quantitative simulations. The MIT is shown to occur at the critical vacancy concentration , caused by the vacancy-induced quasi-localization. Several unconventional critical behaviors have been revealed in the defected graphene with vacancies, including the power-law rather than logarithmic scaling relation between conductivity and diffusion length and the existence of a minimum conductivity at the mobility edge that differs from the universal value of expected in conventional 2D localization systems. Our results for vacancies are consistent with the most salient features of the H-dosing-induced MIT in graphene as observed in recent experiments PRL09-Bos , suggesting that both vacancy and H belong to the same class of short-range disorders in graphene with H dosing involving stronger multiple scattering. Our studies also shed some new lights to the general understanding of critical behaviors of 2D disordered systems.
References
- (1) K. S. Novoselov et al., Science 306, 666 (2004).
- (2) A. K. Geim and K. S. Novoselov, Nat. Mater. 6, 183 (2007); B. Oezyilmaz et al., Appl. Phys. Lett. 91, 192107 (2007); B. Oezyilmaz et al., Phys. Rev. Lett. 99, 166804 (2007); Z. Jiang, Y. Zhang, H. L. Stormer, and Ph. Kim, Phys. Rev. Lett. 99, 106802 (2007); Y. Zhang et al., Phys. Rev. Lett. 96, 136806 (2006); K. S. Novoselov et al., Nature (London) 438, 197 (2005).;Y. Zhang et al., Nature (London) 438, 201 (2005).
- (3) K. S. Novoselov et al., Science 315, 1379 (2007).
- (4) E. McCann et al., Phys. Rev. Lett. 97, 146805 (2006); H. Suzuura and T. Ando, J. Phys. Soc. Jpn. 75, 024703 (2006); V. I. Falko et al., Solid State Commun. 143, 33 (2007); F.W. Tikhonenko et al., Phys. Rev. Lett. 100, 056802 (2008).
- (5) A. Hashimoto at el., Nature 430, 870 (2004).
- (6) V. M. Pereira at el., Phys. Rev. Lett. 96, 036801 (2006).
- (7) N. M. R. Peres at el., Phys. Rev. B 73, 125411 (2006).
- (8) V. M. Pereira at el., Phys. Rev. B 77, 115109 (2008).
- (9) B. Huang, at el., Phys. Rev. B 77, 153411 (2008).
- (10) S. Wu at el., Phys. Rev. B 77, 195411 (2008).
- (11) J. J. Palacios at el., Phys. Rev. B 77, 195428 (2008).
- (12) A. L. C. Pereira at el., Phys. Rev. B 78, 125402 (2008)
- (13) A. Bostwick at el., Phys. Rev. Lett. 103, 056404 (2009)
- (14) P. A. Lee and T.V. Ramakrishnan, Rev. Mod. Phys. 57, 287 (1985).
- (15) P. W. Anderson, Phys. Rev. 109, 1492 (1958).
- (16) S. Roche, Phys. Rev. B 59, 2284 (1999); F. Triozon at el., Phys. Rev. B 65, 220202(R) (2002); T. Markussen, "Quantum transport calculations using wave function diffusion and the Kubo formula", Master Thesis in Technical University of Denmark (2006); J.-C. Charlier, X. Blase, and S. Roche, Rev. Mod. Phys. 79, 287 (2007).
- (17) A. Lherbier at el., Phys. Rev. Lett. 100, 036803 (2008).
- (18) A. Lherbier at el., Phys. Rev. Lett. 101, 036808 (2008).
- (19) F. Triozon at el., Phys. Rev. B 69, 121410(R) (2004).
- (20) S. Roche and D. Mayou, Phys. Rev. Lett. 79, 2518 (1997).
- (21) A. Bostwick at el., Nature Phys. 3, 36 (2007).