Optical properties of CeO2 using screened hybrid functional and GW+U methods
Abstract
The optical spectra of CeO2 have been systematically investigated using three first-principles computational approaches for comparison, namely, the Heyd-Scuseria-Ernzerhof (HSE) screened hybrid functional, HSE+U, and GW+U. Our results show that by using the HSE+U method, the calculated electronic structures are in good agreement with experimental spectra and the resulting imaginary part of the optical dielectric function spectrum well reproduces the main features exhibited in experimental observations. The important adsorption spectrum and energy loss function also accord well with the experimental results.
Cerium oxides have been applied extensively because of the technologically important applications in industry originating from their unique physical properties. Taking CeO2 for example, it is used in automobile exhaust catalysts due to its capacity of high oxygen storage. Another novel application of CeO2 in the microelectronic and optoelectronic fields has been attracted more attention because of its high dielectric constant and good epitaxy on Si substrates resulted from the same cubic structure and small lattice mismatch r1 . Particularly, the dielectric function related optical properties of CeO2 have been investigated intensively by several experimental work r2 ; r3 ; r4 , and the complex 4f orbitals of Ce are also proved to be unoccupied locating within the band gap formed between the O and Ce states.
From theoretical viewpoint, accurate calculations of optical properties for 4f rare-earth oxide systems are hard. For example, firstly, conventional density functional theory (DFT) within standard local or semilocal functionals always underestimates the band gaps of insulators or semiconductors, consequently, the resulting optical spectra are unsatisfactory. Secondly, an accurate description of electronic structures for rare-earth oxides containing 4f electrons is also a great challenge to DFT due to the simultaneous itinerant and localized behaviors exhibited by the f orbitals. Many efforts have been devoted to overcoming these intractable issues.
One successful method to remedy the drawback of the standard local or semilocal functionals is the newly developed hybrid functionals r5 which introduces 25% of the nonlocal Hartree-Fock (HF) exchange into the otherwise exact semilocal exchange functional. In order to apply this method to large molecules or extended systems, an improved version of the HSE screened Coulomb hybrid functional r6 has been developed, in which the slowly decaying long-ranged (LR) part of the HF exchange term is replaced by the corresponding density functional counterpart. Taking Perdew-Burke-Ernzerhof (PBE) potentials for example, the resulting exchange is given by
| (1) |
where E is the short-ranged (SR) HF exchange, E and E are the SR and LR components of the PBE exchange functional, respectively.
Another successful method for determination of excited states is the GW approximation r7 , which is based on the quasiparticle concept and the Green function method. In this approximation, the self-energy is expanded linearly in terms of the screened interaction W, i.e., . Here, G is the single-particle Green’s function and W is the screened Coulomb interaction. In order to describe the localized f orbitals more accurately, we also adopt the PBE plus a Hubbard U correction (PBE+U) method r8 as the starting point, which gives a qualitative improvement compared to PBE not only for excited states such as band gap but also for ground-state properties such as Mott insulator.
In this letter, we systematically investigate the optical spectra of CeO2 using the HSE, HSE+U and GW+U methods as implemented in the first-principles vienna ab initio simulation package (VASP) r9 . The electron and core interactions are included using the frozen-core projected augmented wave (PAW) approach r10 . The gradient corrected PBE functional r11 for the exchange correlation potential is used. The cerium 5s, 6s, 5p, 5d and 4f as well as the oxygen 2s and 2p electrons are explicitly treated as valence electrons. The electron wave function is expanded in plane waves up to a cutoff energy of 500 eV. For the Brillouin zone integration, the 6 6 6 -centered k-mesh is adopted and a good convergence can be obtained. In the HSE calculations, 25% HF exchange and 75 % PBE exchange are used, and the range-separation parameter is set to =0.3 Å-1. The GW calculations are carried out using a total number of 166 bands and four iterations for accurate quasiparticle shifts. The strong on-site Coulomb repulsion among the localized Ce 4f electrons is described by the rotationally invariant approach to the LDA U method due to Dudarev et al. r12 . In our calculation, we use J = 0.51 eV for the exchange energy and U = 4.5 eV for the spherically averaged screened Coulomb energy U, which is close to the values used in other previous work r13 . Since only the difference between the spherically averaged screened Coulomb energy U and the exchange energy J is important for the total LDA (GGA) energy functional r12 , thus, in the following we label them as one single effective parameter U for brevity. Notice that all our calculations are performed at the experimental lattice constants.
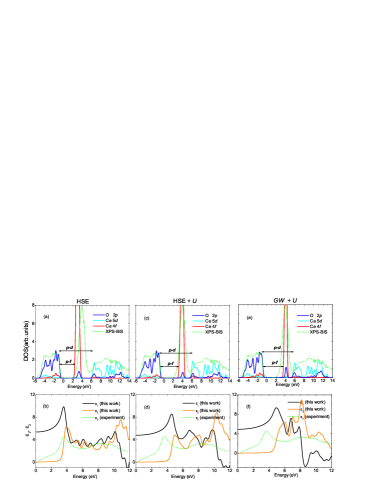
Before calculating the optical spectra of CeO2, we first study the essential electronic structure using the HSE, HSE+U and GW+U methods, respectively, since the spectra are calculated directly from the interband transitions. Based on this, the frequency-dependent complex dielectric function for CeO2 are calculated. In the following, we will show and discuss our results systematically. The calculated results obtained using standard DFT are not present in this letter, because they can be available elsewhere r13 ; r14 ; r15 . Figure 1(a) shows the site-projected orbital-resolved density of states (DOS) for Ce 4f, 5d and O 2p orbitals using HSE method together with the experimental XPS BIS spectra r16 . From the DOS, it is clear that the valence bands mainly consisted of O 2p states and a little contribution from Ce 4f and 5d states can also be seen. The conduction bands mainly consisted of Ce 5d states, and the localized Ce 4f states are located within the pd gap. Our calculated width of O 2p valence bands is about 4 eV, which is in good agreement with the experimental XPS results r16 . Note that the fundamental pf and pd gaps govern the optical transitions, therefore, their accurate determination is indispensable to the optical spectra. Our calculated pf gap is about 2.8 eV, which is well consistent with the experimental value of 3.0 eV r16 . Furthermore, the pd gap of about 6.2 eV is also well determined compared with the experimental value of about 6.0 eV r16 . Another remarkable property is the central position of localized Ce 4f orbitals. Our DOS showed in Fig. 1(a) shows that the localized Ce 4f orbitals lie about 3.5 eV above the topmost of the O 2p valence bands, which is smaller than the XPS-BIS result of about 4.5 eV r16 . Notice the that present electronic structure obtained by HSE are in good agreement with previous study r15 using HSE.
Based on the determined electronic structure, the optical spectra of the frequency-dependent dynamical dielectric function as a function of the photon energy up to 12 eV has been calculated and showed in Fig. 1(b). In order to make a comparison, the experimental result r2 of imaginary part is also showed. Due to the cubic symmetry of CeO2, the dielectric tensor only has one independent component and = = , therefore, only one component is showed in Fig. 1(b). According to our above DOS discussion, the peak at about 3.9 eV in our calculated is assigned to the transition from the O 2p bands to the localized Ce 4f states, which is close to the peak in experimental at 3.7 eV r2 . Considering the dipolar selection rule only transitions with the difference = 1 between the angular momentum quantum numbers l are allowed, the pf transition is forbidden. However, in our above DOS calculation, in valence bands, small hybridization between O 2p and Ce 4f exists, which suggests that some Ce 4f electrons transfer to O 2p states. Notice that Niwano et al. r3 also called the pf transition as a “charge transfer” transition. As for the O 2pCe 5d transition, experimentally Marabelli et al. r2 observed a double-peaked very broad structure at about 9 eV in ; one peak is centered at 8 eV and the other at 10 eV. This corresponds to the transitions from O 2p to Ce 6d eg and t2 states due to crystal field splitting in fluorite crystal structure. As for the pd transition indicated in in Fig. 1(b), one can see two peaks located at about 8.6 and 10.8 eV, corresponding to pd and pd transitions, respectively.
The electronic structure and optical spectra obtained by the HSE U method are showed in Fig. 1(c) and Fig. 1(d). Compared to our pure screened hybrid functional result, it is clear that the Ce 4f states are more localized because of the Hubbard U correction. Furthermore, the central position of localized Ce 4f states lies at about 4.5 eV above the topmost of the O 2p valence bands, which becomes to accord well with the experimental XPS-BIS measurement r16 . As for the pf and pd gaps, they are now very close to the experimental data r16 . Overall, the shape of our calculated DOS curve exhibits the same main features as the experimental XPS-BIS results r16 . Correspondingly, the calculated by the HSE U is showed in Fig. 1(d). Clearly, there are three peaks in the calculated . One peak is at 4.9 eV, and the other two are at 8.1 and 10.3 eV, respectively. Comparing to the three main peaks (located at 3.7, 8 and 10 eV) observed by experiment r2 , we notice that the last two peaks are well reproduced except the first peak with a shifting of about 1.2 eV from the experimental spectrum. This discrepancy is guessed to be due to the ignorance of the interaction between electron and hole in our calculations. Then, the excitonic effect is not taken into account. As Niwano et al. r3 pointed out that the BIS process is adding one additional electron into the empty conduction bands, whereas optical adsorption process is exciting one electron up to the conduction bands and a corresponding hole is created; they further deduced the binding energy of an exciton contributed by one hole and one 4f electrons to be about 1 eV according to energy difference between the central position of the localized 4f states and the first peak in . Notice that compared to the experimental observation r2 , our spectrum also exhibits a rising edge at about 6.5 eV, which is close to the pd gap and indicates the beginning of the pd transitions. Therefore, our calculated spectrum displays the main features as the experimental result and supplies a qualitative agreement with experimental spectra r2 ; r3 . Furthermore, if the excitonic effect is taken into account, the oscillator strength in will shift to lower energies, we expect that the agreement will become better.
The calculated projected DOS and dielectric function spectra obtained by the GW+U method are also showed in Fig. 1(e) and Fig. 1(f). It is clear that the Ce 4f orbitals are further localized compared to the HSE+U results. As for the gaps, the pd gap is close to experimental result, whereas the pf gap of about 3.9 eV is enlarged. Notice that the band gaps for semiconductors or insulators are usually overestimated in GW scheme. This is because the screening is reduced upon updating the eigenvalues in W r17 . As expected, the first peak in spectrum will shift to a higher energy and our calculated spectrum shows that it is located at 6.0 eV, while other two peaks at 8.1 and 10.3 eV, respectively.
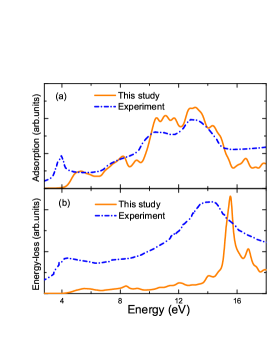
Comparing the three results showed in Fig. 1, one can conclude that the results obtained by the HSE+U method are better than the other two. Furthermore, for spectrum, we expect the agreement will be become better if the excitonic effect is taken into account. Based on this, the important adsorption spectrum and energy-loss function deduced from the frequency-dependent dynamical dielectric function obtained by HSE+U, together with the corresponding experimental data r3 , are showed in Fig. 2. It is obvious that the main structures are well reproduced. Similar to the spectrum, the first peak in adsorption spectrum has a shifting of about 1.2 eV to higher energy. As for the energy-loss function, the two peaks at about 5.5 and 15.5 eV also shift to high energies by about 1.1 eV compared to the experimental results r3 .
In summary, we have studied the optical properties of CeO2 using HSE, HSE+U, and GW+U three methods. Using HSE+U method, our calculated band gaps and the central position of 4f orbitals are in good agreement with the experimental values, and the resulting optical dielectric function, adsorption spectrum and energy-loss function obtained by HSE+U are also well reproduced.
This work was supported by the National Basic Research Program of China (973 Program) grant No. G2009CB929300 and the National Natural Science Foundation of China under Grant Nos. 60521001, 60776061 and 90921003, and by the Foundations for Development of Science and Technology of China Academy of Engineering Physics under Grant No. 2009B0301037.
References
- (1) T. Inoue, Y. Yamamoto, S. Koyama, S. Suzuki, and Y. Ueda, Appl. Phys. Lett. 56, 1332 (1990).
- (2) F. Marabelli and P. Wachter, Phys. Rev. B 36, 1238 (1987).
- (3) M. Niwano, S. Sato, T. Koide, T. Shidara, A. Fujimori, H. Fukutani, S. Shin, and M. Ishigame, J. Phys. Soc. Jpn. 57, 1489 (1988).
- (4) M. Veszelei, L. Kullman, C. G. Granqvist, N. Rottkay, and M. Rubin, Appl. Opt. 37, 5993 (1998).
- (5) A. D. Becke, J. Chem. Phys. 98, 5648 (1993).
- (6) J. Heyd, G. Scuseria, and M. Ernzerhof, J. Chem. Phys. 118, 8207 (2003).
- (7) L. Hedin, Phys. Rev. 139, A796 (1965).
- (8) A. Lichtenstein, J. Zaanen, and V. Anisimov, Phys. Rev. B 52, R5467 (1995).
- (9) G. Kresse and J. Hafner, Phys. Rev. B 48, 13115 (1993).
- (10) P. Blchl, Phys. Rev. B 50, 17953 (1994).
- (11) J. P. Perdew, K. Burke, and M. Ernzerhof, Phys. Rev. Lett. 77, 3865 (1996).
- (12) S. L. Dudarev, G. A. Botton, S. Y. Savrasov, C. J. Humphreys, and A. P. Sutton, Phys. Rev. B 57, 1505 (1998).
- (13) Juarez L. F. Da Silva, M. Ver nica Ganduglia-Pirovano, J. Sauer, V. Bayer, and G. Kresse, Phys. Rev. B 75, 045121 (2007).
- (14) N. Skorodumova, R. Ahuja, S. Simak, I. Abrikosov, B. Johansson, and B. Lundqvist, Phys. Rev. B 64, 115108 (2001).
- (15) P. Hay, R. Martin, J. Uddin, and G. Scuseria, J. Chem. Phys. 125, 034712 (2006).
- (16) E. Wuilloud, B. Delley, W.-D. Schneider, and Y. Baer, Phys. Rev. Lett. 53, 202 (1984).
- (17) F. Fuchs, J. Furthm ller, F. Bechstedt, M. Shishkin, and G. Kresse, Phys. Rev. B 76, 115109 (2007).