Modelling conflicts with cluster dynamics on networks
Abstract
We introduce cluster dynamical models of conflicts in which only the largest cluster can be involved in an action. This mimics the situations in which an attack is planned by a central body, and the largest attack force is used. We study the model in its annealed random graph version, on a fixed network, and on a network evolving through the actions. The sizes of actions are distributed with a power-law tail, however, the exponent is non-universal and depends on the frequency of actions and sparseness of the available connections between units. Allowing the network reconstruction over time in a self-organized manner, e.g., by adding the links based on previous liaisons between units, we find that the power-law exponent depends on the evolution time of the network. Its lower limit is given by the universal value 5/2, derived analytically for the case of random fragmentation processes. In the temporal patterns behind the size of actions we find long-range correlations in the time series of number of clusters and non-trivial distribution of time that a unit waits between two actions. In the case of an evolving network the distribution develops a power-law tail, indicating that through the repeated actions, the system develops internal structure which is not just more effective in terms of the size of events, but also has a full hierarchy of units.
pacs:
89.75.-k; 05.65.+b; 89.20.-aI Introduction
The study of coagulation-fragmentation models in physics have a long history, and have been used to explain a variety of physical phenomena, including the formation of aerosols, colloidal aggregates, polymers and celestial bodies wattis . More recently the basic theory, originally developed by Smoluchowski smol and Becker-Doring becker has been adapted to model group behaviour in human-dynamics. The first microscopic model of herding in financial markets consisted of randomly connected agents bouchaud . In this model agents are connected with probability and disconnected with probability . Agents that are in the same group share information and make the same decisions in the market. The parameter was tuned to the percolation threshold to obtain a power-law distribution of group sizes and hence a power-law distribution of returns.
Inspired by this, in 2000 Eguiluz and Zimmermann EZ (EZ) introduced a coagulation-fragmentation model of herding in financial markets. The EZ model is a kinetic version of the model in bouchaud , in which the group sizes emerge more naturally in the limit of large time. At each time step with probability an edge is introduced between two randomly selected agents or with probability the group of a randomly selected agent is fragmented. In geoff1 Dhulst and Rodgers solved this model exactly and showed that in the limit the system evolves to a stationary cluster size distribution with the number of clusters of size , , is given by
| (1) |
where N is the number of agents in the system. In the limit this result can be expanded for large to give a power-law with and .
This basic model has been used johnson to explain the apparent ubiquity of the exponent in the data from modern insurgent warfare. Many authors have studied wars and conflicts empirically, and many have concluded that the distribution of daily casualties, or of casualties per attack, has a power-law distribution richardson48 ; richardson60 . A wide range of exponents have been reported. In newman an exponent of is reported for the intensity of 119 old wars between 1816 and 1980. Casualty numbers in global terrorist attacks, since 1968, have for G7 countries and for non-G7 countries clauset . More recently, in johnson the daily data from killings and injuries in Columbia and civilian casualties in Iraq were examined. The total data sets gave good power-law distributions with for Columbia and for Iraq. By reducing the time window within these data sets, and then sliding the time window forward, the authors of johnson were able to calculate a series for as a function of time. This revealed that as time window is shifted towards recent time the exponent in both the Columbian and Iraqi datasets was tending to the value . This caused the authors of johnson to develop a new model of modern insurgent warfare based on a dynamical model of herding introduced in EZ ; geoff1 .
In financial markets, the return is equal to the difference in the number of buyers and sellers at a particular time, or alternatively to the supply and demand balance at a particular time rose . Hence in the models of financial markets the probability of having a return of size is proportional to . In models of wars and conflicts the units can be thought of as troops, weapons or equipment and it is an assumption in these models johnson that the number of casualties inflicted by a force of strength is proportional to . In these models the parameter is an external fixed parameter, however, in the real dynamics this probability might emerge from another stochastic process, inherently related to the main dynamics. One would expect that the stochastic processes would be quite different in the market and conflict dynamical systems.
The empirical studies of war and terrorist actions demonstrate johnson ; richardson48 ; richardson60 ; newman that the power-law behaviour is non-universal, with the exponent depending on the type of conflict (insurgence, guerrilla, terrorist, etc…) and on the geographical location and period of time considered. In contrast the original model with the coagulation-fragmentation of random clusters always leads to a universal exponent . Thus the EZ model is not able to capture the underlying mechanisms which lead to the variety of observed power-laws. Moreover, the full fragmentation of clusters, which is suitable for herding in market dynamics, might not be appropriate for the conflicts.
In this paper we study new models of conflicts with the cluster dynamics on networks when only the largest cluster can be involved in an action. This mimics the situations in which an attack is planned by a central body, and the largest attack force is used, and where the units interact within a social or technological network. Following the action, the network is either reset back to the original structure (fixed network model), or evolves by adding new links between units involved in the action (emergent network model). The evolving network model provides a mechanism for understanding the power-law exponent dependence on the evolution time, similar to the empirical data. Furthermore, in our simulations we analyse the temporal behavior of each unit, which is behind the emergent power-laws. This allows us to unravel the changing nature of the group actions and monitor emergent structure of their connections. For comparison, we also study the cluster dynamics with maximal cluster fragmentation on an annealed random graph structure, which is closer to the original model and the situation in real market dynamics.
In Section II we introduce the microscopic rules of the model and present the simulations on the annealed random graph, the situation which parallels the original coagulation-fragmentation model of market crashes. We also define and compute the temporal quantities that can be monitored in real data. In section III we present simulation results corresponding to the cluster dynamics on a network with fixed and evolving network topology. Finally, in section IV we give a brief summary of the results and a discussion, in particular on the mechanisms revealed within our model, which might drive the evolution of modern conflicts.
II Cluster-aggregation and largest cluster fragmentation with an annealed random graph topology
In this section we consider a minimal extension of the original aggregation–fragmentation model EZ ; geoff1 , in which instead of choosing a random group to fragment we always choose the largest group. At each time step with probability a pair of units is selected and joined together, whereas with probability the largest cluster is found and fragmented. As in the original model of market dynamics EZ ; geoff1 , in the system of units any randomly selected pair can join each other in the aggregation event, whereas all the links between pairs within the cluster are removed when the cluster is destroyed. In terms of topology (see later) this situation is represented by a random graph with an annealed link structure. The effects of a fixed and evolving network underlying the aggregation processes will be studied in section III.
II.1 Cluster size statistics and temporal structure
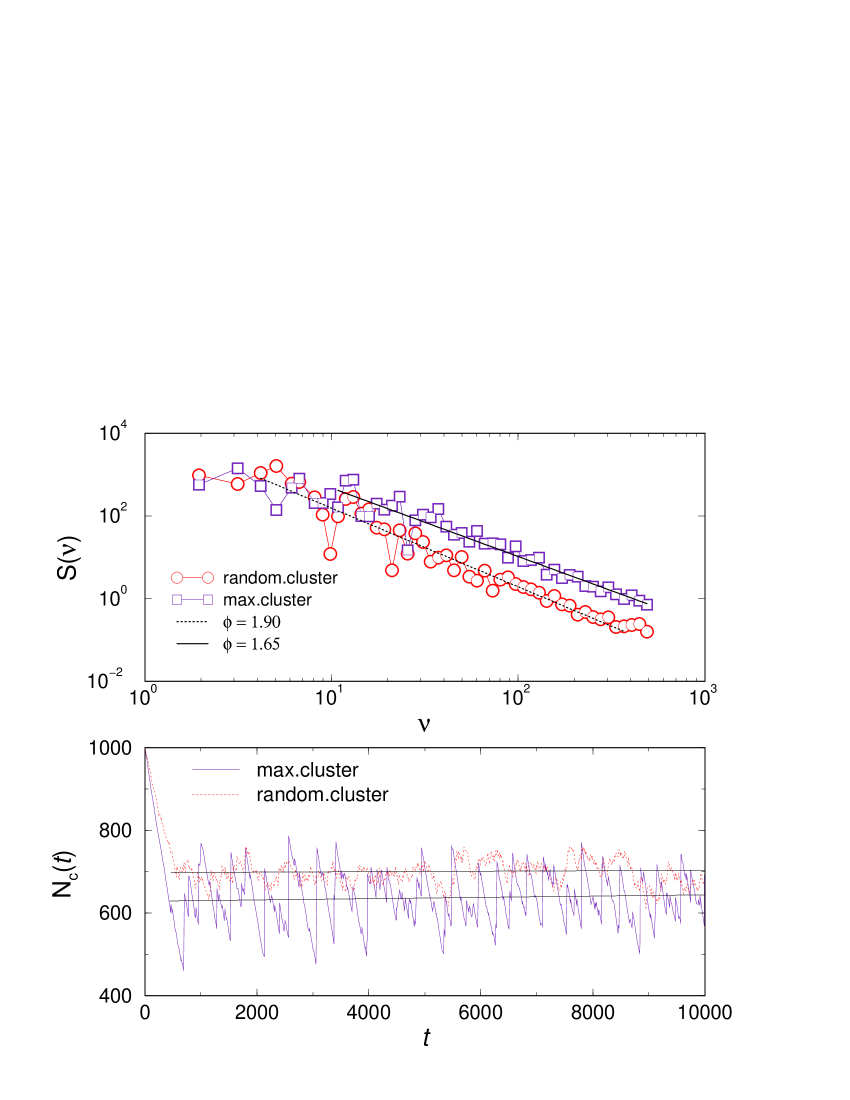
Starting with units, we apply the rules of random aggregation and fragmentation events, as described above. If we always select the largest cluster for fragmentation, instead of a randomly selected cluster, it affects the system dynamics in a different ways, depending on potential size that the cluster can grow, which, on the other hand is determined by the fragmentation probability . For a sizable probability of fragmentation, the system has no large clusters, which causes the probability distribution of cluster sizes to decay rapidly. The distribution of all sizes of clusters and the size of the fragmented cluster is shown in Fig. 1d for several values of the probability = 10%, 5%, and 2%. It exhibits a power-law tail for sizes above a threshold value with the scaling exponent defined by the expression
| (2) |
In each case, the size of the largest (fragmented) cluster starts playing a dominant role over a threshold (maximum of the fragmented size distribution), which moves upward with reduced fragmentation probability. The slope of the cluster-size distribution over the threshold is fully determined by the distribution of the fragmented cluster size and it is continuously varying with the probability . With the reduced fragmentation probability (increasing aggregation probability ) the slope of the size distribution reduces and converges towards the universal curve obtained in the random cluster fragmentation (top line in Fig. 1d). Intuitively, this is understandable since, for vanishingly small but finite probability of crush, a very large clusters may occur in the system increasing the probability to be selected by random picking unit. However, the nature of correlations that the system develops over time reveals that these are different processes. The time fluctuations in the number of clusters and their
| (a) | (b) |
|
|
| (c) | (d) |
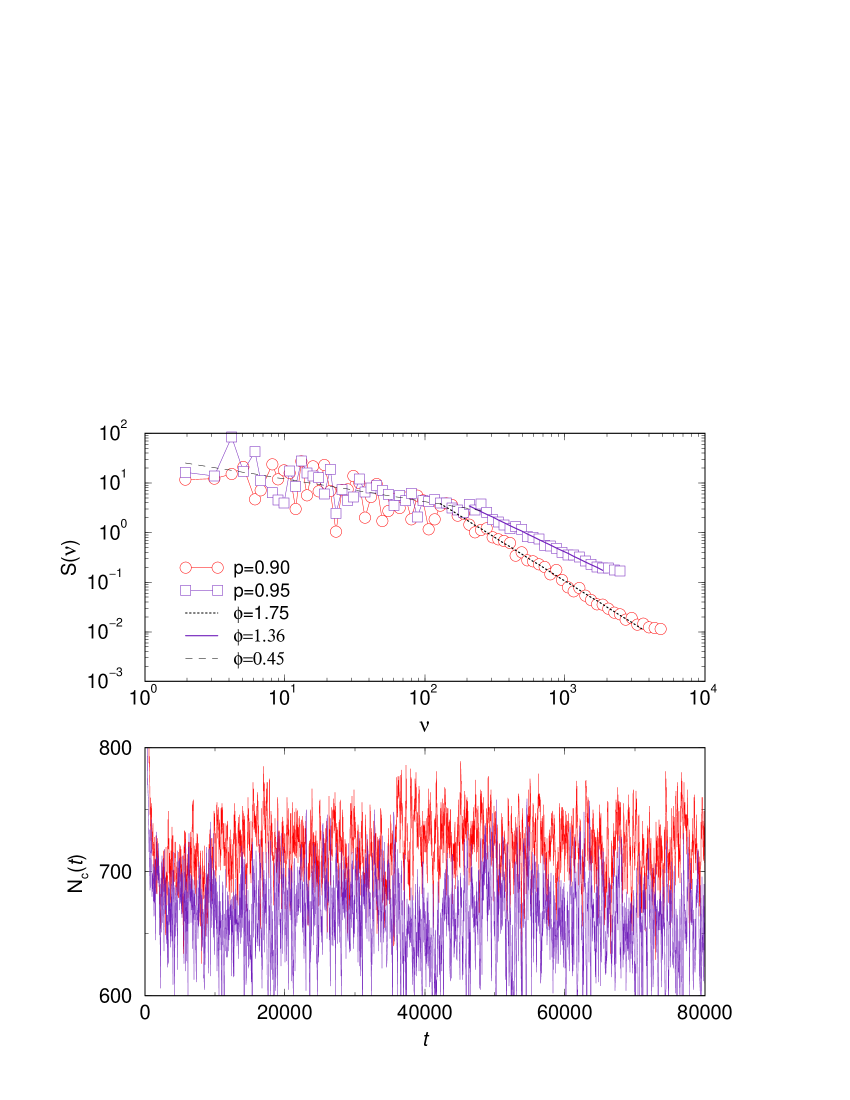
power-spectra are shown in Fig. 1a,c for fixed aggregation probability. Apart from the visual difference, in particular in the sizes of destruction events and the average number of clusters present (697 in random, 628 in maximal cluster destruction events), the power spectrum of these time series shows long-range correlations with different exponents. Specifically, the power spectrum decays at high frequencies as
| (3) |
with the scaling exponent depending on the fragmentation mechanism: We find the exponent close to for the maximal cluster fragmentation, compared to the short-range correlations in the case of the random cluster fragmentations and same aggregation probability .
Further insight into the mechanisms of the cluster dynamics can be gained from the temporal statistics, in particular, the distribution of the time intervals between events. This distribution can be looked at the level of the whole system, as well as the level of each unit. The results of the simulations are shown in Fig. 1b. The distribution between the fragmentation events is exponential, reflecting the fact that in the model the fragmentation occurs randomly with the external parameter . However, from the point of view of the individual units, the distribution of the time intervals between two successive fragmentation events in which a unit has been involved is rather non-trivial. The distribution seems to be primarily determined by the topology (a random annealed graph in this case) where the linking between the units occur, rather than with the probability of fragmentation (see also discussion in the next section).
III Cluster dynamics on networks with fixed and emergent topology
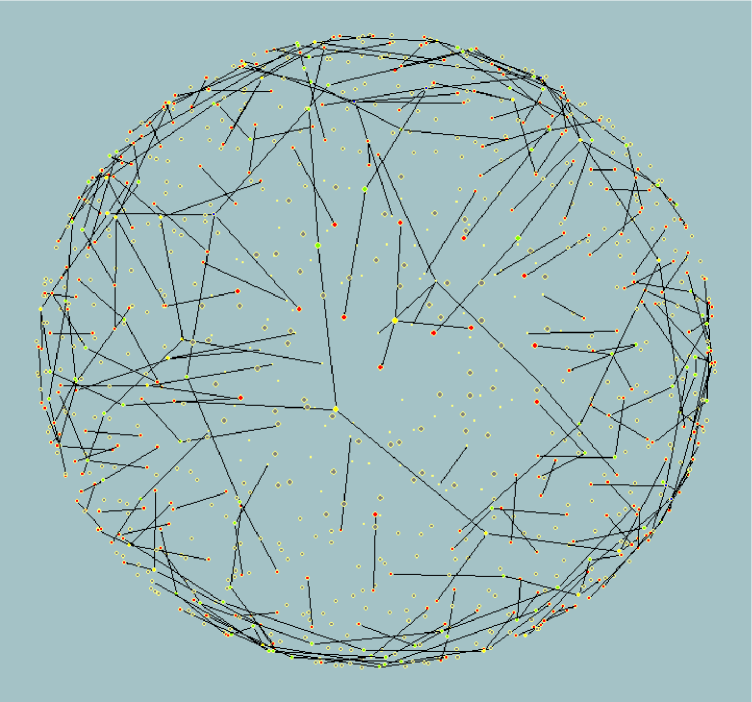
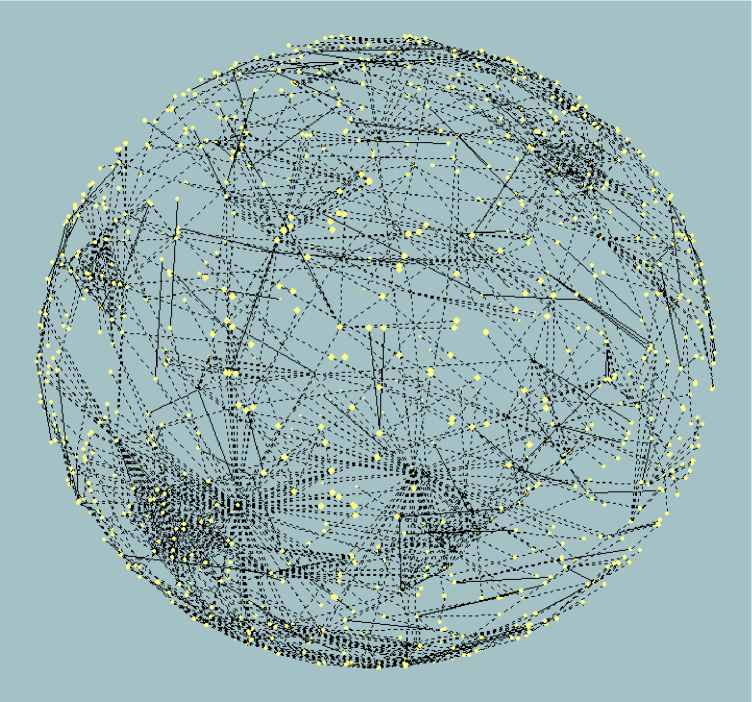
In this section we test the effect of placing the aggregation process on a network. In particular, the units are associated with network nodes, while the network structure permits the aggregation only along the links between the units. Thus, in contrast to the annealed random graph topology discussed above, on the network a cluster can grow by aggregating with locally available units. Apart from the network structure constraints in the aggregation process, the action event occurs with the probability always involving the largest cluster as above. After each action event, the units who were involved in the action can build new connections, specifically, they form a clique of the size of the cluster, which then plays a role in future aggregation. Thus, the dynamical reconstruction of the network structure is tightly linked to the action events. We consider the temporal and statistical features of the process and the structure of the emergent network. Here we present the simulation results starting from a tree network which contains several subtrees with local hubs (the algorithms to grow such networks are described in MMBT09 ). An example of the network structure emerging through the cluster is shown in Fig. 2 along with the network representing the situation of the annealed random graph topology, studied above in sec. II.
|
|
As shown below, these rules with the aggregation on network and action events with the reconstructed links appear to be a suitable basis for describing the evolution-dependent power-law exponent (which was observed for example in the analysis of the empirical data of war events in Columbia johnson ). For comparison, we also consider the case when the network structure remains fixed throughout the entire process. In tis case after the action involving the largest cluster, the links between involved units are always reset to the original network structure.
|
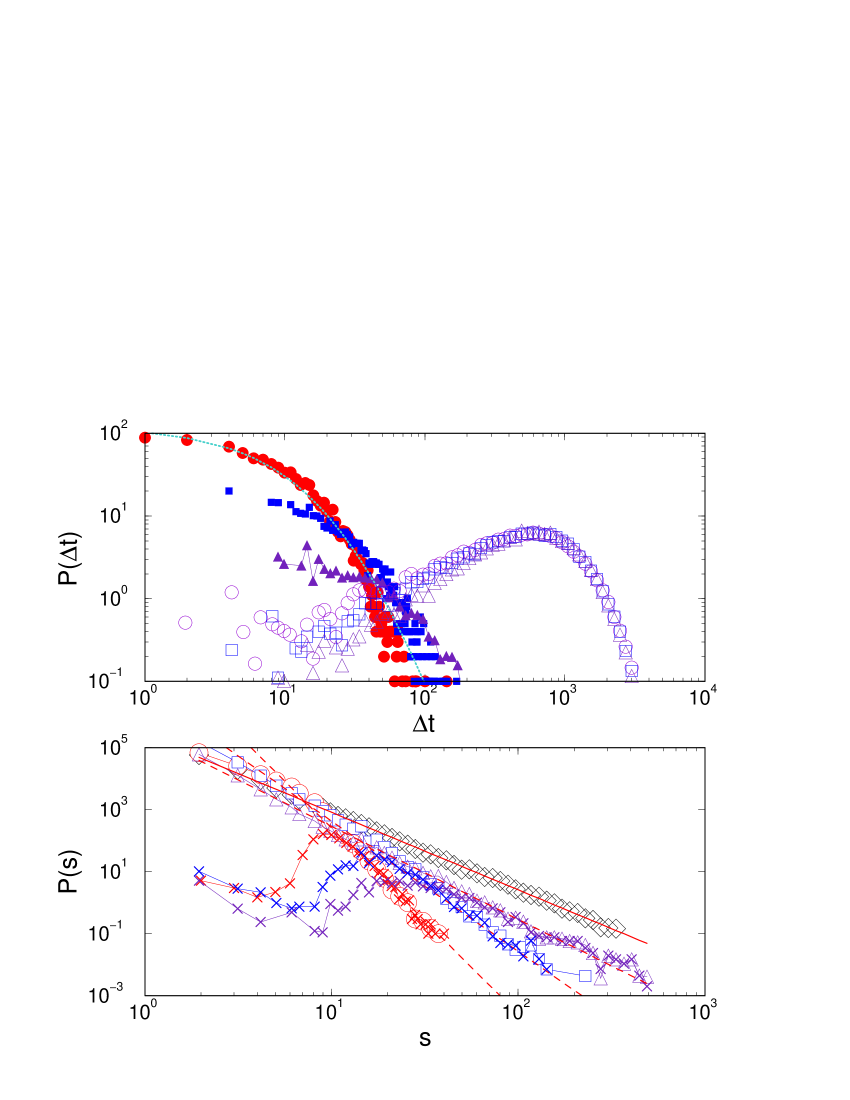
The network reconstruction with building new connections between units involved in the action is affecting the dynamics through increased temporal correlations. In Fig. 3 the example of two time series of number of clusters are shown together with their power spectra, corresponding to two values of the parameter . We find the power-spectrum correlations at hight frequencies with the exponent for , while for . Further increase of the correlations towards the noise behavior is expected in the asymptotic limit of small action probability. In both cases only weak correlations occur at small frequencies (long times).
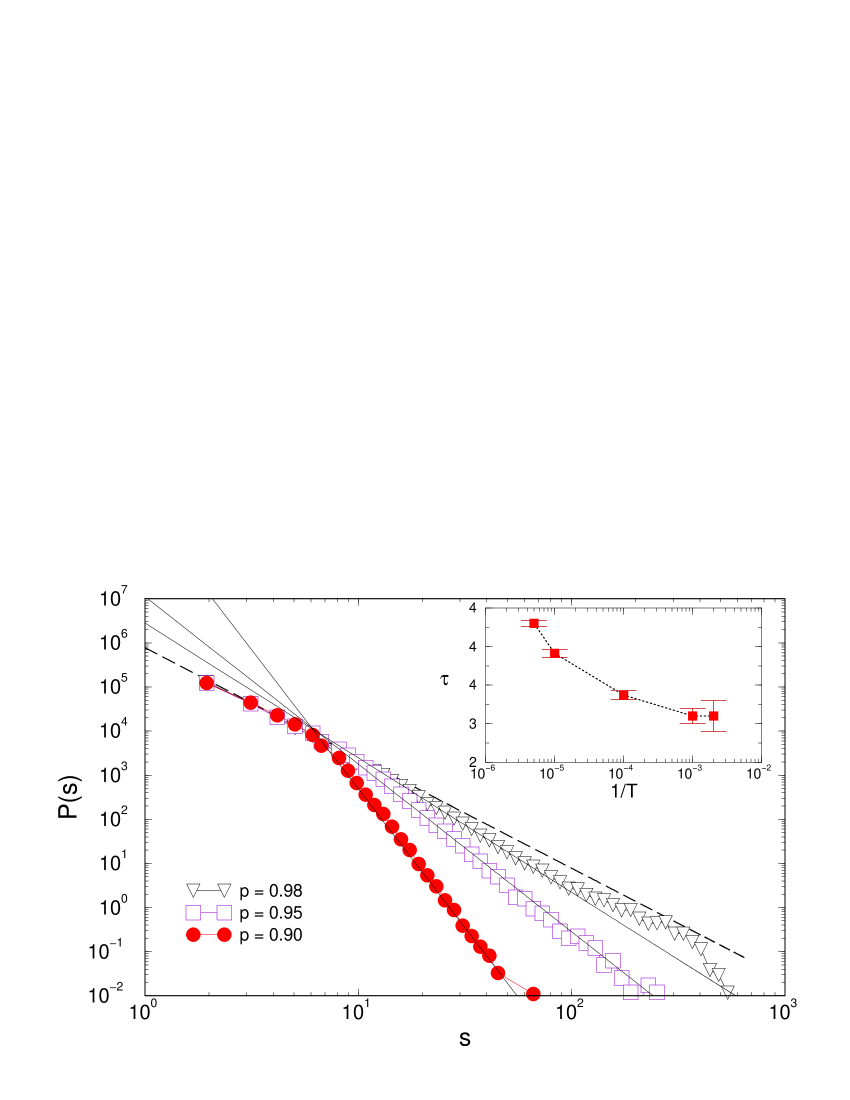
The distribution of cluster sizes, shown in Fig. 4, also varies with with the tail slope dominated by the distribution of the maximal cluster involved in the action. The exponents in the case of the emergent network built on the tree-of-trees structure are found to be smaller compared to the maximal cluster sizes on the annealed random graph. Specifically, the exponents are 6.3, 3.8, and 3.1 for 0.9, 0.95 and 0.98, respectively. The results are for the evolution time steps. Simulations for different evolution times lead to different scaling exponents, as shown in the inset to Fig. 4. Within our model the temporal dependence of the exponent is related to the evolving network structure. Specifically, the network is reconstructed by gaining new links after each action event, as explained above, thus the average connectivity of units increases over time. In the average, the number of the action events for the evolution time is given by . The increased connectivity enables larger clusters to form, however, this occurs at the expence of smaller clusters. Consequently, the distribution is steeper for longer evolution time. The decrease of the exponent with decreasing evolution time can be also understood by considering the aggregation probability as follows: In order to have the same network structure statistically when the evolution time is doubled, , one needs to reduce the number of the reconstruction events per time step, i.e., . This means that the aggregation probability is effectively larger and thus the exponent closer to 5/2.
|
|

|
Further comparative analysis of the network effects on the cluster dynamics is given in Fig. 5. Here we also consider the case where the underlying tree network remains fixed in the actions, i.e, following the action events only the original links are preserved. It is remarkable that, when the largest cluster starts dominating the dynamics (above the threshold value in this case), the tail of the distribution on the tree network coincides with the tail obtained in the annealed random graph topology. This supports our conclusion that the local structure of the network plays a pivotal role in this cluster dynamics. Specifically, the tree graph structure and the annealed random graph, which is locally tree-like, have the same effects statistically on the cluster aggregation and consequently on the size of the largest cluster.
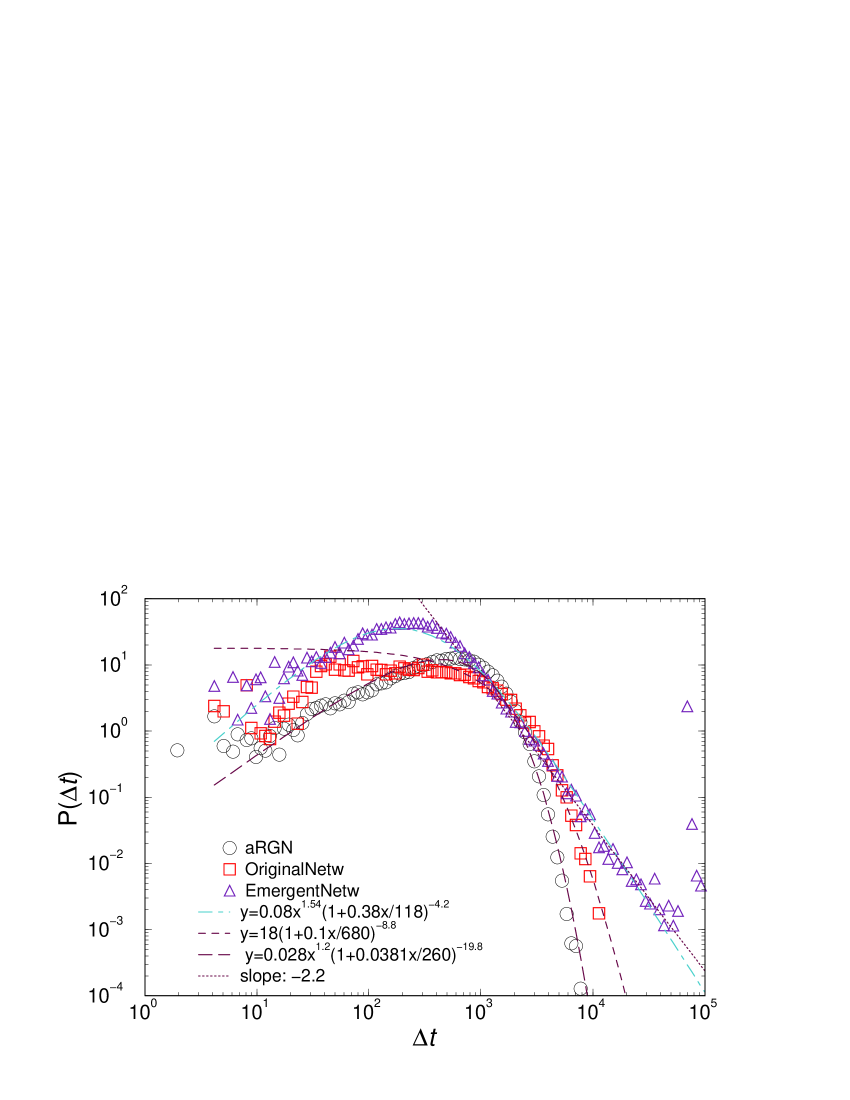
Apart from the cluster size distribution, we find that the network structure also plays a role in how often the units participate in the action. The distribution of waiting times between successive actions of a unit, averaged over all units on the network, is shown in Fig. 5(top) for the three network topologies. Here we see differences appear between annealed random graph and fixed tree network. Apart from small times, the data can be fitted by the exponential function (see tsallis08 for the origin of this distribution in long-range interaction systems):
| (4) |
with a prefactor and different parameters. Specifically, 1.04 (exponential limit!) for the random graph topology, and 1.12 for the fixed tree network. Whereas, a prominent power-law tail with the with the slope 2.66, compatible with 1.38, occurs in the case of the evolution of network. This implies that the units which are deployed less often than the threshold time ( steps), appear to be self-organized in a hierarchical manner.
IV Conclusions
We have studied the cluster aggregation–fragmentation processes on networks and assuming that the largest available cluster is always involved in the fragmentation or action events, which also may affect the network structure. This is motivated by the dynamics of conflicts, where planned war actions deploy the largest forces (and may result in correspondingly large damage). The underlying network with its fixed or dynamically evolving structure represents constraints for the aggregation processes, thus affecting the largest cluster sizes, which is relevant for war conflicts. We also studied the situation where such constraints do not exist (e.g., in the herding events in stock market dynamics, where the information is globally available), resulting in an annealed random graph structure. The process is controlled by the aggregation probability , which may result from another coupled stochastic process, but here it is taken as an external parameter.
We find a number of new features, in both the geometric and temporal patterns of the process, which can be related to the network topology. In particular, the system is characterized by:
-
•
non-universal power-laws in the distributions of the sizes of events; the scaling exponents appear to vary with the fragmentation probability and the evolution time (in the case of the evolving network);
-
•
long-range temporal correlations in time series representing fluctuations of the number of clusters; the correlations are intensified on networks whose structure evolves through the action events;
-
•
evolution of the internal organization, i.e., connectivity and hierarchy between units, as a result of the action events.
The distribution of cluster sizes in the mechanism when the largest cluster is always selected for the action, is conditioned by the local connectivity of the network. Aggregation process on trees yields large number of small clusters due to sparse connections on the tree. Lack of large clusters results in the large scaling exponent of the size distribution. Within network terminology, the cluster aggregation–fragmentation processes in “free space” leads to a sparse random graph structure with annealed links. Its local structure is also tree-like, leading to statistically similar cluster size distribution as on the fixed tree graphs. On the other hand, on the evolving network which gains new links (cliques) after the action events, the node connectivity is progressively increasing. This allows larger clusters to form, and consequently, smaller scaling exponent of the size distribution, compared to the sparse networks for the same fragmentation probability. In both cases the exponent decreases when the fragmentation probability is reduced. In the limit with a vanishingly small but finite fragmentation probability, the distribution is expected to approach the classical slope 5/2 of random aggregation–fragmentation processes, however, the cutoff might be different. This limit needs more theoretical consideration, which is left out of the present work. The relation between the network connectivity and the role of the largest cluster in the dynamics is also the basis for the observed variation of the scaling exponent of all clusters with the evolution time of the network in our model. For a fixed fragmentation probability (number of reconstruction events per time step), the larger evolution time leads to larger size of the fragmented cluster. Hence the distribution of all clusters is steeper, compared to small evolution time, where the difference between cluster sizes is reduced and thus closer to the processes with random cluster events.
Our analysis of temporal features of the system reveals the nature of the process underlying the observed cluster size distribution. Namely, systematic network reconstruction following the actions over time leads to a complex organization between units which causes them to play different roles (frequencies) in the actions. Despite the temporal correlations, which are caused by the involvement of the largest cluster in the events, such internal structure does not occur in the original aggregation–fragmentation model in free space and locally sparse networks. Thus the network reconstruction via the cluster dynamics proposed in our work provides the mechanism for building an effective structure of units, which has large capacity (in terms of the size of events) and a self-organized internal structure.
Acknowledgements.
We are grateful to Collaborative Linkage Grant CBP.NR.NRCLG.982968 for partial financial support of this work. We would like to thank V. Priezzhev for helpful discussions. B.T. also acknowledges support from the program No. P1-0044 (Slovenia) and COST-MP0801 action “Physics of competition and conflicts”.References
- (1) J. A. D. Wattis, Physica D 222, 1 (2006).
- (2) M. von Smoluchowski, Z. Physik 7, 557 (1916).
- (3) R. Becker and W. Doring, Ann. Phys. 24, 719 (1935).
- (4) R. Cont and J.P. Bouchaud, Macroeconomic Dynamics 36, 394 (2000).
- (5) V.M. Eguiluz and M. G. Zimmermann, Phys. Rev. Lett. 85, 5659 (2000).
- (6) R. Dhulst and G. J. Rodgers, Int. J. Pure and Applied Finance 3, 609 (2000).
- (7) N. Johnson, M. Spagat, J. Restrepo, J. Bohorquez, E. Restrepo and R. Zarama, arXiv:physics/0605035.
- (8) L. F. Richardson, Amer. Stat. Assoc. 43, 523 (1948).
- (9) L. F. Richardson, Statistics of Deadly Quarrels, eds. Q. Wright and C. C. Lienau (Boxwood Press, Pittsburgh, 1960).
- (10) M. E. J. Newman, Contemp. Phys. 46, 323 (2005).
- (11) A. Clauset and M. Young, physics/0502014.
- (12) B. Rosenberg and and J. A. Ohlson, J. Fin. Quant. Anal. 11, 393 (1976).
- (13) M. Mitrovi c and B. Tadic, Phys. Rev. E 80, 026123 (2009).
- (14) A. Pluchino, A. Rapisarda, and C. Tsallis, arxiv: 0809.4850.