Accretion in Evolved and Transitional Disks in Cep OB2: Looking for the Origin of the Inner Holes
Abstract
We present accretion rates for a large number of solar-type stars in the Cep OB2 region, based on U band observations. Our study comprises 95 members of the 4 Myr-old cluster Tr 37 (including 20 “transition” objects; TO), as well as the only CTTS in the 12 Myr-old cluster NGC 7160. The stars show different disk morphologies, with the majority of them having evolved and flattened disks. The typical accretion rates are about one order of magnitude lower than in regions aged 1-2 Myr, and we find no strong correlation between disk morphology and accretion rates. Although half of the TO are not accreting, the median accretion rates of normal CTTS and accreting “transition” disks are similar (310-9 and 210M⊙ yr-1, respectively). Comparison with other regions suggests that the TO observed at different ages do not necessarily represent the same type of objects, which is consistent with the fact that the different processes that can lead to reduced IR excess/inner disk clearing (e.g., binarity, dust coagulation/settling, photoevaporation, giant planet formation) do not operate on the same timescales. Accreting TO in Tr 37 are probably suffering strong dust coagulation/settling. Regarding the equally large number of non-accreting TO in the region, other processes, like photoevaporation, the presence of stellar/substellar companions, and/or giant planet formation may account for their “transitional” SEDs and negligible accretion rates.
1 Introduction
In the last years, observations have repeatedly shown that disk dissipation is a complex process, and that substantial evolution occurs to the dust grains and to the SED structure before the disk is rendered optically thin and disappears (e.g. van Boekel et al. 2003; Apai et al. 2005; Lada et al. 2006; Sicilia-Aguilar et al. 2006a, 2007, 2008b, 2009; Rodmann et al. 2006; Currie et al. 2009). By the age of 4 Myr, the typical spectral energy distribution (SED) shows that grain growth, dust settling, or both, have contributed to decrease the flaring of the disk and/or to lessen the dust opacity, resulting in lower luminosities in the near- and mid-IR compared to younger disks (Sicilia-Aguilar et al. 2006a). In some objects, the dust evolution has gone so far, that the disks seem to have been caught in the final act of dispersion, being in an intermediate stage between a normal, Class II object and a Class III source with an optically thin disk. Unlike the normal disks around classical T Tauri stars (CTTS), these “transition” objects (TO) show no significant near-IR excess, but retain optically thick disks at longer wavelengths, which suggest that they have inner opacity holes and are suffering inside-out clearing (Forrest et al. 2004; D’Alessio et al. 2005; McCabe et al. 2006; Sicilia-Aguilar et al. 2006a). How the dusty disk dissipates, and whether all disks go through the TO phase before disappearing, remains uncertain. Regions in the 1-10 Myr age range are found to contain TO, although they seem to be more common in older clusters (Sicilia-Aguilar et al. 2006a, 2009; Currie et al. 2009). The fact that at any age we find objects with and without disks, and the abundance of flattened disks (optically thick, geometrically thin) in clusters of intermediate age (Sicilia-Aguilar et al. 2006a; Currie et al. 2009) suggest a variety of physical processes leading to disk dissipation.
In addition to dust, the disk contains about 99% of gas, which controls the dust dynamics, at least until self-gravitating clumps have formed (Schräpler & Henning 2004; Johansen & Klahr 2005; Johansen et al. 2007). The decrease in disk fraction over time is accompanied by a “parallel” decrease in accretion activity and in the magnitude of the accretion rates (Hartmann et al. 1998; Sicilia-Aguilar et al. 2006b; Fedele et al. 2009). Nevertheless, detecting the gas in the inner few-AU where planet formation is thought to occur, is complicated. Near-IR spectroscopy has revealed the presence (or lack) of gas in the innermost disk of some T Tauri stars with different disk morphologies (Najita et al. 1996, 2003; Carr et al. 2001; Rettig et al. 2005; Pascucci et al. 2006, 2009; Goto et al. 2006; Carmona et al. 2007, 2008; Salyk et al. 2009), but the procedure is too expensive to include large, statistically significant samples of disks. Detecting the gas as it falls onto the star via chromospheric accretion (Königl et al. 1991) is an easier procedure to constrain the presence of gas in the innermost disk for large number of objects.
Objects that have partially dispersed/coagulated their disks (TO) are especially important to understand the factors involved in disk evolution. While there is no consensus about the definition and characteristics of TO, we here follow the rule of considering TO those objects that show zero or negligible IR excess at 6m and normal IR excess (CTTS-like) at longer wavelengths, compared to the photospheric emission. According to our definition, TO have reduced IR colors with [3.6]-[4.5]0.2 mag and a sharp increase in the excesses usually around 8m (Sicilia-Aguilar et al. 2006a. A similar definition has been used by Muzerolle et al. (2009). For solar-type (late G-early M111A 1M⊙ star aged 1 Myr has an spectral type K6 (Siess et al. 2001).) stars, this suggests the presence of an inner hole or a highly evolved/settled and probably optically thin inner disk with radius of a few AU within a disk that is flared and optically thick at larger distances from the star (D’Alessio et al. 2005), consistent with inside-out clearing of the disk (Hayashi et al. 1985). The presence of accretion and the accretion rates are necessary parameters to distinguish between the different scenarios that create the inner holes of the TO (photoevaporation, dust coagulation, planetesimal formation, formation of giant planets). Systems empirically classified as TO do not form a uniform class of objects, but include binaries (Ireland & Kraus 2008), objects with giant planets (Setiawan et al. 2008), and cases where strong dust coagulation and/or photoevaporation have produced an optically thin disk (Pascucci & Sterzik 2009). Since these different processes operate on different timescales, it is not evident that the bulk of TO in regions with different ages should be dominated by the same type of objects (Alexander & Armitage 2009).
Here we present the results of a deep U band survey of the young clusters Tr 37 and NGC 7160, both part of the Cep OB2 region. Section 2 describes the observations, data reduction, and the calculation of the accretion rates. In Section 3 we analyze the potential correlations of Ṁ with disk structure, age, and stellar mass, and explore the fraction of stars that display variable accretion rates. Finally, we summarize our conclusions in Section 4.
2 Observations, data reduction, and accretion rates
2.1 The Cep OB2 region: previous observations
Cep OB2 is a bubble-shaped star-forming region (Patel et al. 1998) located at 900 pc distance (Contreras et al. 2002). It contains several OB stars and the young clusters NGC 7160 (median age 10-12 Myr) and Tr 37 (median age 4 Myr). Tr 37 and NGC 7160 contain a significant population of solar-type stars (180 and 60 late G-M2-type members, respectively). A younger population (aged 1 Myr) is located to the west of Tr 37 (Sicilia-Aguilar et al. 2005b, 2006a). Optical spectroscopy was used to determine the membership, spectral types, and the presence of accretion. The clusters have also been observed with IRAC (=3.6-8.0 m) and MIPS (=24 and 70 m; Sicilia-Aguilar et al. 2006a). In Tr 37, the disk fraction for solar-type stars is 45%, and more than 95% of the disks show low IRAC fluxes (compared to Taurus), which suggests dust evolution (grain growth/settling), especially strong in the innermost disk. About 10% of the objects are TO. In NGC 7160, only two of the known 60 solar-type members conserve their disks. The accretion rates of 45 members of Tr 37 had been estimated via U band photometry (Sicilia-Aguilar et al. 2005b). UVRI observations were obtained with the 1.2m telescope at the the Fred Lawrence Whipple Observatory (FLWO), but the VRI and U band data were not taken simultaneously, and the survey was complete only down to few times 10M⊙ yr-1. High-resolution H spectroscopy of the Tr 37 members (Sicilia-Aguilar et al. 2006b) revealed many more accreting objects, suggesting that deeper U band observations were necessary to fully study the dependence of accretion on disk structure, age, and stellar mass.
2.2 Observations and data reduction
The U V RJ IJ observations of Tr 37 were obtained in service mode during 3 nights in 2007 June 9-11, using the wide field camera LAICA mounted on the 3.5 m telescope in Calar Alto, Spain. LAICA is a 22 mosaic of 4 CCDs (which we name a,b,c,d), each covering a 15.3’15.3’ field of view with a large gap (15.3’15.3’) in between. We obtained four pointings in Tr 37 (named 1,2,3,4 in the Table 1), in order to cover a large field (approximately 45’45’, containing most of the Tr 37 members) and to avoid the brightest stars in the cluster. The exposure time was 3120s in U, and for V RJ IJ, we obtained short and long exposures 310s and 360s, respectively. The 3 dithered exposures ensure a good removal of cosmic rays, minimize CCD defects, and provide a large dynamical range, complete in the magnitude ranges U15-21, V13-21, RJ12-21, and IJ11-20 (from now on, RJ and IJ are simply written R and I). The time span of the observations was less than 1.5 h for the objects observed in the same night. Pointing 1 (UVRI) was observed during the first night. During the second night, we observed the pointing 2 (UVRI) and U band for the pointing 3. During the third night, we obtained VRI for the pointing 3, and UVRI for the pointing 4. Therefore, all the UVRI observations for the pointings 1,2, and 4 can be considered nearly-simultaneous, and the U band observations of pointing 3 are separated by 23 h from the pointing 3 VRI (see Table 1). All the nights were photometric, with seeing in the range 0.6-1.3”.
The observations of NGC 7160 were obtained in 2007 October 5, using the 70 cm King telescope of the Max-Planck-Institut für Astronomie at the Königstuhl, Heidelberg, Germany. The telescope is equipped with a CCD with a field of view 18’18’ and standard UBVRJIJ filters. We followed a similar strategy, obtaining 3 exposures of 10s and 240s in U, and 3120s for the rest of filters, in a field centered on the cluster, which includes the only two low-mass sources with disks detected with in NGC 7160 (only one of them was detected in U). Given the smaller diameter of this telescope, the survey is complete down to U18, V18, R17.5, I17 only. The night was clear but not photometric, and the seeing was poor (2”).
The data from the two telescopes were reduced following standard procedures with IRAF222IRAF is distributed by the National Optical Astronomy Observatories, which are operated by the Association of Universities for Research in Astronomy, Inc., under cooperative agreement with the National Science Foundation. within the noao.imred.ccdred package to do the bias and flat field corrections, and noao.digiphot.apphot for aperture photometry. The flux calibration was obtained as relative (or differential) photometry (Herbst et al. 2000; Briceño et al. 2001), which we have also used to calibrate the variable star GM Cep (Sicilia-Aguilar et al. 2008a). For each field and band, we matched our instrumental photometry to existing calibrated data. The fact that most stars in the fields are non-variable allows us to derive the calibration zeropoints for our data. The UVRI data for Tr 37 and the VRI data for NGC 7160 were compared with our previous optical data from the Fred Lawrence Whipple Observatory (Sicilia-Aguilar et al. 2005b), properly transformed from the Cousins FLWO filters into the standard Johnsons system (Fernie 1983). Lacking U data for NGC 7160 from our FLWO catalog, the U band observations of NGC 7160 were calibrated comparing with the catalog from De Graeve (1983). Since the calibration involves a large number of stars observed simultaneously in the same CCD, the zeropoint uncertainties are typically lower than 1%, so the magnitude errors are dominated by the signal to noise ratio (S/N). The magnitudes and their errors are listed in Table 2. To ensure the quality of the photometry, all images were visually inspected to remove all objects that could be affected by nearby stars, scattered light from bright sources, or CCD artifacts. We also compared the photometry from our previous studies (Sicilia-Aguilar et al. 2004, 2005b) and those stars displaying magnitude variations V0.5 mag are labeled as “variables” in Table 2. Note that 65% (62/96) of the objects display small magnitude variations (0.1 mag; see Section 3.4).
2.3 Accretion rates
The accretion rates were derived from U broad band photometry following the correlation between accretion luminosity (Lacc) and U band excess luminosity (LU) found by Gullbring et al. (1998):
| (1) |
The accretion luminosity corresponds to the energy released by the matter falling onto the star. The accretion rate can be obtained from the accretion luminosity if the stellar mass and radius (M∗, R∗) are known, assuming that the accreted matter reaches the star in free fall via chromospheric accretion from a distance Rin5 R∗:
| (2) |
To calculate the excess of luminosity in U band (LU) for a given object, we need to know the measured U band luminosity and the expected U band luminosity for a star with the same spectral type and luminosity. A good extinction correction and accurate spectral type are essential. The spectral types for the Tr 37 and NGC 7160 members were derived from low-resolution spectroscopy in Sicilia-Aguilar et al. (2004) and Sicilia-Aguilar et al. (2005b), and are accurate up to 1 subtype (for K and M stars) and 2 subtypes (for G-type stars). We calculated the extinction from the V-R and V-I colors, applying the relations in E(V-R)=0.249 AV and E(V-I)=0.521 AV (Cardelli et al. 1989) and considering the standard colors for each spectral type (Kenyon & Hartmann 1995). Circumstellar matter may produce a non-standard extinction law, but the similar AV values obtained from V-R and V-I suggest that the main source of extinction towards Cep OB2 is standard interstellar matter. Due to pointing offsets, a few sources lack V photometry, so we derived their extinction from E(R-I)=0.272 AV. Finally, for the objects for which only one band (V, R, or I) was available, we consider previous measurements of the extinction (Sicilia-Aguilar et al. 2004, 2005b) with an error of 0.45 mag (corresponding to the standard deviation of AV in the cluster). If AV has not been measured previously, we take it to be the average of the cluster with its standard deviation (AV=1.670.45 mag; Sicilia-Aguilar et al. 2005b). The final uncertainties in the extinction reflect the errors in the photometry, spectral type, and the variations between AV calculated via E(V-R) and E(V-I).
The U band luminosity is derived from the U magnitude corrected by the extinction. The U band luminosity due to the stellar photosphere is calculated using the U-V and V-I colors and the bolometric correction for standard stars (Kenyon & Hartmann 1995), together with the extinction-corrected I magnitude (or, in objects without I magnitude, R or V). Magnitudes are transformed into luminosities taking into account the zero point flux and bandwidth for U band (4.1910-9 erg s-1 cm-2 Å-1 and 680 Å, respectively). The stellar masses (M∗) and ages are calculated from the extinction-corrected V vs. V-I diagram and the Siess et al. (2000) isochrones, and the stellar radii (R∗) are obtained from the total stellar luminosities and the effective temperatures. In the few cases where no V or no I are available, we use the total photospheric luminosity and effective temperature on a HR diagram and the Siess et al. (2000) isochrones to derive the stellar parameters. Knowing M∗, R∗ and the excess U band luminosity LU, the accretion luminosity and accretion rate are derived from Equations 1 and 2. The results are listed in Table 3.
Given the number of parameters involved in the mass accretion calculation, it is important to assess if the measured Ṁ is significant. Since the quantities required for the calculation of Ṁ are not independent (in particular, the two main contributors to the uncertainty, the spectral type and the extinction, are strongly correlated), standard error propagation largely overestimates the errors. Moreover, the relation between the U magnitude and LU is highly non-linear, so the errors are asymmetric in the positive and negative directions. We therefore estimated the errors generating 5000 sets of artificial data per object. The artificial data were constructed by adding Gaussian noise with an amplitude corresponding to the measured errors to the involved parameters. We then consistently derived AV and repeated the calculation of Ṁ for each one of the 5000 sets. The errors for each star are derived from the Ṁ distribution as the standard deviation in the positive and negative directions. We consider an accretion rate to be safely detected (0.99 probability) if LU is positive in more than 99% of the simulations. If not, we estimate a 3- upper limit to Ṁ, except for those objects for which H observations have ruled out the presence of accretion, especially if our data reveal no excess emission, given that H is a more sensitive criterion for low accretion rates than LU. For these narrow-H objects, we consider the accretion rate to be 10-11 M⊙ yr-1, which is in agreement with the line profile fitting for M-type stars (Muzerolle et al. 2003) and with the observations of late-K objects in the Cha cluster (Lawson et al. 2004)333 Note that the limit will be lower for M-type objects and higher for the early K and G stars.. For simplicity, these “non-accreting” objects are labeled with Ṁ=0 M⊙ yr-1 in Table 3.
In addition, there are other sources of error: uncertainties in the stellar radius, stellar mass, and size of the stellar chromosphere. These uncertainties do not change the detectability of the accretion rate, but vary Ṁ by a typically small multiplicative factor (2-3; Gullbring et al. 1998). Since the accretion rates are found to vary by a factor of few when the same star is measured over time, these uncertainties do not affect our conclusions. The ability to detect accretion via U band excess emission also depends on the spectral type, which in our sample varies between G8 and M2.5 (median spectral type K7). For M stars, which have small intrinsic U band photospheric luminosity, small accretion rates result in detectable U band excess. For early K and G stars, a contrast problem appears as the U photospheric luminosity is much stronger than the LU caused by relatively large accretion rates (10-8-10-9 M⊙ yr-1). Therefore, some of our Ṁ measurements for the most massive stars are only (high) upper limits. This has to be taken into account as a source of bias when studying the relation between the stellar mass and the accretion rate. For the typical late K-early M star in our sample, our U band photometry is sensitive to accretion rates of the order of 10-10 M⊙ yr-1.
Comparing with our previous results, in particular, with the H high-resolution spectroscopy with Hectochelle (Sicilia-Aguilar et al. 2006b), we find a very good agreement. All the objects with broad H are found to be accreting or have upper limits consistent with the typical accretion rates found in other cluster members. We found an inconsistency between the spectral types in Sicilia-Aguilar et al. (2005b) and the VRI colors of two G-type stars, 12-1091 and 11-581. They appeared to be too red and had U magnitudes below the photospheric level, even assuming the large extinctions derived from VRI. Considering that our spectral types were more uncertain for G-type stars, we checked our spectra (taken with FAST and Hectospec; Sicilia-Aguilar et al. 2005b) comparing them to new standard stars and similar cluster members. The new spectral types (K2 for 12-1091 instead of G2.5; G9 for 11-581 instead of G5) are fully consistent with the photometry, and produce a more reliable value of AV (with a similar value when derived from E(V-I) and E(V-R)). Two objects are inconsistent in the sense that they lack evidence of a disk and have narrow H profiles, but display U band excess (12-1984 and 12-1422). They both have non-simultaneous observations (pointing 3c), which may explain the disagreement. The star 12-1422 is nevertheless a special case, since it does not display any detectable IR excess nor H broadening, but had a high H EW (-17 Å for a M0 star) measured with our low-resolution spectra. Although its accretion rate is close to our detection limit, we might consider it as a potential accreting TO with a large inner hole, to be confirmed with future observations. Accretion in objects with no excess at 8m seems rare, although here we confirm the case of 13-819, which had been previously detected to have broad H despite the lack of excess at all IRAC wavelengths.
Finally, two TO with narrow H appear now to be accreting (12-1009 and 72-875), and two more have upper limits consistent with accretion (14-197 and 12-595). For 12-1009, the data are non-simultaneous, and the star is known to have strong variability. The star 72-875, which is probably a single-lined spectroscopic binary (SB1) and has strong MIPS excess but narrow H, is now found to have a U band excess. IRS spectroscopy (Sicilia-Aguilar et al. in prep.) reveals that it is a TO with no excess at wavelengths shorter than 7m, so the object seems to have suffered a large increase in its accretion rate within a few years (see Section 3.4). The TO 14-197 is a similar mass spectroscopic binary, and we thus believe it is most likely non-accreting. The star 12-595 shows anomalous colors and extinction, being probably affected by scattering, non-standard extinction, and/or strong variability. Its U and VRI magnitudes are non-simultaneous and its LAICA V magnitude differ from the FLWO values by 1 magnitude, which suggests that the object is strongly affected by variable extinction by circumstellar material. Although they are a minority, all the inconsistent or potentially inconsistent objects are excluded from the analysis and discussion below.
As an additional note, here we confirm once more (as stated in Sicilia-Aguilar et al. 2006b) that even detailed criteria to distinguish accreting and non-accreting stars based on H equivalent width (EW) alone (e.g., White & Basri 2003) may misclassify a certain number of objects with low accretion rates or active WTTS. This is in general not important for statistical purposes, especially in young clusters with typically high accretion rates. Nevertheless, it may become a problem in older regions like Tr 37 and NGC 7160 where low Ṁ is the rule. In our study, the White & Basri (2003) criterion for H EW would misclassify 7 objects out of 96 (11-1209, 11-581, 12-1091, 13-819, 13-1048, 13-1250, 22-1418, see Table 3). Therefore, other observations (especially high-resolution H spectroscopy) are important to constrain the presence of accretion in the objects with the lowest rates.
3 Analysis
3.1 Gas accretion and dust evolution
In order to check the relation between accretion rates and dust evolution, we compare the disk morphology with the measured Ṁ. It is not easy to define a tracer of disk morphology or SED slope in the Cep OB2 members, given that the typical SED slope varies between the near- and mid-IR, with most objects showing a “kink” or slope change around 6-8 m (Sicilia-Aguilar et al. 2006a). Therefore, we measure the SED slope () at different wavelengths, and compare the values with the measured accretion rates (Figure 1). According to our empirical definition, TO have SED slopes consistent with photospheres at 6m, together with negligible excess emission ([3.6]-[4.5]0.2 mag) down to this wavelength. In our Spitzer study, we did not include as TO objects having only a weak excess at 8m (named as “e8” in Sicilia-Aguilar et al. 2006a) that were not detected at 24m (due to our relatively high detection limits at 24m). Nevertheless, our recent IRS spectroscopy has confirmed as TO the two TOe8 observed, which together with the facts that no such objects were found in NGC 7160, and that at least one is actively accreting (24-1796), suggested that they are real TO. Summing up the number of “e8” TO, the TO fraction in Tr 37 (including accreting and non-accreting TO) would be closer to 20% of the total number of disks (or 10% of the total number of stars), and roughly half (9/20) of the TO are accreting.
Figure 1 does not reveal any strong trend of the accretion rate with the SED slope . The Spearman rank correlation coefficients (r) and probability of obtaining such r from randomly distributed data (p) for Ṁ versus at different wavelengths vary between 0.01 and 0.3 (for r) and 0.97-0.02 (for p; see Table 4). There is a moderate correlation between the slope in the innermost disk (3.6-5.8m) and the accretion rates (r=0.38, p=0.02), which disappears at intermediate wavelengths, and becomes a weak anticorrelation (r=-0.26, p=0.12) for (8.0-24). The 24m photometry was not deep enough to detect photospheres of solar-type stars at these wavelengths, but given the dispersion of the accretion rates for the objects detected and non-detected at 24m, we do not believe that the inclusion of objects with undetected 24m fluxes would change the conclusions. This suggests that, in general, objects with more evolved inner disks444Note that TO and objects with “kink” SEDS have the largest (often positive) (8.0-24) slopes in the sample. tend to have smaller accretion rates. This correlation would be expected if the changes in the dusty disk reflected the evolution of the total surface density, with the dusty and gaseous components evolving “in parallel” (Sicilia-Aguilar et al. 2006b; Fedele et al. 2009). Nevertheless, the fact that most of the Tr 37 disks are substantially evolved and do not have large accretion rates make this trend weak.
Therefore, we find that the objects with the highest accretion rates tend to have the most flared disks, and that there are no TO with Ṁ10-8 M⊙ yr-1. Nevertheless, the distribution of accretion rates of TO and CTTS disks are not significantly different (within the limitations of small number statistics; see Section 3.3), and the median accretion rate is the same for accreting TO and normal CTTS disks (210-9 M⊙ yr-1 and 310-9 M⊙ yr-1, respectively). Most of the CTTS in Tr 37 have relatively low accretion rates (few times 10M⊙ yr-1), which makes them indistinguishable of the accreting TO in terms of accretion rate. The large number of CTTS with low Ṁ suggests that, in general, accretion rates as low as 10-9-10-10 M⊙ yr-1 do not necessarily cause the opening of an inner hole, as had been suggested by photoevaporation models (Clarke et al. 2001; Ercolano et al. 2009b).
Nevertheless, about half of the TO do not show U band excess nor H line broadening, which sets upper limits to the accretion of 10M⊙ yr-1, despite having similar disk slopes than the accreting TO (see Figure 1) None of the objects with normal near-IR excess lacks evidence of accretion, which reveals an important difference between TO and normal disks, and points out relevant physical differences between accreting and non-accreting TO, as has also been inferred from near-IR spectroscopy (Salyk et al. 2009). Conversely, accretion in objects without any IR excess at /IRAC wavelengths (and thus, large holes 10 AU) seems rare. We found one object (13-819) with broad H, a measurable accretion rate, and no excess down to 8m, although two more objects could represent similar cases (21-895a and 12-1422). Since our MIPS 24 m survey did not detect photospheres of solar-type stars, these objects could still have an excess longwards of 8m and thus a disk with a few-AU hole.
3.2 Accretion evolution and the Ṁ vs. M relation
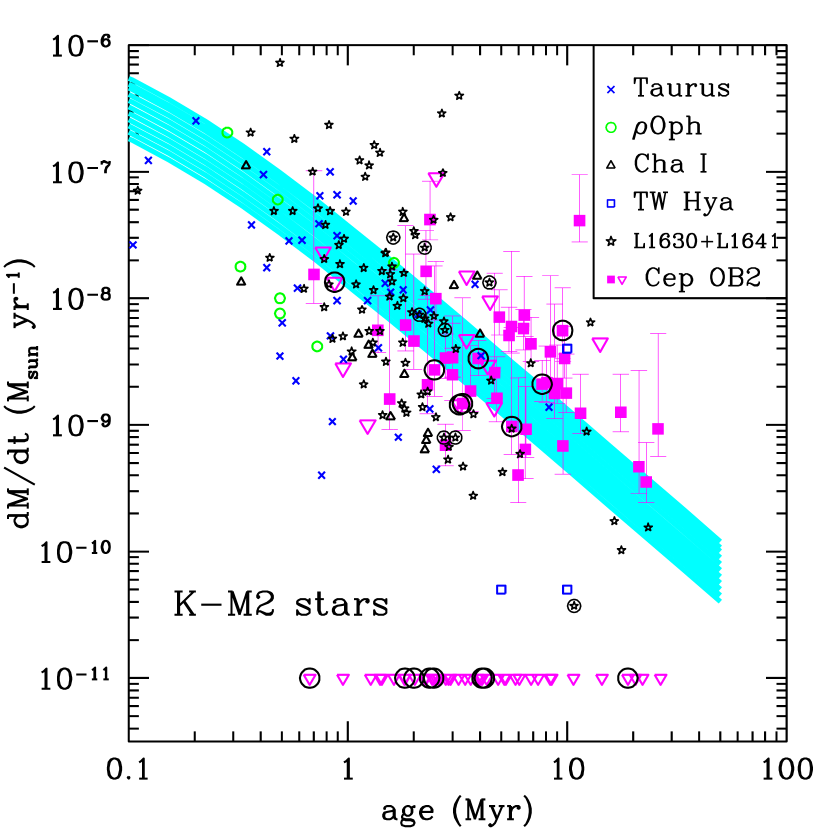
In the light of the new data for Cep OB2, we examine the time evolution of the accretion rate and the Ṁ vs M relation. Accretion rates for T Tauri disks are thought to decrease with time in a way that is consistent with the evolution of a viscous disk (Hartmann et al. 1998; Muzerolle et al. 2000; Sicilia-Aguilar et al. 2005b, 2006b). Figure 2 shows the accretion rates of the Cep OB2 objects versus their individual ages, compared to the values measured in other regions: Taurus, Ophiuchus, Chamaeleon I, and TW Hya (Muzerolle et al. 2000), and the Orion L 1630N and L 1641 clouds (Fang et al. 2009), and to the predictions of viscous disk evolutionary models (Hartmann et al. 1998). Although the ages of individual objects are uncertain, given the presence of unresolved binaries and the stellar variability, the global age differences between regions are real. For the G-type stars, the uncertainties in the birthline (Hartmann 2003) result in uncertain ages. Since G-type stars also have more massive disks and higher accretion rates, and our sample contains very few stars earlier than K0 (the median spectral type is K7), we study the time variation of the accretion rate concentrating on objects with spectral types K-M2 only.
The Cep OB2 data in Figure 2 are consistent with the picture of viscous disk evolution, finding a moderate correlation between Ṁ and age (r0.32, p=0.03). Although the ages of individual objects in Tr 37 are uncertain, the global age spread in Figure 2 is real, as there is a younger (1 Myr) population in Tr 37, associated to the IC 1396A globule, and an age gradient throughout the cluster (Sicilia-Aguilar et al. 2005b). Including the rest of regions above mentioned, the picture of viscous evolution becomes more clear, and the correlation between age and Ṁ becomes very strong (r0.60, p0.001). The large range of Ṁ displayed by objects with a similar age confirms that accretion (and disk) evolution does not happen in the same way in all objects: At any given age, there are many objects that do not have disks and are not accreting. In Tr 37, the number of non-accreting stars is similar to the number of accretors. The initial disk mass and viscosity law affect Ṁ (t), but viscous evolution alone would not result in so many diskless stars at intermediate ages. Photoevaporation may contribute to remove large amounts of gas and shorten the disk lifetimes (Clarke et al. 2001; Alexander et al. 2006b; Gorti et al. 2009).
Although the accretion data in Cep OB2 and other regions are roughly consistent with viscous evolution (Figure 2), some differences observed provide clues about the different processes that result in disk evolution and dissipation, as well as the typical disk characteristics. The global distribution of accretion rates suggests that the initial disk mass, which controls the initial Ṁ and thus results in higher or lower accretion rates throughout the time, is higher than the 0.1 M⊙ assumed by Hartmann et al. (1998)555Note that an initial disk mass 0.1M⊙ results in a disk mass comparable to the minimum mass for the solar nebula, 0.01 M⊙ at 1 Myr age.. This disk mass had been calculated from millimeter observations, and we know now that they are probably underestimated by up to an order of magnitude (Andrews & Williams 2007). An initially higher disk mass by a factor of 2-3 would thus be more consistent with the accretion rates we observe in Tr 37 (see Figure 2). The mass would be even higher if we consider photoevaporation in addition to viscous evolution, since up to 50% of the initial disk mass may be lost via photoevaporation (Gorti et al. 2009). In addition, the typical decay of Ṁ over time seems slower than previously assumed in the models (Ṁ, with 1.2 rather than 1.5-2.8 as proposed by Hartmann et al. 1998). This is probably related to the fact that after 4 Myr, only the most massive disks survive, while most of the others have been dissipated by a combination of viscous evolution and photoevaporation (Alexander et al. 2006b; Gorti et al. 2009). The slower decay we observe in our Ṁ versus age plot also suggests that the long-surviving disks may be biased towards certain radial viscosity laws. In fact, this would be in good agreement with recent observations of Isella et al. (2009) which also revealed a large variety in the viscosity parameter radial exponent for different solar-type objects.
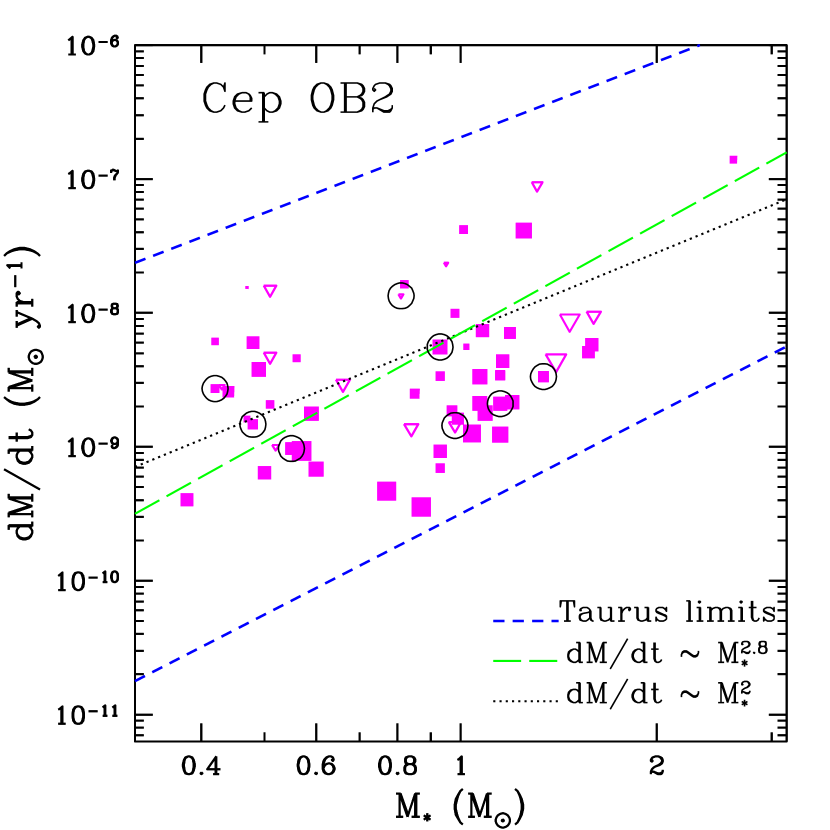
Regarding the relation between the accretion rate and the stellar mass (Figure 3), our results are consistent with a moderate correlation between stellar mass and accretion rate (r0.32, p=0.03) with the slope range observed in Taurus (Calvet et al. 2004), although our sample has systematically lower accretion rates. Our data are also consistent with the Ṁ M relation, with 2-3, as has been suggested by Muzerolle et al. (2003), Natta et al. (2004) and, more recently, by Fang et al. (2009), who found a larger index (3) for the lower-mass stars. Nevertheless, the small mass range spanned by the Cep OB2 objects does not allow us to estimate the value of , and the fact that U band is less efficient detecting low accretion rates of early K-G stars may also introduce an important bias.
3.3 Accretion in TO: Constraining the origin of the “inner holes”
TO and, in general, evolved disks, are a key factor to understand disk dissipation. Several mechanisms have been invoked to produce a TO disk, but the contribution of each one is not yet understood. The most important ones seem to be photoevaporation (Clarke et al. 2001; Alexander et al. 2006a,b, 2007; Gorti et al. 2009), dust coagulation (Ciesla 2007), and planet formation (Quillen et al. 2004; Edgar et al. 2007). Photoevaporation sets strong constraints to the lifetime and accretion rates of the disk, while strong dust coagulation and planet formation are more flexible. In addition, the inner holes of some TO disks may not be related to pure disk evolution, but to the presence of close-in binaries (Ireland & Kraus 2008). Although TO tend to be rare, summing up to 5-10% of the total number of disks (Hartmann et al. 2005; Fang et al. 2009), some low-mass star forming regions like the Coronet cluster, the MBM12 region, and the Cha cluster display very high number of TO and evolved disks (Sicilia-Aguilar et al. 2008b; Meeus et al. 2009; Megeath et al. 2005; Sicilia-Aguilar et al. 2009). Although the lack of near-IR excess in very low-mass objects is not a clear sign of a clean inner hole, but may be also reproduced by very flattened/settled disks around low luminosity stars (Ercolano et al. 2009a), the structural differences between these TO and the normal, flared disks are obvious and suggest a strong degree of evolution. In older regions, the number of objects that seem to be “in transition” between Class II and Class III sources, including those with flattened/coagulated/settled inner disks, is higher than expected if the mechanisms leading to inside-out disk clearing operated in less than a Myr (Currie et al. 2009).
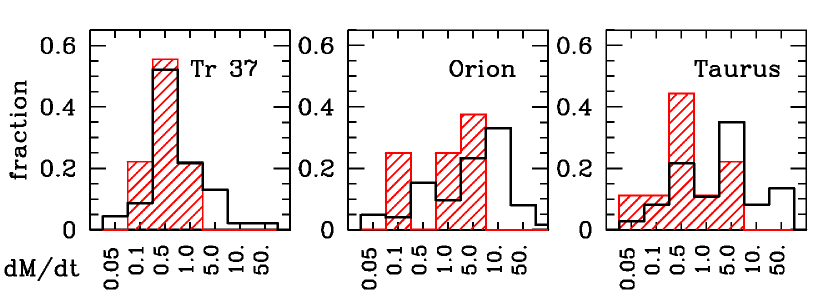
In order to contrast the TO properties at different ages, we examined several well-known regions at different stages of evolution, restricting ourselves to the range of solar-type stars (late G-M2). In Tr 37 the median accretion rate of the CTTS (based on 46 objects) is Ṁ= 310-9 M⊙ yr-1, which is not significantly different from the median accretion rate of accreting TO (Ṁ= 210-9 M⊙ yr-1, based on 9 objects). In Taurus, the median accretion rates of CTTS (based on 42 objects) and TO (9 objects) differ by one order of magnitude, being Ṁ= 310-8 M⊙ yr-1 for CTTS and Ṁ= 310-9 M⊙ yr-1 for TO (Najita et al. 2007). In the L 1630N and L 1641 Orion clouds, Fang et al. (2009) gives a similar accretion rate, Ṁ= 310-9 M⊙ yr-1, for both CTTS and TO with spectral types G-M6, but if we restrict ourselves to the solar-type range, we find median accretion rates of Ṁ= 110-8 M⊙ yr-1 for CTTS and Ṁ= 710-9 M⊙ yr-1 for TO (for 88 and 8 stars, respectively). Histograms of the accretion rates of CTTS and TO in the different regions are displayed in Figure 4. Taurus and the Orion clouds have roughly the same ages (1-2 Myr), but the differences between the accretion rate of TO and CTTS in Orion is rather a factor 2 (thus similar to Tr 37, within small number statistics) than a factor 10. The accretion rates of TO in the work of Najita et al. may be underestimated, since they include upper limits to some TO that are most likely not accreting (like CoKu Tau/4; D’Alessio et al. 2005; Ireland & Kraus 2008), while Fang et al. excludes the non-accreting TO (Ṁ10-11 M⊙ yr-1) from the median, as we do here. The way Ṁ is derived is different in Fang et al. (2009), who estimate the accretion rate from the H luminosity, compared to Najita et al. (2008), who use accretion rates derived from veiling and U band excess, which are expected to match our work here. Nevertheless, the H luminosity vs. Ṁ calibration of Fang et al. (2009) was done using objects whose accretion had been measured from UV veiling and/or U band excess (Gullbring et al. 1998; Dahm 2008; Herczeg & Hillenbrand 2008), so we expect no systematic offsets when comparing the different datasets.
We find differences in the distribution of accretion rates of normal CTTS and TO in the three regions (see Figure 4). The relative numbers of TO that do not show accretion indicators are also different, being higher in Tr 37 than in Orion (50% versus 30%; Fang et al. 2009). In Tr 37, the fact that we find normal CTTS with low Ṁ and TO with similar accretion rates suggests that the difference in near-IR excess for these two types of sources is related only to the dust content (grain growth/dust settling), without significant differences in the gaseous disk component. In addition, the difference in the accretion rates of TO in regions with different ages is not as striking as the evolution seen for CTTS (see Figures 2 and 4). This could be understood if the mechanisms producing the holes of TO require a special range of accretion rates to be effective, or if the changes produced in the disk structure of TO constrain the allowed range of Ṁ.
The order of magnitude difference between the accretion rates of CTTS and TO (for similar disk masses) observed by Najita et al. in Taurus is consistent with the opening of holes by Jovian planet formation. The predictions for the changes in the accretion rate with the presence of a planet suggest that the accretion through the gap is about 10% of the accretion through the outer disk (Lubow & D’Angelo 2006). Viscous evolution would proceed relatively undisturbed after the formation of a planet (Mordasini & Klahr, private communication), and thus the accretion rates of TO would be expected to evolve with time as the accretion for normal CTTS disks does. Therefore, the lack of differences and Ṁ evolution seen in Tr 37 suggests that most of the accreting TO in this region are not related to giant planet formation. Planet synthesis models (Mordasini et al. 2009) predict that planet formation in disks with typical masses would peak at an age 4 Myr, so we may expect a large number of planet-related holes at the age of Tr 37. Nevertheless, the mass distribution of observed planets (Bouchy et al. 2009) indicates that most of these objects would have masses insufficient to open a clean hole, or too large to allow accretion to continue. Therefore, we may expect that most of the disks harboring planets in Tr 37 would show either normal IR excess, or be otherwise non-accreting TO.
The timescales for the onset of the different disk-clearing mechanisms (close-in binaries, photoevaporation, strong grain coagulation/settling, and/or planetesimal/planet formation) are not the same, and the lifetimes of the resulting objects are also different. Therefore, it is not evident that the bulk of TO in regions with different ages ought to contain physically similar objects. Rapid formation of a giant planet in a gravitationally unstable inner disk is nearly instantaneous (Boss 1997), although only a minority of disks may be massive enough to suffer gravitational instability (Andrews & Williams 2007). A hole due to the presence of a binary companion would appear also immediately, but the resulting circumbinary disk is expected to survive less than a disk around a single star, with a lifetime 5 Myr (Bouwman et al. 2006). Photoevaporation (Clarke et al. 2001) is efficient only in combination with viscous evolution (Gorti et al. 2009), but it produces an inner hole only if the accretion rate falls below a certain limit and the disk mass is low enough666Note that X-ray+FUV photoevaporation, combined with viscous disk evolution, is efficient removing a large fraction of the disk mass in a few Myr even if no hole is created.. The lifetimes of the resulting TO are expected to be of the order of few hundred thousand years (Alexander et al. 2006a,b; Gorti & Hollenbach 2009). Other studies involving time-dependent disk evolution and X-ray/FUV/EUV photoevaporation predict inner hole opening starting at 4 Myr, and TO lifetimes that can exceed 1 Myr (Gorti et al. 2009), although accretion would drop to undetectable levels shortly after the opening of the hole. Photoevaporation also depends strongly on the structure of the disk and the dust (Gorti & Hollenbach 2009, Gorti et al. 2009; Ercolano et al. 2009b). The lower irradiation in flattened (geometrically thin) disks decreases the efficiency of photoevaporation, while grain growth decreases the opacity of the disk and thus favors photoevaporation. The combined result of these two oposite effects is unclear, and probably depends on the individual disk parameters (U. Gorti, private communication). Some observational studies have suggested that strong mass removal by photoevaporation may only be efficient at a late stage in the disk evolution (Pascucci & Sterzik 2009), as has been also proposed theoretically (Alexander & Armitage 2009). The theoretical timescales for dust coagulation are uncertain (Dullemond & Dominik 2005; Brauer et al. 2008; Birnstiel et al. 2009), but observations suggest an important degree of dust evolution in the disks of solar-type stars by the age of 4-5 Myr (Sicilia-Aguilar et al. 2006a; Rodmann et al. 2006; Currie et al. 2009).
The systematically flatter disks in Tr 37 (compared to Taurus) and the similar accretion rates of accreting TO and normal CTTS are consistent with most TO in Tr 37 resulting from strong grain coagulation that leaves the gas content (and accretion) relatively unchanged. The implications of the lack of statistical differences in the accretion rates of accreting TO and normal disks in Tr 37 are multiple. On one hand, significant amounts of matter must be crossing the depleted inner disks of accreting TO, which favors the scenario where the near-IR hole has been created by planetesimal formation/strong grain coagulation, rather than being due to gas removal by photoevaporation. A picture where the small dust has been strongly or even totally removed, but the gas flow continues more or less undisturbed, seems more complicated to achieve than a situation where the whole inner disk has been cleared from dust and gas. Several mechanisms, like dust filtration at the edges of a gap created by a planet (Rice et al. 2006) and the differences in turbulence/coagulation between active and dead zones in layered disks (Ciesla 2007) have been proposed to produce radially-dependent dust distributions and optically thin inner disks. Radially dependent grain coagulation and settling are also consistent with the typical SEDs seen in the CTTS members of Tr 37, many of which show a change of slope or “kink” around 6-8m (Sicilia-Aguilar et al. 2006a). Non-accreting TO in Tr 37 cannot be explained by grain coagulation alone, but require a mechanism to remove the gas or at least, not to allow the gas transport into the inner disk. Binary companions could be a good candidate, although we would expect few surviving circumbinary disks at 4 Myr age (Bouwman et al. 2006), and recent surveys of TO suggest that binaries as the cause of TO are the exception and not the rule (Pott et al. 2009). Photoevaporation may only be efficient for the most flared objects, but strong grain coagulation may help to photoevaporate the gas in the innermost regions once the dust opacity decreases sufficiently. Finally, the formation of one or more giant planets may reduce the typically low accretion rates of CTTS in Tr 37 below our detection limits, which could explain at least part of our non-accreting TO.
In addition, initial conditions, that have been invoked to explain the spread in the Ṁ vs. M∗ relation (Dullemond et al. 2006), could also determine the types of disks and TO that dominate in a given cluster. The quiescent, undisturbed environment in Taurus may affect both the evolution of the disks, compared to OB associations like Orion L 1630N and L 1641 clouds or Tr 37, as well as the initial conditions at the time of formation (and thus, initial disk masses and sizes).
3.4 Accretion variability: How common are EX-or objects?
Young pre-main sequence stars are known to be variable, with most variations due to the combination of rotation and cool spots (type I variability), hot spots and changes in the accretion rate (type II variability), and obscuration by circumstellar dust (type III variability; Herbst et al. 1994; Hillenbrand et al. 1998). In the case of accreting stars, variations up to 0.5 magnitudes at optical wavelengths in timescales of a few days are common, suggesting that the accretion flow is variable (Bertout 1989; Briceño et al. 2001; Eiroa et al. 2002). Variable accretion has been also suggested by the changes in the accretion-related emission lines (both in line profile and in EW; Alencar et al. 2001; Alencar & Batalha 2002; Sicilia-Aguilar et al. 2005a). Accretion variability is more dramatic in the case of EX-or objects, which experience repeated outbursts of different magnitude in timescales of months to decades (Hartmann & Kenyon 1996; Herbig et al. 2001; Herbig 2007, 2008). Some particularly bright outbursts may be strong enough to trigger the formation of crystalline dust throughout the disk (Ábrahám et al. 2009), which could explain the abundance of crystals in the comets in our own Solar System. It has been suggested that the EX-or phase should be common for young stars (Hartmann & Kenyon 1996; Hartmann 1998), but the actual fraction of objects suffering accretion variability is uncertain, especially because the typical variations may be too small (2 mag) to be noticed in more distant clusters and associations.
We have discussed in detail the variability of the Tr 37 member GM Cep (also known as 13-277 in our member list; Sicilia-Aguilar et al. 2008a). Taking just into account our previous optical data (Sicilia-Aguilar et al. 2004, 2005b) and our new photometry, we find that more than 10% of the stars display variations in V of at least 0.5 magnitudes (see Table 2). Given that we compare here only two epochs, we expect that many more of the cluster members regularly display variability with V0.5 mag. A lower degree of variability, V0.1 mag is even more common, with 2/3 (65%) of the objects showing such changes. Among the 8 objects with double measurements in our LAICA survey, we do not observe significant variations between the Ṁ measured on consecutive days. Despite the limitations of our FLWO observations, we have compared our previous accretion rates with the new values, in order to look for accretion variability and optical variability in general. Several objects display significant variations in their accretion rates, which can be confirmed in two cases by optical spectroscopy:
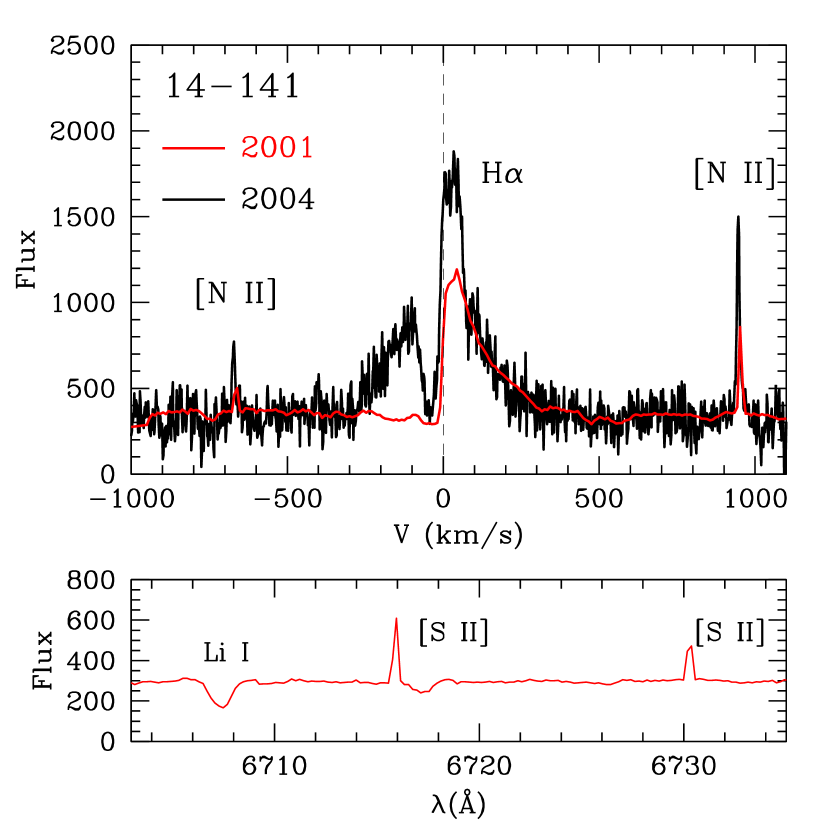
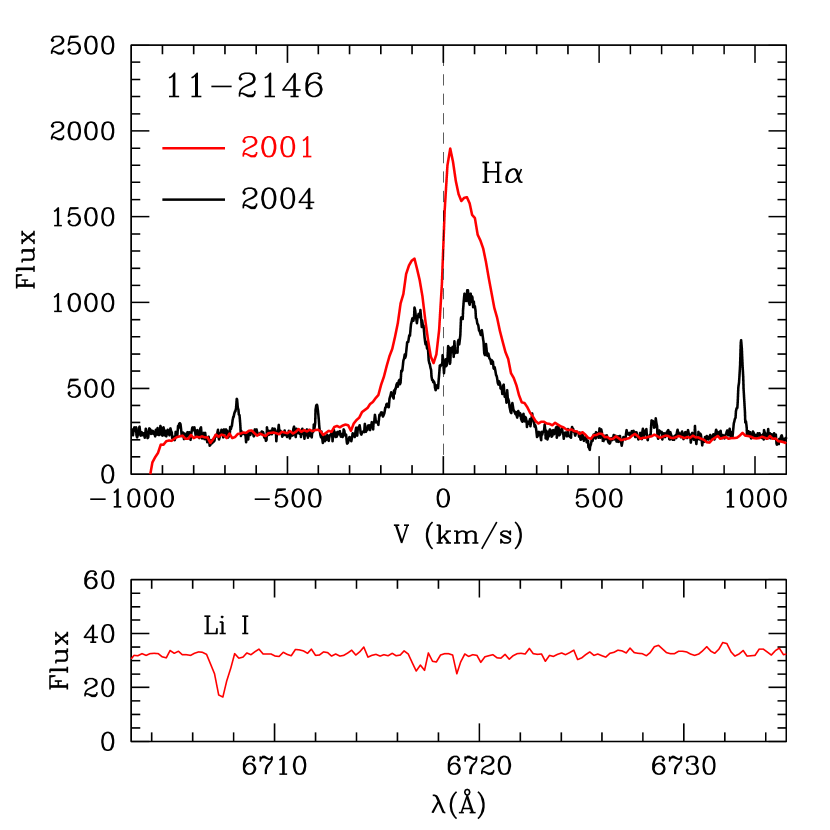
The CTTS 11-2146 shows now an accretion rate Ṁ 10-8 M⊙ yr-1, more than one order of magnitude below the one measured previously (Ṁ1.710-7 M⊙ yr-1). The variability of the object, and maybe the presence of a nearby (2”) accreting star, could have affected our less sensitive U band measurements at the FLWO, but available high-resolution spectra taken with HIRES in 2001 (for details about the HIRES data, see Sicilia-Aguilar et al. 2008a) and Hectochelle in 2004 (Sicilia-Aguilar et al. 2006b) are in agreement with Ṁ variations (Figure 5). The spectroscopic data reveals changes in the emission line profile as well as in the blueshifted absorption, associated to variable accretion plus wind.
The star 14-141 appears to have suffered an increase in its accretion rate, compared to our previous observations, where it was not detected. The comparison of HIRES 2001 data with Hectochelle spectra taken in 2004 confirms a very strong H variability, with remarkable changes in the line profile (Figure 5). The H profile in 2001 was dominated by a shock, being that of a Herbig Haro object (also confirmed by the presence of forbidden [N II] and [S II] emission; Hartigan et al. 1987). By 2004, the signs of shock are much weaker, and the profile appears to be typical for an accreting CTTS, with a blueshifted absorption indicative of a wind/outflow.
Although we do not have multiepoch high-resolution spectroscopy for the rest of the objects, several other stars are candidates for strong optical variability maybe related to accretion variations: 13-1238, 13-236, 13-1250, 53-1762, 21-1762, 11-2031, and 82-272 (see Table 5). These objects are good candidates to look for EX-ors and explore the typical variability in accreting solar-type stars. In addition, we find a TO with narrow H in 2004, and evidence of accretion (0.1110-8 M⊙ yr-1) in 2007, 72-875. The star is probably a single-lined spectroscopic binary, so episodic accretion may be a possibility. Although a few TO display accretion-related variability (13-1250, 21-1762, 72-875), we must stress that the most remarkable cases of Ṁ variability correspond to stars with the most flared and most massive disks (13-277) and objects associated to the younger (1 Myr) part of the cluster (11-2146, 14-141).
Finally, we must mention that several objects are consistent with type III variability, displaying changes in the extinction larger than expected from the typical errors. While U and VRI were not simultaneous in our FLWO survey, the three bands VRI were taken within 30 min to 1 hour difference, so the AV estimates are as robust as the AV derived from LAICA observations. Comparing the AV values in Sicilia-Aguilar et al. (2004, 2005b) with the LAICA ones, we find several type III variability candidates: 14-287, 11-581, 13-1048, 11-1067, 82-272, 12-1955, 12-595, 21-840, 21-230, 21-1692, 21-763, 21-1762, and 11-2146 (see Table 6). Among these, 14-287, 13-1048, 82-272, 12-595, 21-840, and 11-2146 have circumstellar disks that could be responsible for the extinction variations. Therefore, the variability of 11-2146 could be a combination of type II and type III variability. The stars 13-1048 (M0), 82-272 (G9, SB2 with two similar-mass accreting components), and 12-595 (K7) have such dramatic AV changes that might be considered as good candidates for UX-or variables. In the case of 12-595, the anomalous optical colors (with a too blue V-I color for a K7 star, responsible for the anomalous age derived from the isochrones) are consistent with a nearly edge-on disk where scattering is an important contributor to the measured luminosity.
4 Summary and conclusions
We present new optical (UVRI) photometry for the Tr 37 and NGC 7160 clusters in the Cep OB2 region. The data allow us to constrain the presence of accretion and accretion rates in more than 60 T Tauri stars with evolved disks, including 20 TO with zero or very small near-IR excess and presumably, inner holes and/or coagulated/settled inner disks. We study the dependence of the accretion rate on the disk structure (using the SED slope, , as an indicator of the structure of the disk) finding no strong correlation between at different wavelengths and the accretion rate. In fact, although we do not find any TO with a large (10M⊙ yr-1) accretion rate and the most flared disks have typically the largest accretion rates, strong accretors are rare in regions as old as Tr 37, and we do not see any statistically significant difference between the accretion rates of TO and normal CTTS disks. This result is in contrast with the observations of Taurus (Najita et al. 2007), which reported that accretion rates for TO are systematically biased towards lower values of Ṁ, with accretion rates about one order of magnitude lower than the typical CTTS accretion rates for a similar disk mass. We must stress that the accretion rates of TO in Taurus are similar to those of TO in Cep OB2, with the difference being that CTTS in Tr 37 have typical accretion rates about one order of magnitude lower than Taurus CTTS. Nevertheless, about half of the TO do not show any evidence of accretion, which suggests that the TO class includes several different types of objects and physical processes.
The formation of Jovian planets is expected to cause inner holes and reduce the accretion rate onto the star compared to normal CTTS disks (Lubow & D’Angelo 2006; Najita et al. 2007). On the other hand, photoevaporation by X-ray, EUV, and FUV photons predicts in general a smaller fraction of TO (especially, a much lower fraction of accreting TO) and the opening of a hole would happen only when the accretion rate drops below a certain limit (10-9-10M⊙ yr-1; Alexander et al. 2006b), which also differs from our observations. Nevertheless, the efficiency of photoevaporation may be reduced if the disk flaring is low, as is the general case in Cep OB2. New models suggest larger lifetimes for photoevaporated TO (1 Myr; Gorti et al. 2009), but predict a short lifetime of accretion once the hole has been opened. Other physical processes, like strong coagulation of the dust, may also result in optically thin inner disks with relatively normal accretion rates.
Given the different timescales for the onset of the various disk clearing mechanisms and the expected lifetimes of each type of TO, it is not evident that the TO in all regions are physically the same type of objects. The fact that physically different types of TO may dominate at different ages has been recently suggested from a theoretical point of view (Alexander & Armitage 2009). Their models suggest that accreting TO are expected to contain planets, while most non-accreting TO should have been produced by photoevaporation. They also claim at at young ages (2 Myr, similar to Taurus), TO will be dominated by planet formation, while at older stages (6 Myr), photoevaporation should be the main responsible for TO. Here we find that in an intermediate-aged cluster like Tr 37, the similarity of the accretion rates of CTTS and TO are consistent with most of the accreting TO being related to strong grain coagulation and settling. In the case of the TO that do not show any evidence of accretion, other mechanisms, like the presence of companions (stellar/substellar), giant planet formation, and/or photoevaporation, may be responsible for their inner holes. The fact that the fraction of non-accreting TO in Tr 37 is higher(50%) than in younger regions like Orion (30%; Fang et al. 2009) would also be in agreement with photoevaporation becoming more efficient at older ages (Alexander & Armitage 2009).
Finally, we explore stellar variability with our very limited two-epoch UVRI observations, finding that 10% of the stars show magnitude variations with V0.5 mag, and 65% have V0.1 mag. Several cases are compatible with type II variability (or increased accretion episodes, as in EX-or objects), and many others show important variations in their extinction, suggesting type III or UX-or-like variations, sometimes added to a variable accretion. The relatively large number of type II variables found with data from only two epochs suggests that accretion variations are very common among young stars. Although the most remarkable accretion variations occur in the younger stars with more massive disks, we also observe accretion variability in some TO. Large variations in the accretion rate could be an important mechanism to produce crystalline silicates as those found in the Solar System (Ábrahám et al. 2009).
Acknowledgments: We want to thank U. Gorti for the insight and discussion about photoevaporation, especially for the cases of evolved disks, and M. Fang for providing the accretion data in the Orion suburbs. We are also indebted to C. Mordasini and H. Klahr for the discussion about the evolution of disks after planet formation, and the anonymous referee for a detailed review of our paper that helped clarifying this work. We are also grateful to B. Braunecker and F. Hormuth for their help at the 70 cm Königstuhl telescope, as well as the service mode observers in Calar Alto, S. Pedraz and J. Aceituno. We finally thank L. Hillenbrand for providing the HIRES spectra of the objects 11-2146 and 14-141. A.S-A. acknowledges support from the Deutsche Forschungsgemeinschaft, DFG, grant number SI 1486/1-1. Based on observations collected at the Centro Astronómico Hispano Alemán (CAHA) at Calar Alto, operated jointly by the Max-Planck Institut für Astronomie and the Instituto de Astrofísica de Andalucía (CSIC). This work makes use of data products from the Two Micron All Sky Survey, which is a joint project of the University of Massachusetts and the Infrared Processing and Analysis Center/California Institute of Technology, funded by the National Aeronautics and Space Administration and the National Science Foundation.
References
- Ábrahám et al. (2009) Ábrahám, P., Juhász, A., Dullemond, C.P., Kóspal, A., van Boekel, R., Henning, Th., Moór, A., Mosoni, L., Sicilia-Aguilar, A., Sipos, N., 2009, Nature 459, 224
- Adams et al. (1987) Adams, F., Lada, C., Shu, F., 1987, ApJ, 312, 788
- Alencar et al. (2001) Alencar, S., Johns-Krull, C., Basri, G., 2001, AJ 122, 3335
- Alencar & Batalha (2002) Alencar, S., Batalha, C., 2002, ApJ571, 378
- Alexander et al. (2006a) Alexander, R., Clarke, C., Pringle, J, 2006a MNRAS, 369, 216
- Alexander et al. (2006b) Alexander, R., Clarke, C., Pringle, J, 2006b MNRAS, 369, 229
- Alexander & Armitage (2009) Alexander, R., & Armitage, P., ApJ in press
- Andrews & Williams (2007) Andrews, S.,& Williams, J., 2007, ApJ, 671, 1800
- Apai et al. (2005) Apai, D.; Pascucci, I.; Bouwman, J.; Natta, A.; Henning, Th.; Dullemond, C. P., 2005, Sci, 310, 834
- Bertout (1989) Bertout, C., 1989, ARAA, 27, 351
- Birnstiel et al. (2009) Birnstiel, T., Dullemond, C., Brauer, F., 2009, A&A in press
- Bouchi et al. (2009) Bouchy, F., Mayor, M., et al., 2009 A&A 496, 527
- Bouwman et al. (2006) Bouwman, J.; Lawson, W. A.; Dominik, C.; Feigelson, E. D.; Henning, Th.; Tielens, A. G. G. M.; Waters, L. B. F. M., 2006, ApJ, 653, 57
- Boss (1997) Boss, A. P. 1997, Science, 276, 1836
- Brauer et al. (2008) Brauer, F., Dullemond, C. P., & Henning, T. 2008, A&A, 480, 859
- Briceño et al. (2001) Briceño, C., et al. 2001, Science, 291, 93
- Calvet et al. (2004) Calvet, N., Muzerolle, J., Briceño, C., Hernández, J., Hartmann, L., Saucedo, J. L., & Gordon, K. D. 2004, AJ, 128, 1294
- Cardelli et al. (1989) Cardelli, J., Clayton, G., Mathis, J., 1989, ApJ, 345, 245
- Carmona et al. (2007) Carmona, A., van den Ancker, M., Henning, Th., Goto, M., Fedele, D., Stecklum, B., 2007, A&A 476, 853
- Carmona et al. (2008) Carmona, A., van den Ancker, M., Henning, Th., Pavlyuchenkov, Y., Dullemond, C.,
- Carr et al. (2001) Carr, J., Mathieu, R., Najita, J., 2001, ApJ, 551, 454
- Ciesla (2007) Ciesla, F., 2007, ApJL 654, 159
- Clarke et al. (2001) Clarke, C., Gendrin, A., & Sotomayor, M., 2001, MNRAS 328, 485
- Clarke & Pringle (2006) Clarke, C., & Pringle, J., 2006, MNRAS, 370, L10
- Contreras et al. (2002) Contreras, M.E., Sicilia-Aguilar, A., Muzerolle, J., Calvet, N., Berlind, P., Hartmann, L. 2002, AJ, 124, 1585
- Currie et al. (2009) Currie, T., Lada, C., Plavchan, P., Robitaille, Th., Irwin, J., Kenyon, S., 2009, ApJ698, 1
- Dahm (2008) Dahm, S. E. 2008, AJ, 136, 521
- D’Alessio et al. (2005) D’Alessio, P., Hartmann, L., Calvet, N., Franco-Hernández, R., and 10 more coauthors, 2005, ApJ, 621, 461
- De Graeve (1983) De Graeve, E., 1983, Vatican Obs. Publ., 2, 31
- Dullemond & Dominik (2005) Dullemond, C., & Dominik, C., 2005, AA, 434, 975
- Dullemond et al. (2006) Dullemond, C., Natta, A., Testi, L., 2006, ApJL 645, L69
- Edgar et al. (2007) Edgar, R., Quillen, A., Park, J., 2007, MNRAS, 381, 1280
- Eiroa et al. (2002) Eiroa, C., Oudmaijer, R., et al., 2002, A&A 384, 1038
- Ercolano et al. (2009a) Ercolano, B., Clarke, C., Robitaille, T., 2009a, MNRAS 394, L141
- Ercolano et al. (2009b) Ercolano, B., Clarke, C., Drake, J., 2009b, ApJ 669, 1639
- Fang et al. (2009) Fang, M.; van Boekel, R.; Wang, W.; Carmona, A.; Sicilia-Aguilar, A.; Henning, Th., 2009, A&A in press
- Fernie (1983) Fernie, J., 1983, PASP, 95, 782
- Forrest et al. (2004) Forrest, W.J., Sargent, B., Furlan, E., & 18 more coauthors, 2004, ApJS, 154, 443
- Gorti & Hollenbach (2009) Gorti, U., & Hollenbach, D., 2009, ApJ690, 1539
- Gorti et al. (2009) Gorti, U., Dullemond, C., & Hollenbach, D., 2009, ApJin press
- Goto et al. (2006) Goto, M., Usuda, T., Dullemond, C., Henning, T., Linz, H., Stecklum, B., Suto, H., 2006, ApJ 652, 758
- Goto et al. (2008) Goto, M., Thi, W.F., Bouwman, J., Waters, L.B.F.M., 2008, A&A 477, 839
- Gullbring et al. (1998) Gullbring, E., Hartmann, L., Briceño, C., Calvet, N., 1998, ApJ 492, 323
- Haisch et al. (2001) Haisch, K., Lada, E., & Lada, C., 2001, ApJ, 553, 153
- Hartigan et al. (1987) Hartigan, P., Raymond, J., Hartmann, L., 1987, ApJ 316, 323
- Hartmann (1998) Hartmann, L.: Accretion Processes in Star Formation, Cambridge University Press, 1998.
- Hartmann & Kenyon (1987) Hartmann, L., & Kenyon, S., 1987, ApJ 322, 393
- Hartmann & Kenyon (1996) Hartmann, L., & Kenyon, S., 1996, ARA&A, 34, 207
- Hartmann et al. (1998) Hartmann, L., Calvet, N., Gullbring, E. & D’Alessio, P, 1998, ApJ, 495, 385
- Hayashi et al. (1985) Hayashi, C., Nakazawa, K., & Nakagawa, Y. 1985, in Protostars and Planets II, eds. D. Black & M. Matthews(Tucson: University of Arizona Press), 1100
- Herczeg & Hillenbrand (2008) Herczeg, G. J., & Hillenbrand, L. A. 2008, ApJ, 681, 594
- Hernández et al. (2007) Hernández, J., Hartmann, L., Megeath, S.T.,et al., 2007, ApJ, 662, 1067
- Hollenbach et al. (2000) Hollenbach, D., Yorke, H., Johnstone, D., 2000, Protostars and Planets IV, Univ. Arizona Press, p. 401
- Ireland & Kraus (2008) Ireland, M., & Kraus, A., 2008, ApJ, 678, 59
- Isella et al. (2009) Isella, A., Carpenter, J., & Sargent, A., 2009, ApJ 701, 260
- Johansen & Klahr (2005) Johansen, A., & Klahr, H., 2005, ApJ, 634, 1353
- Johansen et al. (2007) Johansen, A., Oishi, J., Mac Low, M.M., Klahr, H., Henning, Th., Youdin, A., 2007, Nature 448, 1022
- Kenyon & Hartmann (1987) Kenyon, S.J. & Hartmann, L., 1987, ApJ, 323, 714
- Kenyon & Hartmann (1995) Kenyon, S.J. & Hartmann, L., 1995, ApJS , 101, 117
- Koenigl (1991) Königl, A., ApJ, 370, L39
- Lada et al. (2006) Lada, C., Muench, A., et al., 2006, AJ, 131, 1547
- Lawson et al. (2004) Lawson, W., Lyo, A., Muzerolle, J., 2004, MNRAS, 329, 29
- Lubow & D’Angelo (2006) Lubow, S.H., & D’Angelo, G., 2006, ApJ, 641, 526
- Mathieu et al. (1991) Mathieu, R., Adams, F., Latham,D., 1991, AJ, 101, 2184;
- McCabe et al. (2006) McCabe, C., Ghez, A., Prato, L, Duchene, G., Fisher, R., Telesco, C., 2006, ApJ 636, 932
- Megeath et al. (2005) Megeath, S. T.; Hartmann, L.; Luhman, K. L.; Fazio, G. G., 2005, ApJ, 634, 113
- Mordasini et al. (2009) Mordasini, C., Alibert, Y., Benz, W., Naef, D., A&A 501, 1161
- Muzerolle et al. (2000) Muzerolle, J., Calvet, N., Briceño, C., Hartmann, L. & Hillenbrand, L., 2000, ApJ, 535, L47
- Muzerolle et al. (2003) Muzerolle, J., Hillenbrand, L., Calvet, N., Briceño, C.; Hartmann, L., 2003, ApJ, 592, 266
- Muzerolle et al. (2009) Muzerolle, J., Allen, L., Megeath, S.T., Hernández, J., Gutermuth, R., 2009, ApJ in press, ArXive 0911.2704
- Najita et al. (1996) Najita, J., Carr, J., Glassgold, A., Shu, F., Tokunaga, A., 1996, ApJ, 462, 919
- Najita et al. (2003) Najita, J., Carr, J., Mathieu, R., 2003, ApJ, 589, 931
- Najita et al. (2007) Najita, J., Strom, S., Muzerolle, J., 2007, MNRAS 368, 379
- Natta et al. (2004) Natta, A., Testi, L., Neri, R., Shepherd, D., Wilner, D., 2004, A&A, 416, 179
- Pascucci et al. (2005) Pascucci, I., Apai, D., Henning. T., Sterzik, M., Dullemond, C., Bouwman, C., 2005, Mem.S.A.It., 76, 315
- Pascucci et al. (2006) Pascucci, I. et al. 2006, ApJ, 651, 1177
- Pascucci et al. (2009) Pascucci, I., Apai, D., Luhman, K., Henning, Th., Bouwman, J., Lahuis, F., Natta, A., 2009, ApJ, 696, 143
- Pascucci & Sterzik (2009) Pascucci, I., Sterzik, M., 2009, ApJ, 702, 724
- Patel et al. (1998) Patel, N.A., Goldsmith, P.F., Heyer, M.H. & Snell, R.L., 1998, ApJ , 507, 241
- Pott et al. (2009) Pott, J.U., Perrin, M., Furlan, E., Ghez, A., Herbst, T., Metchev, S., 2009, ApJ in press, arXive 0912.0846
- Quanz et al. (2007) Quanz, S., Henning, Th., Bouwman, J., Van Boekel, R., Juhasz, A., Linz, H., Pontoppidan, K., Lahuis, F., 2007, ApJ, 668, 359
- Quillen et al. (2004) Quillen, A., Blackman, E., Frank, A., Varniere, P., 2004, ApJ, 612, L137
- Rettig et al. (2005) Rettig, T., Brittain, S., Gibb, E., Simon, T., Kulesa, C., 2005, ApJ, 626, 245
- Rice et al. (2006) Rice, W., Armitage, P., Wood, K., Lodato, G., 2006, MNRAS 373, 1619
- Rodmann et al. (2006) Rodmann, J.; Henning, Th.; Chandler, C. J.; Mundy, L. G.; Wilner, D. J., 2006, A&A, 446, 211
- Salyk et al. (2009) Salyk, C., Blake, G., Boogert, A., Brown, J., 2009, ApJ, 669, 330
- Schräpler & Henning (2004) Schräpler, R. & Henning, Th., 2004, ApJ, 614, 960
- Setiawan et al. (2008) Setiawan, J.; Henning, Th.; Launhardt, R.; Müller, A.; Weise, P.; Kürster, M., 2008, Nature, 451, 38
- Sicilia-Aguilar et al. (2005) Sicilia-Aguilar, A., Hartmann, L., Szentgyorgyi, A., Roll, J., Conroy, M., Calvet, N., Fabricant, D., & Hernández, J., 2005a, AJ, 129, 363
- Sicilia-Aguilar et al. (2005) Sicilia-Aguilar, A., Hartmann, L., Hernández, J., Briceño, C., Calvet, N., 2005b, AJ, 130, 188
- Sicilia-Aguilar et al. (2006) Sicilia-Aguilar, A., Hartmann, L., Calvet, N., Megeath, S.T., Muzerolle, J., Allen, L., D’Alessio, P., Merín, B., Stauffer, J., Young, E., Lada, C., 2006a, ApJ 638, 897
- Sicilia-Aguilar et al. (2006) Sicilia-Aguilar, A., Hartmann, L., Fürész, G., Henning, Th., Dullemond, C., Brandner, W., 2006b, AJ 132, 2135
- Sicilia-Aguilar et al. (2008a) Sicilia-Aguilar, A., et al., 2008a, ApJ 673, 382
- Sicilia-Aguilar et al. (2008b) Sicilia-Aguilar, A.; Henning, Th.; Juhász, A.; Bouwman, J.; Garmire, G.; Garmire, A., 2008b, ApJ, 687, 1145
- Sicilia-Aguilar et al. (2009) Sicilia-Aguilar, A., Bouwman, J., Juhász, A., et al., 2009, ApJ, 701, 1188
- Siess et al. (2000) Siess, L., Dufour, E. & Forestini, M. 2000 A&A , 358, 593
- Strom et al. (1989) Strom, K., Wilkin, F., Strom, S., & Seaman, R., 1989, AJ, 98, 1444
- Van Boekel et al. (2003) Van Boekel, R., Waters, L., Dominik, C., Bouwman, J., de Koter, A., Dullemond, C., Paresce, F., 2003, AA, 400, L21
- White & Basri (2003) White, R., & Basri, G., 2003, ApJ, 582, 1109

| Date | Instrument/Telescope | Pointing and Filters | Seeing |
|---|---|---|---|
| 2007 June 09 | LAICA/3.5 m | Tr 37-1(UVRI) | 1.2-1.3” |
| 2007 June 10 | LAICA/3.5 m | Tr 37-2(UVRI), Tr 37-3(U) | 0.8-1.0” |
| 2007 June 11 | LAICA/3.5 m | Tr 37-3(VRI), Tr 37-4(UVRI) | 0.6-0.8” |
| 2007 October 5 | 70 cm KING | NGC 7160 (UVRI) | 2” |
Note. — Summary of the UVRI observations. Pointing 2 and U band of pointing 3 were taken within less than 2 hours time difference. VRI data for pointing 3 and pointing 4 were also taken within less than 2 hours difference.
| Name | 2MASS ID | Sp. Type | Pointing | U | V | RJ | IJ | AV | Notes |
|---|---|---|---|---|---|---|---|---|---|
| Tr 37 | |||||||||
| 72-489 | 21351481+5721232 | K5.0 | 4c | 20.8260.081 | 18.1590.006 | 16.7900.022 | 15.4970.004 | 1.760.26 | n(2”)a |
| 72-1427 | 21351627+5728222 | M1.0 | 3c,4c | 20.1760.046 | 18.2720.007 | 16.6180.022 | 15.1610.004 | 1.140.16 | n(4”)a |
| 81-541 | 21351745+5748223 | K5.5 | 4b* | 20.5110.062 | 17.6050.015 | 16.0860.011 | 14.5980.005 | 2.250.29 | |
| 72-875 | 21354975+5724041 | M0.5 | 4c | 20.8140.075 | 18.2450.007 | 16.5900.022 | 15.0060.003 | 1.510.27 | SB1:,n(2.5”) |
| 21362507 | 21362507+5727502 | M0.0 | 4c | 21.8330.188 | 20.4260.037 | 18.5780.025 | — | 2.280.25 | var, SB1 |
| 14-141 | 21364941+5731220 | K6.0 | 2b | 19.2190.083 | 16.0360.002 | 14.5080.030 | 13.0940.003 | 2.040.24 | |
| 11-2146 | 21365767+5727331 | K6.0 | 4c | 18.6840.014 | 16.6620.004 | 15.2110.022 | 13.9990.002 | 1.620.13 | n(2”+2”)a |
| 11-1209 | 21365850+5723257 | K6.0 | 4c | 17.7550.010 | 15.3400.003 | 14.0400.022 | 13.0940.002 | 0.920.09 | n(4”) |
| 11-1659 | 21370088+5725224 | K5.0 | 4c | 20.1550.042 | 17.0460.004 | 15.6250.022 | 14.5340.003 | 1.720.09 | |
| 11-1499 | 21370140+5724458 | M1.5 | 4c | 21.0620.094 | 17.8540.005 | 16.1850.022 | 14.4240.003 | 1.260.40 | var,n(5”) |
| 11-2322 | 21370191+5728222 | M1.0 | 4c | 18.8580.016 | — | 15.3570.022 | 13.9530.002 | 1.300.23 | var,n(2”)a |
| 14-222 | 21370607+5732015 | K7.0 | 1a | 18.9260.059 | 15.8010.004 | 14.4940.011 | 13.2570.003 | 0.900.28 | |
| ” | 21370607+5732015 | K7.0 | 2b | 18.8280.082 | 15.8470.002 | 14.4040.030 | 13.1400.003 | 1.330.20 | |
| 14-287 | 21370649+5732316 | M0.0 | 1a | 18.8580.056 | 17.0950.003 | 15.7800.004 | 14.3850.004 | 1.110.25 | var |
| ” | 21370649+5732316 | M0.0 | 2b | 19.1180.082 | 17.2580.008 | 15.7630.030 | 14.3610.003 | 1.110.28 | var |
| 11-2037 | 21370703+5727007 | K4.5 | 3c | 18.8710.010 | — | — | 13.6870.002 | 1.630.45 | |
| 11-1067 | 21370843+5722484 | M0.5 | 3c | 21.6350.083 | 17.8600.017 | 16.3610.012 | — | 0.640.12 | |
| 14-11 | 21371031+5730189 | M1.5 | 4a | 20.8990.259 | 17.6530.004 | 16.1700.005 | 14.2690.003 | 0.850.72 | |
| 14-125 | 21371054+5731124 | K5.0 | 2b | 19.1630.082 | 16.6160.003 | 15.2240.030 | 14.0410.003 | 1.720.16 | |
| ” | 21371054+5731124 | K5.0 | 3c,2b | 19.8960.019 | 16.6160.003 | 15.2240.030 | 14.0410.003 | 1.720.16 | |
| 11-1513 | 21371183+5724486 | K7.5 | 3c | 20.9880.047 | 17.0680.016 | 15.5950.012 | 14.1910.002 | 1.310.27 | |
| 11-2131 | 21371215+5727262 | K6.5 | 3c | 20.8500.041 | — | 15.8530.012 | 14.6050.003 | 1.870.23 | var |
| 11-2031 | 21371591+5726591 | K2.0 | 3c | 18.3280.006 | — | 14.2400.012 | 13.3450.002 | 1.530.09 | |
| 14-103 | 21371976+5731043 | K7.0 | 1a | 21.8560.623 | 18.1450.005 | 16.7690.006 | 15.3500.007 | 1.280.38 | |
| 14-197 | 21372368+5731538 | K5.5 | 1a | 19.5440.085 | 16.8640.003 | 15.5830.011 | 14.4520.004 | 1.200.19 | SB1: |
| 11-581 | 21372828+5720326 | G9.0 | 3c | 20.5080.030 | 16.6970.016 | 15.3160.012 | 14.1590.002 | 3.190.09 | |
| 14-1017 | 21372894+5736042 | M0.0 | 3c,1a | 20.7190.039 | 18.3990.005 | 16.8740.006 | 15.2260.006 | 1.440.45 | |
| ” | 21372894+5736042 | M0.0 | 1a | 21.0510.296 | 18.3990.005 | 16.8740.006 | 15.2260.006 | 1.440.45 | |
| 14-335 | 21372915+5732534 | K6.5 | 1a | 21.0540.313 | 17.5420.004 | 16.1000.005 | 14.6570.005 | 1.660.33 | n(4”) |
| 83-343 | 21373696+5755149 | M0.5 | 2b | 21.0400.123 | 17.0560.009 | 15.4550.008 | 14.0770.003 | 1.160.12 | n(5”) |
| 14-183 | 21373849+5731408 | K6.0 | 1a | 19.8380.105 | 17.1120.003 | 15.6480.012 | 14.4310.004 | 1.670.10 | n(4”), SB1: |
| 14-2148 | 21374184+5740400 | M1.5 | 1a | 20.9930.304 | 18.2600.005 | 16.7310.006 | 15.1620.006 | 0.670.35 | |
| 11-1384 | 21374486+5724135 | K6.5 | 3c | 20.6300.035 | 17.0610.016 | 15.6800.012 | 14.3880.002 | 1.330.26 | n(5”+5”) |
| 13-924 | 21375018+5733404 | K5.0 | 1a | 20.5820.197 | 17.1250.003 | 15.7880.004 | 14.4720.004 | 1.690.30 | |
| 12-1984 | 21375022+5725487 | K6.0 | 3c | 20.0080.020 | — | 15.5610.012 | 14.3720.002 | 0.880.05 | |
| 12-2519 | 21375107+5727502 | K5.5 | 3c | 21.2660.057 | — | 15.9580.012 | 14.7630.003 | 1.930.17 | |
| 12-1968 | 21375487+5726424 | K6.0 | 3c | 20.2570.025 | — | 15.5560.012 | 14.3960.003 | 1.690.26 | SB2: |
| 12-1422 | 21375756+5724197 | M0.0 | 3c | 22.2150.139 | 18.9070.019 | 17.3120.013 | 15.6210.004 | 1.680.43 | |
| 12-1091 | 21375762+5722476 | K2.0 | 3c | 19.7100.015 | 16.2740.016 | 14.9840.012 | 13.9840.002 | 2.330.12 | |
| 13-269 | 21375812+5731199 | K6.5 | 1a | 19.6660.089 | 16.6580.005 | 15.3320.004 | 13.9880.004 | 1.220.35 | |
| 12-583 | 21375827+5720354 | M0.0 | 3c | 21.2410.059 | 17.6500.016 | 16.0930.012 | 14.4720.003 | 1.500.40 | n(5”) |
| 13-1238 | 21375926+5736162 | M1.0 | 1a | 19.2590.070 | 17.9020.004 | 16.3370.006 | 14.6010.004 | 1.150.49 | |
| 12-2373 | 21380058+5728253 | M1.0 | 3c | 21.7760.092 | — | 16.2140.012 | 14.7590.003 | 1.490.18 | var |
| 82-272 | 21380350+5741349 | G9.0 | 1a | 19.4140.080 | 16.6160.005 | 15.2660.011 | 14.0190.004 | 3.010.06 | var, SB2 |
| 12-1081 | 21380593+5722438 | M0.5 | 3c | 21.9890.114 | 18.3080.017 | 16.8360.012 | 15.4380.004 | 0.790.28 | |
| 13-1161 | 21380772+5735532 | M0.0 | 1a | 20.8450.241 | 17.9740.004 | 16.5150.006 | 15.0910.004 | 1.020.31 | |
| 12-1613 | 21380848+5725118 | M1.0 | 3c | 22.1290.123 | 18.3260.017 | 16.7270.012 | 15.1850.004 | 1.060.28 | |
| 13-1426 | 21380856+5737076 | M0.0 | 1a | 19.8580.103 | 19.1740.009 | 17.5990.013 | 15.7480.005 | 1.780.60 | |
| 13-669 | 21380928+5733262 | K1.0 | 1a | 18.2310.046 | 15.8340.004 | 14.6300.011 | 13.5070.004 | 2.170.12 | |
| 13-350 | 21381384+5731414 | M1.0 | 1a | 21.0780.304 | 18.4630.006 | 16.8800.014 | 15.4700.005 | 0.890.17 | n(3”) |
| 54-1781 | 21381612+5719357 | M1.0 | 3c | 21.0260.045 | 18.5640.018 | 16.9220.012 | 15.1200.003 | 1.440.47 | |
| 13-1877 | 21381703+5739265 | K7.0 | 1a | 18.8830.057 | 17.1890.004 | 15.6200.004 | 14.2220.004 | 1.840.16 | |
| 13-277 | 21381731+5731220 | G8.0 | 1a | 15.0160.040 | 13.1460.004 | 12.0900.011 | 11.1170.003 | 1.950.09 | GM Cep, var, SB1: |
| 12-1009 | 21381750+5722308 | K5.5 | 3c | 20.0880.023 | 16.6890.016 | 15.3730.012 | 14.2350.003 | 1.310.18 | var,n(4”+4”) |
| 13-819 | 21382596+5734093 | K5.5 | 1a | 19.1280.065 | 16.4230.003 | 15.1730.004 | 14.0080.004 | 1.140.25 | |
| 12-1955 | 21382692+5726385 | K6.5 | 3c | 21.0150.046 | 17.3880.009 | 16.0200.012 | — | 1.040.09 | |
| 13-236 | 21382742+5731081 | K2.0 | 1a | 17.6650.042 | 15.5460.004 | 14.4310.011 | 13.4120.004 | 1.630.13 | |
| 13-157 | 21382804+5730464 | K5.5 | 3c | 18.5880.008 | 16.7680.016 | 15.3200.012 | 14.0120.004 | 1.860.20 | var,n(4”) |
| 13-232 | 21382834+5731072 | M0.0 | 1a | 21.1180.310 | 17.4280.004 | 16.0870.006 | 14.6570.004 | 0.680.44 | |
| 21383216 | 21383216+5726359 | M0.0 | 3c | 21.5980.076 | 19.9110.015 | 18.2020.016 | 16.2870.007 | 2.240.52 | |
| 13-566 | 21383481+5732500 | K5.5 | 1a | 20.9770.279 | 18.0300.004 | 16.5550.006 | 14.9590.005 | 2.220.43 | |
| 13-1709 | 21384038+5738374 | K5.5 | 1a | 20.8320.251 | 16.8780.003 | 15.5910.011 | 14.3810.003 | 1.290.26 | |
| 54-1613 | 21384332+5718359 | K5.0 | 3c | 20.0140.020 | — | 15.1950.012 | 14.2770.002 | 1.060.09 | |
| 21384350 | 21384350+5727270 | M2.0 | 3c | 24.0930.775 | 19.9180.013 | — | — | 1.670.45 | var |
| 54-1547 | 21384446+5718091 | K5.5 | 3c | 19.1680.010 | 16.5710.007 | 15.3210.012 | 14.3960.003 | 0.910.06 | |
| ” | 21384446+5718091 | K5.5 | 4d | 18.5390.027 | 16.5710.007 | 15.2990.011 | 14.4370.007 | 0.910.08 | |
| 12-2363 | 21384544+5728230 | M0.5 | 3c | 21.4200.077 | 17.5520.009 | — | — | 1.880.45 | n(2”), SB1: |
| 12-595 | 21384622+5720380 | K7.0 | 3c | 22.0470.118 | 19.5120.011 | 17.4970.013 | 16.1440.006 | 3.120.36 | var,n(4”) |
| 12-1423 | 21384707+5724207 | K7.0 | 3c | 20.8140.039 | 17.0420.016 | 15.6010.012 | 14.3820.002 | 1.280.14 | |
| 12-1010 | 21385029+5722283 | M2.0 | 3c | 20.8960.039 | 18.5540.009 | 17.0430.012 | 15.4630.004 | 0.410.37 | |
| 12-2098 | 21385253+5727184 | M2.5 | 3c | 22.1780.152 | 18.7750.010 | — | — | 0.980.45 | |
| 91-506 | 21385807+5743343 | K6.5 | 4a* | 19.7770.063 | 17.1410.013 | 15.7320.017 | 14.5460.004 | 1.320.15 | |
| 12-1617 | 21390468+5725128 | M1.0 | 4d | 20.8310.089 | 18.0390.008 | — | — | 1.600.45 | |
| 21-840 | 21391012+5722323 | M1.0 | 4d | 21.2010.127 | 18.8520.011 | — | 15.6470.008 | 1.450.04 | |
| 13-1048 | 21391088+5735181 | M0.0 | 2a | 19.7540.039 | 17.0810.012 | — | 14.5230.003 | 0.710.03 | var |
| 13-1250 | 21391213+5736164 | K4.5 | 2a | 18.4030.018 | 15.9560.012 | — | 13.6680.003 | 1.420.03 | |
| 21-563 | 21391288+5721088 | M1.0 | 4d | 20.8070.085 | 17.5010.008 | — | — | 1.250.45 | |
| 24-542 | 21392957+5733417 | K4.0 | 2a | 18.5480.018 | 15.9860.012 | 14.6750.032 | 13.7180.003 | 1.530.14 | |
| 24-515 | 21393407+5733316 | M0.5 | 2a | 19.9080.043 | 17.9410.012 | 16.3960.032 | 15.1230.004 | 0.890.15 | |
| 21-998 | 21393480+5723277 | K5.5 | 4d | 19.7980.040 | 17.6680.008 | — | 14.9610.007 | 1.950.03 | SB1: |
| 21-33 | 21393561+5718220 | M0.0 | 4d | 20.8140.075 | 18.7230.011 | 17.1380.011 | 15.7220.008 | 1.390.18 | |
| 24-48 | 21393805+5730439 | M0.5 | 2a | 21.9720.279 | 17.9960.012 | — | — | 1.500.45 | |
| 21-230 | 21394169+5719274 | M0.5 | 4d | 21.0440.103 | 17.9220.008 | — | 15.2340.007 | 0.710.03 | |
| 21-1536 | 21394570+5726242 | M0.0 | 4d | 20.6360.078 | 19.0480.013 | — | — | 1.770.45 | |
| 52-1649 | 21394643+5705072 | K5.0 | 2d* | 20.0510.035 | 17.2640.007 | 15.9850.007 | 15.0430.006 | 1.160.04 | |
| 21-2251 | 21394754+5725210 | M2.0 | 4d | 21.1750.115 | 18.0200.008 | — | — | 1.500.45 | SB1 |
| 21-1586 | 21394793+5726427 | K7.0 | 4d | 21.5090.156 | 18.4020.009 | — | — | 1.490.45 | |
| 53-1762 | 21395029+5719177 | M0.0 | 4d | 21.3910.141 | 18.4530.009 | — | 15.6550.008 | 1.170.03 | var, SB1: |
| 21-1692 | 21400128+5727184 | M1.0 | 4d | 21.6450.170 | 18.2390.009 | — | 15.3860.007 | 0.770.03 | |
| 21-763 | 21400259+5722090 | M0.0 | 4d | 20.5110.067 | 17.4560.008 | — | 14.9500.007 | 0.610.03 | n(5”) |
| 21-895a | 21400321+5722505 | K5.0 | 4d | 18.9830.028b | 16.6400.007 | — | 14.3050.007 | 1.370.03 | n(2”)b |
| 21400451 | 21400451+5728363 | K5.0 | 2a | 18.0450.018 | 16.1650.012 | — | 13.8930.003 | 1.250.03 | n(5”+5”) |
| ” | 21400451+5728363 | K5.0 | 4d | 18.2150.024 | 16.3040.007 | — | 14.0880.007 | 1.140.03 | n(5”+5”) |
| 21-1762 | 21400924+5727393 | K5.0 | 4d | 19.7530.039 | 16.9550.007 | — | 14.5190.007 | 1.570.03 | |
| 24-1736 | 21401134+5739518 | M1.0 | 2a | 19.8860.045 | 18.7620.013 | 17.1380.032 | 15.4970.004 | 1.230.36 | |
| 24-1796 | 21401182+5740121 | K7.0 | 2a | 18.3890.018 | 17.3410.012 | 15.8970.032 | 14.8250.004 | 1.150.14 | SB2: |
| 21-2006 | 21401390+5728481 | K5.0 | 2a | 19.5640.034 | 16.9330.012 | 15.5170.032 | 14.5890.004 | 1.550.21 | |
| ” | 21401390+5728481 | K5.0 | 4d | 19.4570.033 | 16.9260.007 | 15.5170.032 | 14.7070.007 | 1.420.30 | |
| 22-2651 | 21402130+5726579 | M1.5 | 4d | 18.8250.026 | 17.8780.008 | — | 15.3750.007 | 1.670.45c | var |
| 22-1418 | 21402287+5727329 | M1.5 | 4d | 20.7990.082 | 17.8610.008 | — | — | 0.730.45 | |
| 23-405 | 21403134+5733417 | K5.0 | 2a | 19.1420.025 | 16.6100.012 | 15.2090.032 | 14.2710.003 | 1.520.19 | |
| 23-570 | 21403574+5734550 | K6.0 | 2a | 18.3910.017 | 16.7180.012 | 15.2760.032 | 14.3080.003 | 1.360.19 | |
| NGC 7160 | |||||||||
| 01-580 | 21533707+6228469 | K4.5 | — | 18.380.15 | 17.3920.042 | 15.7550.020 | 14.7370.015 | 2.460.40 |
Note. — Optical data and 2MASS IDs for the studied stars. Due to the small field overlap, some stars were observed more than once. The pointing and LAICA CCD ID (a,b,c,d) are indicated to show whether all the UVRI measurements were simultaneous (see Table 1). Two pointings are indicated (e.g. 3c+2b), when the U magnitude was observed with pointing 3c, and the VRI data comes from pointing 2. Notes: ”var” = variability (V0.5 mags) observed, ”n(x”)” = nearby star at x” projected distance, usually the photometry is not affected. If the nearby star is bright and may affect the photometry, a is added (e.g., n(2”)a). Objects that appeared merged with other stars/artifacts are excluded from this study. b 21-895b is probably not a member and not a physical companion of 21-895a because of its position in the color-magnitude diagram. c The colors of 22-2651 are probably affected by non-standard variability/anomalous extinction. Therefore, we adopt for this object the cluster average extinction.
| Name | H EW(Å) | H profile | Disk | L (L⊙) | R (R⊙) | Age (Myr) | M (M⊙) | ṀU | Ṁfin | Comments |
|---|---|---|---|---|---|---|---|---|---|---|
| Tr 37 | ||||||||||
| 72-489 | (-5.5) | — | — | 0.38 | 1.1 | 22.9 | 0.9 | 0.04 | 0.04 | |
| 72-1427 | -16,(-77) | B | TO | 0.36 | 1.5 | 3.3 | 0.5 | 0.15 | 0.15 | |
| 81-541 | -31,(-60) | B | CTTS | 1.07 | 1.9 | 3.6 | 1.0 | 0.19 | 0.19 | |
| 72-875 | (-21) | N | TO | 0.50 | 1.7 | 2.6 | 0.5 | 0.11 | 0.11 | SB1:, now accreting |
| 21362507 | -78,(-86) | B | CTTS | 0.11 | 0.8 | 26.0 | 0.6 | 0.09 | 0.09 | SB1, HR |
| 14-141 | -15,(-5) | B | CTTS | 3.79 | 3.7 | 0.8 | 0.9 | 0.62 | 2.3 | |
| 11-2146 | -28,-86,(-33) | B | CTTS | 1.37 | 2.3 | 2.5 | 1.0 | 0.99 | 0.99 | |
| 11-1209 | -6,(-4) | B | CTTS | 2.31 | 2.9 | 1.4 | 1.0 | 0.56 | 0.56 | |
| 11-1659 | (-2) | N | N | 0.91 | 1.7 | 8.3 | 1.1 | 0.02 | 0 | |
| 11-1499 | (-7) | N | N | 0.73 | 2.2 | 1.4 | 0.4 | 0.00 | 0 | |
| 11-2322 | -18,(-23) | B | CTTS | 1.37 | 2.9 | 0.7 | 0.5 | 1.6 | 1.6 | |
| 14-222 | (-5) | N: | TOe8 | 1.87 | 2.8 | 1.1 | 0.7 | -0.06 | 0.04 | |
| ” | (-5) | N: | TOe8 | 2.51 | 3.3 | 0.9 | 0.8 | 0.34 | 0.85 | |
| 14-287 | -18,(-35) | B | CTTS | 0.61 | 1.8 | 2.3 | 0.5 | 0.21 | 0.21 | |
| ” | -18,(-35) | B | CTTS | 0.79 | 2.0 | 2.0 | 0.6 | 0.46 | 0.46 | |
| 11-2037 | -43,(-50) | B | CTTS | 1.88 | 2.3 | 2.5 | 1.3 | 1.1 | 9 | HR |
| 11-1067 | (-7) | N | N | 0.28 | 1.3 | 5.4 | 0.5 | 0.00 | 0 | HR |
| 14-11 | (-5) | N | TO | 0.70 | 2.1 | 1.4 | 0.4 | -0.05 | 0 | |
| 14-125 | -14,(-13) | B | CTTS | 1.44 | 2.2 | 3.0 | 1.1 | 0.34 | 0.34 | |
| ” | -14,(-13) | B | CTTS | 1.44 | 2.2 | 3.0 | 1.1 | 0.34 | 0.34 | |
| 11-1513 | (-5) | N | N | 0.97 | 2.1 | 2.0 | 0.6 | 0.02 | 0 | |
| 11-2131 | (-10) | B | CTTS | 0.78 | 1.8 | 3.0 | 0.8 | 0.25 | 0.25 | HR |
| 11-2031 | -5(-5) | B | CTTS | 2.93 | 2.4 | 4.5 | 1.6 | 0.27 | 1 | HR |
| 14-103 | (-2) | N | N | 0.32 | 1.2 | 11.6 | 0.8 | -0.02 | 0 | |
| 14-197 | (-2) | N | TOe8 | 0.77 | 1.6 | 7.2 | 1.0 | 0.03 | 0/0.14 | SB1 |
| 11-581 | (-9) | N | N | 3.39 | 2.1 | 24.2 | 1.4 | -0.51 | 0 | G-age |
| 14-1017 | (-55) | B | CTTS | 0.41 | 1.5 | 3.5 | 0.5 | 0.29 | 1.5 | |
| ” | (-55) | B | CTTS | 0.41 | 1.5 | 3.5 | 0.5 | 0.05 | 0.5 | |
| 14-335 | (-20) | P | CTTS | 0.74 | 1.7 | 4.7 | 0.8 | -0.02 | 0.14 | |
| 83-343 | (-3) | P | — | 1.01 | 2.4 | 1.2 | 0.5 | -0.12 | 0.1 | |
| 14-183 | -14,(-65) | B | CTTS | 0.94 | 1.9 | 4.8 | 1.0 | 0.16 | 0.16 | |
| 14-2148 | (-2) | N | TOe8 | 0.29 | 1.4 | 3.4 | 0.4 | 0.01 | 0 | |
| 11-1384 | (-5) | N | N | 0.82 | 1.8 | 4.3 | 0.9 | 0.06 | 0 | |
| 13-924 | (-4) | N | N | 0.95 | 1.8 | 5.5 | 1.0 | -0.08 | 0 | |
| 12-1984 | (-5) | N | N | 0.99 | 1.9 | 2.7 | 0.9 | 0.64 | 0/0.6 | HR |
| 12-2519 | (-8) | P | CTTS | 0.71 | 1.6 | 2.8 | 0.9 | 0.07 | 0.07 | HR |
| 12-1968 | -8,(-11) | B | CTTS | 0.97 | 1.9 | 2.8 | 0.9 | 0.34 | 0.34 | SB2, HR |
| 12-1422 | (-17) | N | N:∗ | 0.32 | 1.3 | 5.8 | 0.5 | 0.05 | 0.24 | large hole? |
| 12-1091 | -2,(-17) | B | CTTS | 2.64 | 2.3 | 14.1 | 1.4 | 0.08 | 0.4 | |
| 13-269 | (-7) | P | N | 1.12 | 2.1 | 2.4 | 0.8 | 0.01 | 0/0.1 | |
| 12-583 | (-7) | N | N | 0.85 | 2.1 | 1.6 | 0.5 | 0.11 | 0 | |
| 13-1238 | -31,(-64) | B | CTTS | 0.60 | 1.9 | 1.8 | 0.4 | 0.6 | 0.6 | |
| 12-2373 | (-6) | N | N | 0.65 | 2.0 | 1.6 | 0.5 | 0.07 | 0 | HR |
| 82-272 | -15,(-13) | B | CTTS | 3.03 | 2.0 | 12.7 | 1.5 | 0.07 | 0.9 | SB2, G-age |
| 12-1081 | (-4) | N | TO | 0.24 | 1.2 | 7.2 | 0.5 | 0.00 | 0 | |
| 13-1161 | (-1) | N | N | 0.39 | 1.4 | 4.9 | 0.6 | 0.01 | 0 | |
| 12-1613 | (-13) | N | N | 0.34 | 1.4 | 3.3 | 0.5 | 0.01 | 0 | |
| 13-1426 | -40,(-109) | B | CTTS | 0.30 | 1.2 | 5.6 | 0.5 | 0.6 | 0.6 | |
| 13-669 | -18,(-22) | B | CTTS | 3.23 | 2.4 | 6.3 | 1.6 | 0.58 | 0.58 | |
| 13-350 | (-9) | N | TO | 0.24 | 1.2 | 6.4 | 0.5 | 0.02 | 0 | |
| 54-1781 | (-13) | P | TO | 0.42 | 1.6 | 2.5 | 0.4 | 0.3 | 0.3 | |
| 13-1877 | -33,(-68) | B | CTTS | 1.16 | 2.2 | 2.3 | 0.8 | 1.6 | 1.6 | |
| 13-277 | -14,-6,(-10,-19) | B | CTTS | 27.75 | 5.9 | 1.9 | 2.6 | 14 | 14 | GM Cep, SB1: |
| 12-1009 | (-4) | N | TO: | 0.98 | 1.8 | 5.0 | 1.0 | 0.07 | 0.07 | |
| 13-819 | -6,(-10) | B | TO:∗ | 1.12 | 2.0 | 3.2 | 1.0 | 0.03 | 0.14 | large hole |
| 12-1955 | (-2) | N | N | 0.41 | 1.3 | 9.2 | 0.9 | 0.01 | 0 | |
| 13-236 | -56,(-47) | B | CTTS | 2.70 | 2.3 | 5.4 | 1.6 | 0.51 | 0.51 | |
| 13-157 | -20,(-14) | B | CTTS | 1.54 | 2.3 | 2.4 | 1.0 | 4.2 | 4.2 | |
| 13-232 | (-3) | N | N: | 0.50 | 1.6 | 2.7 | 0.5 | -0.05 | 0 | |
| 21383216 | (-129) | B | CTTS | 0.22 | 1.1 | 8.4 | 0.5 | 0.4 | 0.4 | |
| 13-566 | (-5) | N | TOe8 | 0.75 | 1.6 | 6.3 | 0.9 | 0.08 | 0 | |
| 13-1709 | (-3) | N | N | 0.85 | 1.7 | 5.8 | 1.0 | -0.14 | 0 | |
| 54-1613 | (-1) | N | TO | 1.13 | 1.9 | 3.5 | 1.1 | 0.00 | 0 | HR |
| 54-1547 | -33,(-34) | B | CTTS | 0.71 | 1.6 | 9.0 | 1.1 | 0.21 | 0.21 | |
| ” | -33,(-34) | B | CTTS | 0.69 | 1.5 | 9.9 | 1.1 | 0.18 | 0.18 | |
| 21384350 | (-23) | N | TO | 0.14 | 1.0 | 7.0 | 0.4 | 0.00 | 0 | HR |
| 12-2363 | (-3) | N | N | 0.97 | 2.3 | 1.0 | 0.5 | 0.2 | 0 | SB1, HR |
| 12-595 | (-17) | N | TO | 0.35 | 1.2 | 22.9 | 0.9 | 0.6 | 0 | scattering? |
| 12-1423 | (-2) | N | N | 0.78 | 1.8 | 4.2 | 0.9 | 0.04 | 0 | |
| 12-1010 | -23,(-20) | B | CTTS | 0.19 | 1.2 | 6.0 | 0.4 | 0.04 | 0.04 | |
| 12-2098 | (-7) | N | — | 0.48 | 1.9 | 1.8 | 0.4 | 0.03 | 0 | HR |
| 91-506 | -31,(-47) | B | CTTS | 0.70 | 1.7 | 6.5 | 0.9 | 0.09 | 0.09 | |
| 12-1617 | -13,(-30) | B | CTTS | 0.67 | 2.0 | 1.6 | 0.5 | 0.16 | 0.16 | HR |
| 21-840 | (-14) | — | CTTS | 0.26 | 1.3 | 6.4 | 0.5 | 0.06 | 0.06 | |
| 13-1048 | -8,(-7) | B | CTTS | 0.57 | 1.7 | 4.3 | 0.7 | 0.04 | 0.3 | |
| 13-1250 | -4,(-2) | B | TO | 1.71 | 2.2 | 3.9 | 1.3 | 0.33 | 0.33 | |
| 21-563 | (-2) | N | TO | 1.11 | 2.6 | 0.8 | 0.5 | 0.02 | 0 | HR |
| 24-542 | (-4) | N: | N | 1.72 | 2.1 | 5.0 | 1.4 | 0.24 | 0.24 | now accreting? |
| 24-515 | (-11) | P | TO | 0.34 | 1.4 | 5.6 | 0.6 | 0.10 | 0.10 | |
| 21-998 | (-16) | P | CTTS | 0.67 | 1.5 | 9.7 | 1.1 | 0.33 | 0.33 | SB1 |
| 21-33 | -51,(-107) | B | CTTS | 0.25 | 1.2 | 9.6 | 0.6 | 0.07 | 0.07 | |
| 24-48 | (-1) | N | N | 0.65 | 1.9 | 1.8 | 0.5 | -0.03 | 0 | HR |
| 21-230 | (-3) | N | N | 0.28 | 1.3 | 7.6 | 0.6 | 0.00 | 0 | |
| 21-1536 | (-26) | — | CTTS | 0.23 | 1.1 | 8.8 | 0.6 | 0.18 | 0.18 | HR |
| 52-1649 | (-3) | — | — | 0.45 | 1.2 | 23.2 | 0.9 | 0.01 | 0 | |
| 21-2251 | (-4) | N | N | 0.83 | 2.4 | 0.9 | 0.4 | 0.07 | 0 | SB1, HR |
| 21-1586 | (-16) | N | N | 0.30 | 1.1 | 12.3 | 0.8 | 0.01 | 0 | HR |
| 53-1762 | (-2) | N | N | 0.25 | 1.1 | 16.1 | 0.7 | 0.01 | 0 | |
| 21-1692 | (-5) | N | N | 0.25 | 1.2 | 6.9 | 0.5 | -0.004 | 0 | |
| 21-763 | (-3) | N | N | 0.37 | 1.4 | 8.3 | 0.7 | -0.002 | 0 | |
| 21-895a | (-1) | P | TO:∗ | 0.97 | 1.8 | 7.7 | 1.1 | 0.21 | 0.21 | |
| 21400451 | (-32) | — | CTTS | 1.34 | 2.1 | 4.9 | 1.2 | 0.71 | 0.71 | |
| ” | (-32) | — | CTTS | 1.07 | 1.9 | 6.8 | 1.2 | 0.44 | 0.44 | |
| 21-1762 | (-3) | N | N∗ | 0.86 | 1.7 | 8.7 | 1.1 | 0.07 | 0.07/0 | large hole? |
| 24-1736 | -33,(-61) | B | CTTS | 0.27 | 1.3 | 4.7 | 0.4 | 0.3 | 0.3 | |
| 24-1796 | -73,(-124) | B | TOe8 | 0.49 | 1.4 | 9.5 | 0.9 | 0.6 | 0.6 | SB2: |
| 21-2006 | (-2) | — | CTTS | 0.81 | 1.6 | 11.5 | 1.1 | 0.12 | 0.12 | |
| ” | (-2) | — | CTTS | 0.68 | 1.5 | 17.6 | 1.0 | 0.13 | 0.13 | 4d |
| 22-2651 | -48,(-34) | B | CTTS | 0.26 | 1.3 | 21.2 | 0.8 | 0.05 | 0.05 | scattering? |
| 22-1418 | (-2) | B | CTTS | 0.88 | 2.4 | 0.9 | 0.4 | 0.02 | 0.3 | HR |
| 23-405 | -9,(-14) | B | CTTS | 1.06 | 1.9 | 8.1 | 1.2 | 0.22 | 0.22 | |
| 23-570 | -18,(-47) | B | CTTS | 0.92 | 1.8 | 6.4 | 1.1 | 0.7 | 0.7 | |
| NGC 7160 | ||||||||||
| 01-580 | (-96) | — | CTTS | 1.01 | 1.7 | 11.4 | 1.2 | 4 | 4 |
Note. — Accretion and stellar parameters. The H EW has been compiled from Sicilia-Aguilar et al. (2005b, 2006b, 2008a). The accretion rates are given in units of 10-8 M⊙ yr-1. It is negative for emission lines, and the values between parentheses correspond to low-resolution spectroscopy. The H profile is marked as ‘broad’ (B), ‘probably broad’ (P), and ‘narrow’ (N; Sicilia-Aguilar et al. 2006b). The disk type is classified as ‘CTTS’ for normal classical TTS, ‘TO’ (or ‘TOe8’ if only a small excess at 8m is present) for transition objects, and ‘N’ for objects without a detectable excess. Uncertain values are marked with ‘:’. Objects that have no exess down to 8m and have not been detected at 24m, but display some signs of accretion, are marked with ∗ and classified as potential TO with large holes. ṀU indicates the accretion directly measured from the U band photometry, Ṁfin is the final value of the accretion rate after requiring a detection probability 99% (based on 5000 simulations) and H (see text). Accretion rates are marked as “0” when the simulated data is consistent with zero and there is no further evidence of accretion (see text). If the photometry is consistent with no accretion, but H suggest that the object is accreting, we consider it as an upper limit. Whenever the measured U band luminosity was found to be below the expected photospheric luminosity in U (LU is negative), we mark it as a negative accretion rate (corresponding to the accretion rate resulting from the absolute value of LU). The errors in the luminosity are typically low ( few percent). Radii, masses, and ages are derived from the V vs. V-I diagram (or the HR diagram, see text, marked with HR in the “Comments” column), using the Siess et al. (2000) isochrones. For K and M stars, the typical errors in these quantities are 10%, although the age could be more affected by the presence of unresolved binaries. The age of early K and G-type stars is far more uncertain due to general problems establishing the birthline (Hartmann 2003); such objects are marked as “G-age”. Binary information for spectroscopic binaries (unresolved, similar mass, single-lined [SB1] or double-lined [SB2] spectroscopic binaries) is taken from Sicilia-Aguilar et al. (2006b).
| Trend | r | p | Confidence interval | Comments |
|---|---|---|---|---|
| Ṁ vs. (H-4.5) | 0.10 | 0.52 | -0.26,0.44 | No significant correlation |
| Ṁ vs. (H-8.0) | 0.21 | 0.16 | -0.15,0.53 | No significant correlation |
| Ṁ vs. (3.6-5.8) | 0.38 | 0.02 | 0.03,0.64 | Moderate correlation |
| Ṁ vs. (5.8-8.0) | 0.02 | 0.87 | -0.33,0.38 | No significant correlation |
| Ṁ vs. (H-24) | -0.01 | 0.97 | -0.38,0.37 | No significant correlation (survey not complete at 24m) |
| Ṁ vs. (8.0-24) | -0.26 | 0.12 | -0.58,0.13 | Weak potential anticorrelation (survey not complete at 24m) |
| Ṁ vs. age (All) | -0.60 | 0.001 | -0.70,-0.48 | Anticorrelation |
| Ṁ vs. age (Cep OB2 only) | -0.32 | 0.03 | -0.61,0.04 | Moderate anticorrelation |
| Ṁ vs. M∗ | 0.32 | 0.03 | -0.03, 0.59 | Moderate correlation |
Note. — Spearman’s correlation coefficients (r), probability (p) and conficence intervals of the different trends explored. A value of r1 indicates a perfect positive correlation, r-1 indicates anticorrelation, r0 suggests that the two quantities are uncorrelated. The probability that such a correlation coefficient is from a sample of random data is indicated by p.
| ID | Ṁ02/03 (10M⊙ yr-1) | Ṁ07 (10M⊙ yr-1) | Comments |
|---|---|---|---|
| 72-875 | 0.001 | 0.11 | SB1: |
| 14-141 | 0.1 | 2.3 | spectroscopically confirmed |
| 11-2146 | 16 | 1.0 | spectroscopically confirmed, type III variable |
| 11-2031 | 1.6 | 0.3 | |
| 13-1238 | 11 | 0.6 | |
| 82-272 | 24 | 0.9 | SB2, uncertain, type III variable |
| 13-277 | 30 | 14 | GM Cep, spectroscopically confirmed |
| 13-236 | 2 | 0.5 | |
| 13-1250 | 0.1 | 0.33 | TO |
| 21-1762 | 0.2 | 0.07 | large hole candidate |
Note. — Candidates to have type II variability, related to a variable accretion rate.
| ID | AV (2001) | AV (2007) | Comments |
|---|---|---|---|
| 11-2146 | 2.58 mag | 1.620.13 mag | type II variable |
| 14-287 | 2.20 mag | 1.10.3 mag | disk |
| 11-1067 | 1.20 mag | 0.640.12 mag | |
| 11-581 | 1.50 mag | 3.190.09 mag | |
| 82-272 | 3.58 mag | 3.010.06 mag | disk, SB2, type II candidate |
| 12-1955 | 1.42 mag | 0.710.09 mag | |
| 12-595 | 1.18 mag | 3.10.4 mag | TO, evidence of scattering |
| 21-840 | 2.15 mag | 1.450.04 mag | disk |
| 13-1048 | 1.67 mag | 0.710.03 mag | disk |
| 21-230 | 1.50 mag | 0.710.03 mag | |
| 21-1692 | 1.68 mag | 0.710.03 mag | |
| 21-763 | 1.20 mag | 0.610.03 mag | |
| 21-1762 | 1.75 mag | 1.570.03 mag |
Note. — Candidates to have type III variability, related to a variable extinction, probably caused by circumstellar matter.