Testing Ultrafast Two-Photon Spectral Amplitudes via Optical Fibres
G. Brida1, V. Caricato1,2, M. V. Chekhova1,3, M. Genovese1, M. Gramegna1, T. Sh. Iskhakov3
1Istituto Nazionale di Ricerca Metrologica, Strada delle Cacce 91, 10135 Torino, Italy
2Dipartimento di Fisica, Politecnico di Torino, Corso Duca degli Abruzzi 24,
10129 Torino, Italy
3Department of Physics, M. V. Lomonosov Moscow State University, Leninskie Gory, 119992 Moscow, Russia
m.genovese@inrim.it
Abstract
We test two-dimensional TPSA of biphoton light emitted via ultrafast spontaneous parametric down-conversion (SPDC) using the effect of group-velocity dispersion in optical fibres. Further, we apply this technique to demonstrate the engineering of biphoton spectral properties by acting on the pump pulse shape.
OCIS codes: (270.0270) Quantum optics, (270.5585) Quantum information and processing
References and links
- [1] W.P. Grice and I.A. Walmsley, Phys. Rev. A 56, 1627 (1997).
- [2] T.E. Keller and M.H. Rubin, Phys. Rev. A 56, 1534-1541 (1997).
- [3] M. V. Fedorov, M. A. Efremov, A. E. Kazakov, K. W. Chan, C. K. Law, and J. H. Eberly, Phys. Rev. A 69, 052117 (2004); Yu.M. Mikhailova, P.A. Volkov, M.V. Fedorov, Phys. Rev. A 78, 062327 (2008); P. A. Volkov, Yu. M. Mikhailova, M. V. Fedorov, Advanced Science Letters 2, 511 (2009); G. Brida, V. Caricato, M. V. Fedorov, M. Genovese, M. Gramegna and S. P. Kulik, EPL 87 64003 (2009).
- [4] P. J. Mosley, J. S. Lundeen, B. J. Smith, P. Wasylczyk, A. B. U’Ren, C. Silberhorn, and I. A. Walmsley, Phys. Rev. Lett. 100, 133601 (2008).
- [5] Y.-H. Kim and W. P. Grice, Opt. Lett. 30, 908 (2005).
- [6] W. Wasilewski, P. Wasylczyk, P. Kelenderski, K. Banasek, and C. Radzewicz, Opt. Lett. 31, 1130 (2006).
- [7] H. S. Poh, C. Y. Lum, I. Marcikic, A. Lamas-Linares, and C. Kurtsiefer, Phys. Rev. A 75, 043816 (2007); X. Shi et al., Optics Letters 33, 875 (2007); A. Valencia, A. Cere, X. Shi, G. Molina-Terriza, and J. P. Torres, PRL 99, 243601 (2007); M. Hendrych, X. Shi, A. Valencia, and J. P. Torres, Phys. Rev. A 79, 023817 (2009).
- [8] A. Valencia, M. V. Chekhova, A. S. Trifonov and Y. H. Shih, Phys. Rev. Lett. 88, 183601 (2002).
- [9] M. V. Chekhova, JETP Lett., 75, 225-226 (2002).
- [10] G. Brida, M. V. Chekhova, M. Genovese, M. Gramegna, and L. A. Krivitsky, Phys. Rev. Lett. 96, 143601 (2006); G. Brida, M. V. Chekhova, M. Genovese and L. Krivitsky, Phys. Rev. A 76, 053807 (2007).
- [11] M. Avenhaus, A. Eckstein, P. J. Mosley, and C. Silberhorn, Opt. Lett. 34, 2873 (2009).
- [12] S. Y. Baek, O. Kwon, and Y.-H. Kim, Phys. Rev. A 78, 013816 (2008).
- [13] N. C. Menicucci, S. T. Flammia, O. Pfister, Phys. Rev. A 76 010302 (2007); Phys. Rev. Lett. 101 130501 (2008).
- [14] Y.-H. Kim, M. V. Chekhova, S. P. Kulik, Y.-H. Shih, and M. H. Rubin, Phys. Rev. A 61, 051803(R) (2000).
- [15] J. K. Ranka, R. S. Windeler, and A. J. Stentz, Opt. Lett. 25, 25 (2000).
- [16] M. Genovese, Phys. Rep. 413, 3197 (2005).
The spectral properties of two-photon light are fully characterized by two-photon spectral amplitude (TPSA). It was first introduced for describing two-photon light generated via spontaneous parametric down-conversion (SPDC) from femtosecond pulses and the corresponding interference experiments [1, 2]. Recently, TPSA has been shown to determine the degree of frequency entanglement [3]. In particular, the technique of heralded generation of pure single-photon quantum states relies on testing TPSA [4].
Experimental measurement of TPSA has been first performed by registering the distribution of coincidences between signal and idler photons as a function of frequencies selected in the signal and idler channel (joint spectral distribution) [5, 6, 7]. For biphotons generated from a cw pump, when TPSA depends on only a single frequency argument, an alternative technique has been suggested for its measurement, based on its spreading in optical fibres [8, 9]. This technique, in particular, enabled observation of various Bell states contained within the width of the TPSA [10].
In the case of SPDC pumped by short pulses, TPSA depends on both signal and idler frequencies, as signal and idler photons are not any more delta-correlated in frequency. Propagation of pulsed two-photon light through optical fibre has been studied in Ref. [11], and it was suggested to use dispersion spreading for the spectroscopic study of conditionally prepared single-photon states. In an earlier paper [12], a similar technique was used for the study of single-photon states prepared via cw SPDC.
In this paper, we show that propagation of two-photon states through a dispersive medium (for instance, an optical fibre) provides more general information. Namely, it provides a frequency-to-time two-dimensional (2D) Fourier transform of the TPSA and this enables one to characterize TPSA by measuring time intervals. Further, we apply this method to a proof-of-principle demonstration of the engineering of spectral properties of biphoton entangled states. A very efficient technique of measuring two-dimensional coincidence time distribution has been suggested in Ref. [11]. Here, we use a simpler method, based partly on time selection and partly on frequency selection. Despite its simplicity, our method allows us to observe such effects of pulsed TPSA as asymmetry with respect to signal-idler exchange and interference structure.
For SPDC from a short-pulsed pump, the two-photon state has the form [1, 2]
| (1) |
where are creation operators of the signal and idler photons. The TPSA depends both on the pump spectrum and on the phase matching conditions in the crystal [1]. It is convenient to introduce the deviations of the signal and idler frequencies from exact phase matching, which, for simplicity, we will consider as frequency-degenerate at frequency : , . The two-photon time amplitude (TPTA), whose physical meaning is the probability amplitude of the signal photon registered at time and the idler photon at time , is the 2D Fourier transform of TPSA:
| (2) |
In a dispersive medium, as, for instance, an optical fibre of length , each of the photon creation operators from Eq. (1) acquires a frequency-dependent phase [9] that can be attributed to the TPSA. As a result, the TPSA changes:
| (3) |
where are second-order derivatives of the dispersion law for signal and idler photons. Transformation (3), as is well-known in the diffraction theory or in the theory of dispersive spreading of short pulses, at a sufficiently large length (‘far-field zone’) leads to a Fourier transformation from frequency to time. Note that this transformation will occur in both and . In a fibre without birefringence, . As a result, the TPTA after the fibre has the same shape as TPSA, with the only difference that the frequency arguments are replaced by scaled time arguments:
| (4) |
The probability of the pair to arrive at times is given by the squared modulus of (4). Distribution can be measured directly if arrival times of the signal and idler photons are registered separately, using, for instance, the pump pulse as a trigger [11]. This is not necessary for our purposes and we measure only delays between the signal and idler photons, in a simpler standard START-STOP technique. This way, the information about the arrival times of signal and idler photons separately is discarded. The situation can be explained by passing from coordinates to a rotated frame . Distribution of the coincidence counting rate versus the delay between signal and idler arrival times, , gives the integral of the TPTA square modulus w.r.t. , which corresponds, with the scaling , to the frequency distribution of the form
| (5) |
where, similarly, .
Distribution (5) provides the projection of onto the axis (Fig. 1). Additional information about TPSA can be obtained by measuring the same distribution with narrowband filters inserted in front of the signal or idler detectors. For infinitely narrow filters at frequencies or , the resulting distributions will be or , respectively. As a result, the signal-idler time delay distribution will show the projection on the axis of the TPSA intersection with the or axis (shown by bold red lines in Fig.1). The three distributions taken for the cases of (i) no filters inserted, (ii) a filter inserted into the signal channel, and (iii) a filter inserted into the idler channel will provide, in an easy way, basic information about the TPSA. For the TPSA shown in Fig.1a, these distributions are plotted in Fig. 1d. From the widths of distributions (ii) and (iii), and , one can retrieve the tilt of the TPSA as (Fig.1a). From any of these two widths and the width of the unfiltered distribution , the degree of frequency entanglement [3] can be calculated as .
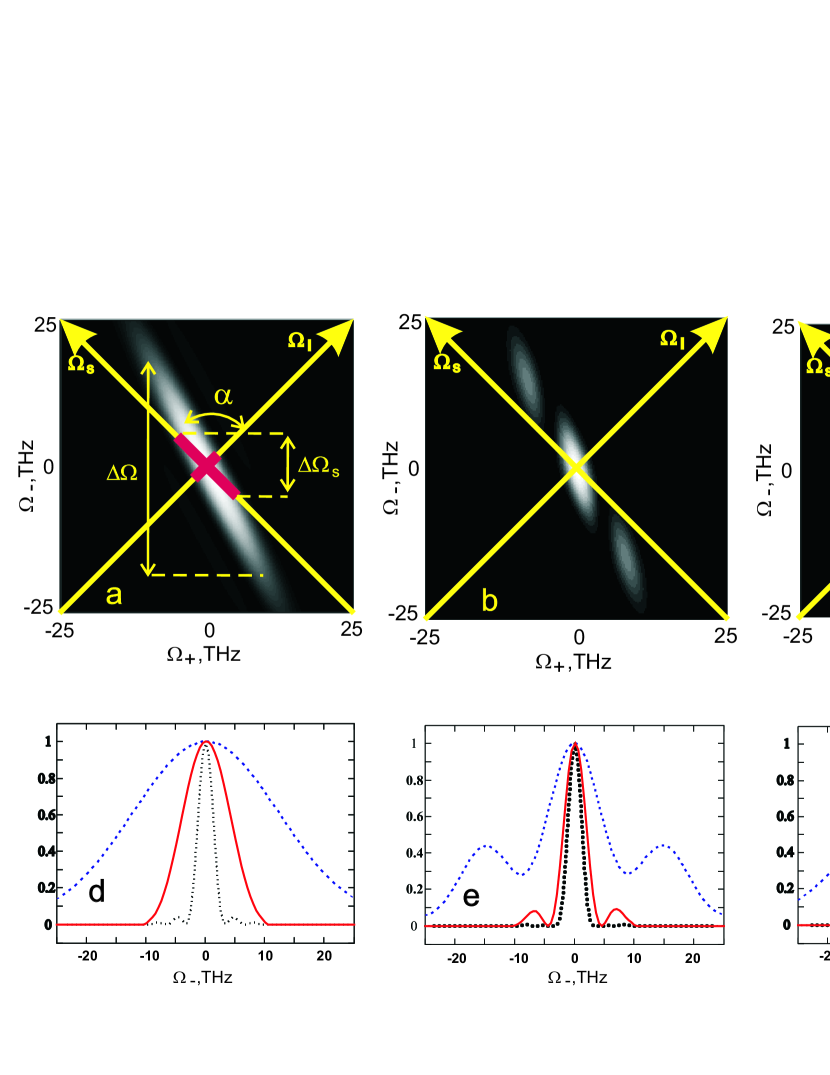
In other words, the three types of coincidence distributions (cases (i), (ii), and (ii)) provide the projections of the TPSA and of its cross-sections. These measurements also allow one to observe interference structure in the shape of TPSA. Such structure can be introduced deliberately, to ’engineer’ the spectral properties of biphoton light and, in particular, to get entanglement between multiple pairs of frequency modes [13]. The easiest way to create a complicated shape of TPSA is to split the pump pulse in two and hence to introduce modulation into the pump spectrum [14]. Typical shapes of TPSA in this case are shown in Figs 1 b,c. In general, the interference structure manifests itself in all three cases (i) (no filters), (ii) (narrowband filter in the signal channel), and (iii) (narrowband filter in the idler channel). At the same time, TPSA modulation with larger period (Fig.1b) is more likely to be seen in the unfiltered distribution than in filtered ones, since the TPSA projection will resolve the structure (Fig.1e, blue dashed line) while its cross-section will not (Fig.1e, black dotted line and red solid line). In the case of a small modulation period (Fig.1c), unfiltered distribution will have the structure ’smeared’ (Fig.1f, blue dashed line) while filtering with sufficiently small bandwidth will reveal the structure (Fig.1f, black dotted line and red solid line).
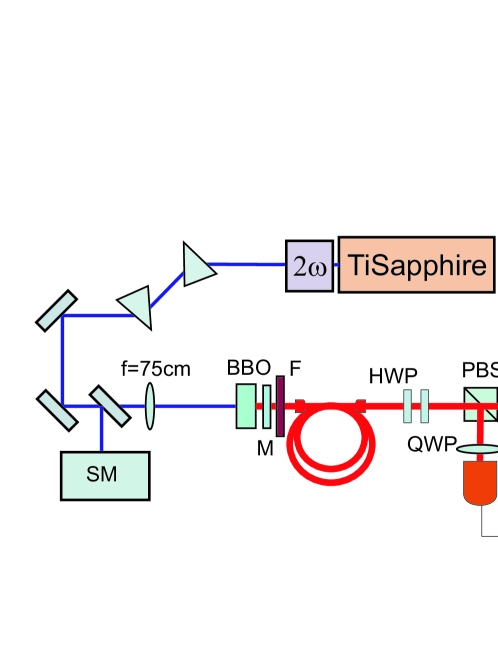
In our experiment (Fig. 2), type-II SPDC was generated in a 5 mm BBO crystal by means of a femtosecond-pulse pump with the wavelength 404 nm and bandwidth 2 nm. The pump was focused into the crystal by an cm lens. After the crystal, the pump was eliminated using a mirror and an RG filter, and the SPDC radiation was coupled into a 500 m of S630 (Thorlabs) optical fibre with demagnification about 100, by means of a 20x objective lens. After the fibre, the beam was polarization-corrected with the help of two retardation plates and sent to a polarizing beamsplitter (PBS). Further, horizontally and vertically polarized photons were registered, respectively, by detectors 1 and 2 (MPD single-photon counters, jitter time ps). Distribution of the delay time between signal and idler photons was measured by means of a time-to-amplitude converter (TAC) followed by multi-channel analyzer (MCA).
The resulting time distributions for the cases of (i) no filtering, (ii) a 1 nm filter inserted into the signal (ordinarily polarized) beam, and (iii) a 1 nm filter inserted into the idler (extraordinarily polarized) beam are shown in Fig.3a (respectively, by blue triangles, black squares, and red empty circles). For convenience, all dependencies are normalized to unity. The results clearly demonstrate the asymmetry of TPSA with respect to signal and idler frequencies, as the same filter inserted into signal and idler channels leads to different time distributions. From the experimental distributions, the tilt of the TPSA is , while from theoretical calculations (Fig.1d), its value is . For the degree of entanglement , the experimental distributions give a value of , while the theoretical distributions lead to . The disagreement is mainly caused by the finite bandwidth of the filter used ( nm), which broadens the (ii) and (iii) distributions but does not change the (i) one, and hence reduces the value.
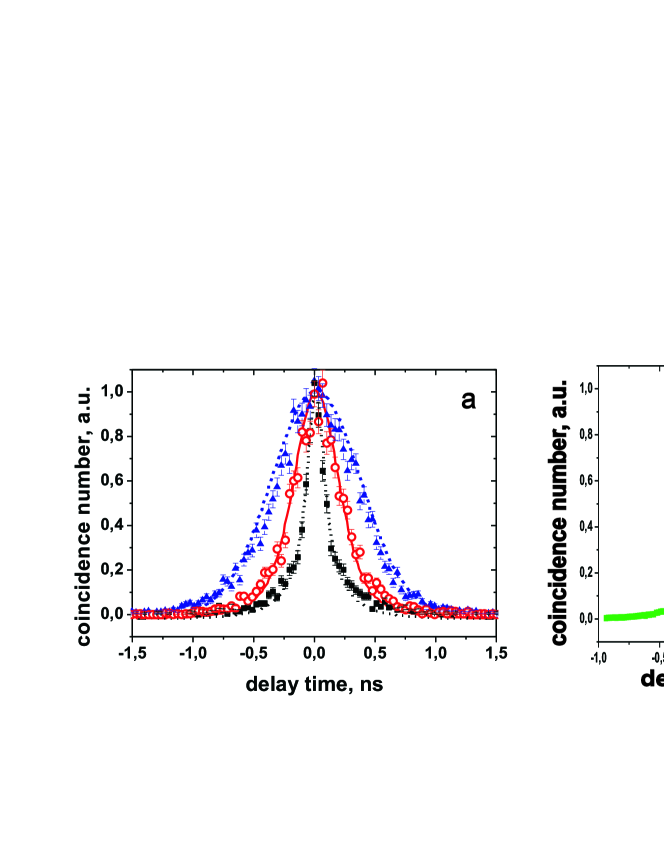
Lines in Fig.3a are theoretical distributions calculated for all three cases. Insertion of narrowband filters was taken into account by multiplying TPSA by frequency-dependent Gaussian functions describing the filter transmission band. When calculating time distributions, we assumed the fibre GVD to be . This value was found by transmitting a pulse from the Ti-Sapphire laser first harmonic through the fibre and measuring its autocorrelation function width. It is very close the GVD of a standard fused silica fibre [15]. The finite resolution of the method was taken into account by registering the coincidence distribution without the fibre inserted (Fig.3b). The measured distribution, with FWHM equal to ps, was used as a point-spread function, and the theoretical distributions in Fig.3a were calculated as its convolution with the ’raw’ spectra, given by Eqs. (4,5). The theoretical curves for the filtered cases are in perfect agreement with the experimental data, although the only fitting parameter is the height of the distributions (all are normalized to unity). The 10% difference in the experimental and theoretical widths of the unfiltered distribution can be due to the spectrum restriction by optical elements and the detectors sensitivity curve.
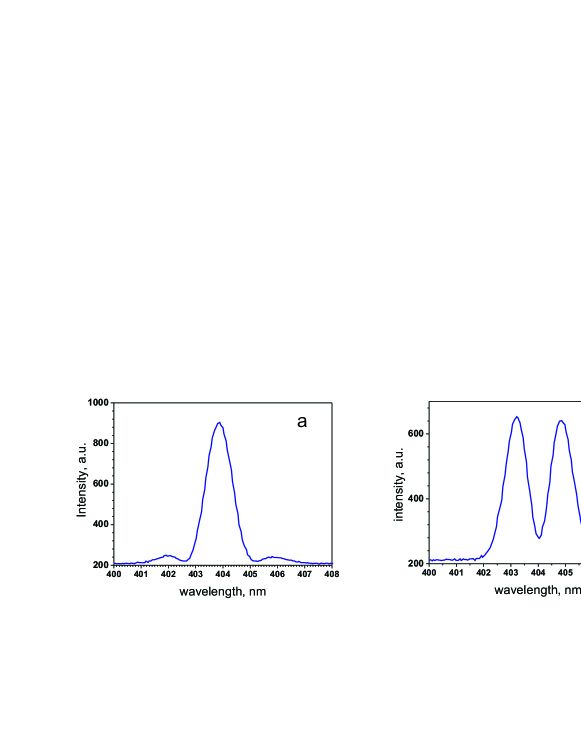
In the second part of our experiment, we ’engineer’ a TPSA with modulated shape and observe this shape using our method. For this purpose, we modify the pump spectrum using a birefringent material with the plane of the optic axis oriented at with respect to the pump polarization. This method, first suggested in Ref. [14], allows to split the pump pulse in two temporally separated pulses with orthogonal polarizations, oriented at to the initial pump polarization. The spectrum of the pump pulse is then modulated by a harmonic function, the modulation period scaling as the inverse time interval between the two pulses. By introducing modulation into the pump spectrum, we also change the TPSA (as shown in Fig.1b,c). As a birefringent material, we used a BBO crystal of length mm and the optic axis oriented at to the pump beam, which led to a fs separation between the two pulses. Note that the crystal did not produce SPDC radiation as its orientation did not satisfy the phase matching conditions. After projecting the pulses onto the same polarization direction, we obtained the pump spectrum modulated by a sine/cosine function, depending on the phase between the pulses, which could be aligned by slightly tilting the crystal. Fig.4 shows the pump spectra with the modulation phase fixed at (a) and (b). Further, we only focused on the case of the phase as the shape is more recognizable.
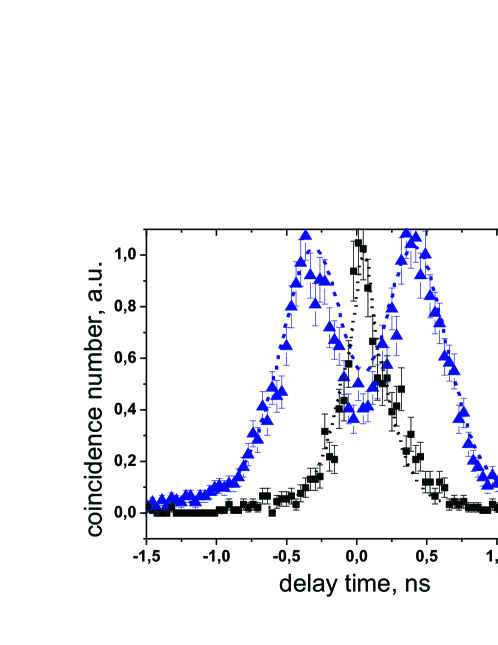
Experimental and theoretical distributions (points and lines, respectively) are shown in Fig.5. In the case of no filters inserted (blue triangles, blue dashed line) interference structure is clearly seen. For filters in the signal or idler channels, we obtained no interference structure, as predicted by theory. The plot shows the case where a 1 nm filter is inserted into the signal channel (black squares, black dotted line).
TPSA with the structure shown in Fig. 1c can be obtained by inserting into the pump beam a 5-mm BBO crystal with the plane of the optic axis oriented at to the vertical axis. We did this in the experiment and indeed, the interference structure in the unfiltered distribution was smeared, as one can predict from Figs. 1c,f. At the same time, to see the interference structure in the filtered distributions one should perform much more narrowband filtering than with the interference filters we used. Filtering with nm filters did not reveal the interference structure.
In conclusion, we have performed an experiment aimed to demonstrate a technique for studying the TPSA of ultrafast (femtosecond-pulsed) two-photon states. By measuring the distribution of the time delay between signal and idler photons, we are able to retrieve the projection of TPSA on the axis. With the help of narrowband filters inserted into signal and idler channels, one can measure the tilt of TPSA and the degree of entanglement. Further, we used this technique for showing the effect on the shape of TPSA of the pump spectrum modulation. This last result paves the way, in view of application to quantum technologies[16], for engineering the biphoton TPSA, as, for example, the generation of controlled optical frequency combs [13].
We are grateful to L. A. Krivitsky for the help at the early stages of the experiment. This work has been supported in part by MIUR (PRIN 2007FYETBY), ”San Paolo foundation”, NATO (CBP.NR.NRCL 983251), RFBR 08-02-00555a and the Russian Program for Scientific Schools Support, grant # NSh-796.2008.2. M. V. Ch. also acknowledges the support of the CRT Foundation.