The H Variations of Carinae
During the 2009.0 Spectroscopic Event
Abstract
We report on H spectroscopy of the 2009.0 spectroscopic event of Carinae collected via SMARTS observations using the CTIO 1.5 m telescope and echelle spectrograph. Our observations were made almost every night over a two month interval around the predicted minimum of Car. We observed a significant fading of the line emission that reached a minimum seven days after the X-ray minimum. About 17 d prior to the H flux minimum, the H profile exhibited the emergence of a broad, P Cygni type, absorption component (near a Doppler shift of km s-1) and a narrow absorption component (near km s-1 and probably associated with intervening gas from the Little Homunculus Nebula). All these features were observed during the last event in 2003.5 and are probably related to the close periastron passage of the companion. We argue that these variations are consistent with qualitative expectations about changes in the primary star’s stellar wind that result from the wind - wind collision with a massive binary companion and from atmospheric eclipses of the companion.
1 Introduction
The star Carinae (HD 93308) is one of the most massive and luminous objects in the local region of the Galaxy. It experienced a large eruption in the mid-nineteenth century that led to the formation of the surrounding Homunculus Nebula (Davidson & Humphreys 1997). The high-excitation, forbidden lines in the spectrum disappear and reappear in a 5.54 y cyclic manner (Damineli et al. 2000). This same periodicity is observed in the star’s photometric (van Genderen et al. 2003; Fernández-Lajús et al. 2003; Whitelock et al. 2004) and X-ray light curves (Corcoran 2005). Damineli et al. (1997) and others proposed that this period corresponds to the orbital period of a binary companion in a very eccentric orbit, in which the spectroscopic event (as well as photometric and X-ray minima) occurs near periastron. Detection of the companion has eluded observers so far, but a fit of the spectrum from the Chandra X-ray Observatory with models of the X-rays generated in the wind - wind collision indicates that the companion has a powerful stellar wind and is probably also a massive star (Pittard & Corcoran 2002). X-rays from the wind - wind collision region will encounter a varying column density of gas along our line of sight with the changing binary orientation. The X-ray maximum occurs shortly before periastron when our sight line cuts through the rarefied wind of the secondary (bounded by a Coriolis-deflected, bow shock where the winds collide), while the X-ray minimum occurs close to periastron when the collision region is blocked by obscuring, dense gas of the primary’s wind. Numerical models of the wind - wind collision by Okazaki et al. (2008) and Parkin et al. (2009) can reproduce many of the features of the X-ray light curve, but they also reveal discrepancies from observations made during the intense interaction at closest approach. Although the details of wind collision need further investigation, the basic geometry of the models helps explain the spatial variations of the emission spectrum from the resolved, extended wind region surrounding the central binary (Gull et al. 2009).
The strong stellar wind and surrounding ejecta of Car produce a very strong H line. It is one of strongest emission features in the spectrum and is formed over a large volume (Hillier & Allen 1992; Hillier et al. 2001). The main emission component is formed in the wind of the primary (Hillier et al. 2001; Davidson et al. 2005; Gull et al. 2009), but there are other components formed in nearby circumstellar gas, especially the Weigelt blobs (Weigelt & Ebersberger 1986; Davidson et al. 2005; Gull et al. 2009). There is dust in the ejecta of the Homunculus Nebula that scatters the starlight of the primary star so that the spatial variations in the emission profile can be used to sample the wind as seen from different orientations. Such investigations indicate that the star has a strong and fast polar wind and a slow and dense equatorial outflow (Smith et al. 2003; Stahl et al. 2005). During the 2003.5 event Davidson et al. (2005) observed a decrease in H emission strength and the development of a P Cygni absorption component. However, we have not observed enough periastron events to know if these developments occur every time.
We collected high dispersion H spectroscopy of Car during the recent 2009.0 event through the Small and Moderate Aperture Research Telescope System (SMARTS) program with the Cerro Tololo Interamerican Observatory (CTIO) 1.5 m telescope. We present in §2 the spectroscopic observations made before, during, and after the minimum. In §3 we discuss the observed variations and compare them to those observed by Davidson et al. (2005) during the last (2003.5) event. In §4, we argue that many of the observed changes are consistent with qualitative predictions of the wind - wind collision model.
2 Observations
We obtained high resolution (; Å FWHM) echelle spectra of Car with the 1.5 m telescope at CTIO. The Fiber Echelle Spectrograph444http://www.ctio.noao.edu/∼atokovin/echelle/index.html is connected to the telescope by a fiber that collects flux over a circular aperture of diameter on the sky. The resulting spectra will include flux contributions from the central binary, extended wind, Weigelt blobs, and some scattered light from dust in the Homunculus Nebula (Smith et al. 2003; Gull et al. 2009). Our observations have a good signal-to-noise ratio (between 40 and 100 per pixel in the continuum, depending on the order) and continuous coverage in the spectral region 4800 7400Å. We collected our first echelle spectrum on 2008 Nov 14, and then began obtaining approximately one spectrum per night over the period from 2008 Dec 18 to 2009 Feb 19 (UT). We typically obtained three 30 s exposures, short enough to avoid saturation at H, the brightest feature in this spectral region. We also made longer exposure (120 s) spectra to obtain higher signal-to-noise for transitions weaker than H, and we will discuss those spectra in a subsequent paper. The observations were recorded on a 20482048 SITe chip with 24 m pixels. The chip is read out using two amplifiers, and images are recorded with an overscan region in the central part of the chip. All the spectra were bias-subtracted, trimmed, flat fielded, and wavelength calibrated using standard IRAF555IRAF is distributed by the National Optical Astronomy Observatory, which is operated by the Association of Universities for Research in Astronomy, Inc., under cooperative agreement with the National Science Foundation. techniques for echelle spectroscopy. Wavelength calibration was achieved by means of a ThAr lamp, and the typical residuals of our solution were approximately 0.0035 Å. We extracted 46 orders from each spectrum, ranging from 50 Å to 150 Å of usable data in each order. The H spectra were normalized to a unit continuum after large scale sensitivity variations were removed using flat field images, and the final spectra were transformed to a uniform, heliocentric wavelength grid.
We also collected some lower resolution Cassegrain spectra using the CTIO 1.5 m telescope and R-C Spectrograph with the standard 47/Ib setup (Howell et al. 2006), which records the range from 5630 Å to 6950 Å. These spectra have a resolution of 2.2 Å FHWM (). The spectrograph slit was wide and in height and was oriented in an east - west direction. The spectra were recorded on a Loral 1200800 CCD detector and were reduced using standard IRAF techniques. Exposures were only 0.2 s long in order to avoid saturation at H. We typically made two integrations per visit and performed the wavelength calibration using a Ne lamp. We also observed the flux standard stars Feige 110 or LTT 4364 to flux calibrate the spectra, but the spectra were subsequently normalized to a unit continuum and transformed to a standard, heliocentric wavelength grid.
In Table 1 we present the dates of our observations. We used the period of 2022.7 d and epoch of minimum of HJD 2452819.8 derived by Damineli et al. (2008a) to phase our data to the orbital cycle of the system. Damineli et al. define phase 0.0 to be the time when the narrow emission component of the optical He I lines disappears. They count the 2003.5 event as the eleventh one since the first event noted during 1947 by Gaviola (1953). The predicted time of the 2009.0 event of HJD 2454842.5 was confirmed in recent observations by Damineli et al. (2009). Note that the beginning of the X-ray minimum occurred about 4 d after this666http://asd.gsfc.nasa.gov/Michael.Corcoran/eta_car/etacar_rxte_lightcurve/index.html and the -band minimum occurred d after phase 0.0 (Fernández-Lajús et al. 2009).
3 H Observations and Variability During the 2009.0 Spectroscopic Event
Figure 1 displays the line profiles observed with the echelle spectrograph. The main feature is a large broad emission structure that is probably formed in the wind of the primary star (Davidson et al. 2005; Gull et al. 2009). There are no large scale changes in line position visible, but we measured the radial velocity in the sensitive line wings using a line bisector method (Shafter et al. 1986). This method samples the line wings using oppositely signed Gaussian functions and determines the mid-point position between the wings by cross-correlating these Gaussians with the profile. We used Gaussian functions with FWHM = 20 km s-1 at sample positions in the wings of km s-1, and the resulting bisector velocities are given in column 6 of Table 1. These measurements (discussed in the next section) show that the broad emission shifted slightly from blue to the red near periastron (in the same sense as expected for the orbital motion of the primary star; Nielsen et al. 2007). There is a narrow emission line in the central part of the profile that originates in the nearby Weigelt blobs (Davidson et al. 2005; Gull et al. 2009). We made no attempt to remove this feature because spatially resolved spectra (Gull et al. 2009) show that the nebular emission extends over the full emission profile and because this nebular component probably varies near phase 0.0. The spectral sequence also shows the development of a narrow absorption line near a radial velocity of km s-1. This feature appeared in earlier spectra (Melnick et al. 1982; Damineli et al. 1998; Davidson et al. 2005) and was referred to as the “anomalous absorption” by Humphreys et al. (2002). Several other narrow but weaker absorption features are also seen that also appear to be stationary. The blue side of the profile displayed a bumpy appearance just prior to the minimum in a manner reminiscent of the emission lines of W-R stars (Lépine et al. 1996), and these may result from structure and clumping in the outflow of the primary (Hillier et al. 2001).
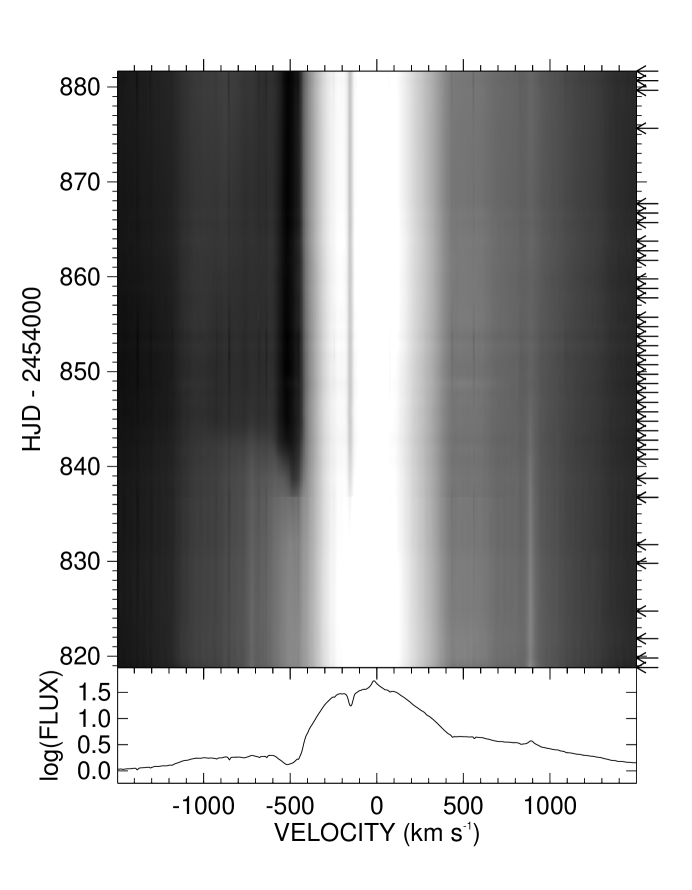
Figure 2 shows a plot of the logarithmic intensity of the normalized spectra in a gray scale depiction as a function of radial velocity and time. The benefit of this representation is that fainter features in the wings are more readily visible. Figure 2 shows how the anomalous absorption feature near 144 km s-1 and a second, P Cygni type, absorption feature near km s-1 both appear in the H profile between observations made on HJD 2454832 and HJD 2454837 (just prior to phase 0.0 at HJD 2454842.5). The P Cygni absorption shows a slight blueward progression of the profile as it becomes stronger that reaches a minimum velocity approximately 7 d after its first appearance. At about this time, we see evidence of a flat absorption plateau that extends blueward to km s-1 and lasts for over 10 d. This velocity range of absorption is similar to that inferred for the polar wind of the primary star from observations of scattered light spectra in the Homunculus Nebula (Smith et al. 2003). A similar development of P Cygni absorption was also observed in the 2003.5 event in both H and higher members of the Balmer sequence (Davidson et al. 2005; Nielsen et al. 2007). The [N II] emission (near km s-1 in the H frame) is seen throughout the sequence, although its strength is very weak after phase 0.0.
We compare in Figure 3 the variations observed in 2009.0 with those from the prior 2003.5 event. The H spectra from the 2003.5 minimum are Hubble Space Telescope Space Telescope Imaging Spectrograph (STIS) observations made available at the HST Treasury Program on Eta Carinae archive site777http://etacar.umn.edu/archive/. The STIS spectra were summed across the entire slit to include the surrounding nebulosity and to make them more comparable to our ground-based data. We show the STIS spectra (left panel) together with our extended set of low resolution R-C spectra augmented with several echelle spectra (right panel), and the STIS and echelle spectra are smoothed to the lower resolution of the R-C spectra for ease of comparison. The H profiles are different between these two events (partly because the space- and ground-based observations sample different parts of the inner nebula and possibly due to the clumpy nature of the primary’s wind; Hillier et al. 2001), but they do appear to show similar trends. They both exhibited minimum strength near phase 0.0 and showed the development of the P Cygni absorption near km s-1 around this time (see Fig. 3 in Davidson et al. 2005). Furthermore, the anomalous absorption near km s-1 appears to strengthen around phase 0.0 in both data sets. This suggests that these features are modulated on the orbital cycle.
We measured the H equivalent width by integrating the line intensity over a range corresponding to Doppler shifts of km s-1. The measurements are listed in column 4 of Table 1 and are plotted as a function of time in the top panel of Figure 4. The typical equivalent width error is . We transformed these equivalent width measurements to a relative line flux using the -band light curve of Fernández-Lajús et al. (2010) (and subsequent photometry; see lower panel of Fig. 4) and the relation
where the fiducial time was set for that of the first echelle spectrum, HJD 2454784.9. When the equivalent widths are corrected for the changing continuum (given in column 5 of Table 1), the minimum of the H flux occurs about 11 d after phase 0.0 (see middle panel of Fig. 4). This time lag is similar to that observed in 2003.5 (see Fig. 4 in Davidson et al. 2005). The H strength (Davidson et al., 2005) and -band flux (Fernández-Lajús et al., 2010) are generally stronger at other orbital phases and are subject to irregular and long term fluctuations.
4 Discussion
Our observations show that some of the H variations are repeatable from event to event, and consequently it is interesting to consider what aspects of the binary interaction might be the cause. Here we argue that several of the important variations can be explained in the context of the wind - wind collision model (Okazaki et al. 2008; Parkin et al. 2009; Madura et al. 2009). Okazaki et al. (2008) present a hydrodynamical simulation of the gas dynamics of the wind - wind collision in Car that they use to model the X-ray light curve. They assume the binary consists of a primary with a slow dense wind and a secondary with a fast rarefied wind. The orbital eccentricity is set to a large value of , and the best fit of the X-ray light curve occurs for a longitude of periastron of the primary of and orbital inclination of . In this configuration, the companion spends most of the time near its apastron position in the foreground along our line of sight (with a separation of roughly 29 AU). As periastron approaches (and the separation drops to 1.5 AU), the secondary passes beyond the plane of the sky, so that closest approach occurs when the secondary lies beyond the primary from our point of view. We show in Figure 5 three frames from an animation of one simulation888http://harmas.arc.hokkai-s-u.ac.jp/∼okazaki/cwb/eta_car/index.html. This portrays the wind density in the orbital plane for an isothermal model. The left frame shows a time near apastron when the secondary (right) is well separated from the primary (left) and a well-defined bow shock occurs at the wind - wind collision boundary. The dark line in the panel shows our direction of viewing (which lies below the plane of the diagram). The middle panel shows the configuration 21 d before periastron when the stars are much closer and the bow shock is situated very close to the primary. Finally the right panel shows the situation after periastron (a brief 42 d later) when the companion has moved counter-clockwise around the primary.
Madura et al. (2009) used similar hydrodynamical simulations to explore how the interaction affects the continuum light of the system when the stars are closest at periastron. They find that the fast wind of the secondary excavates a region of the dense wind of the primary. This “bore hole” effect first exposes to view the hotter and deeper wind layers and results in an episode of brightening. However, as the secondary progresses past periastron towards superior conjunction, the cavity region turns away from us and the system fades. The drop in flux continues past superior conjunction as the cavity reduces the effective volume of wind gas, and the system slowly returns to its original flux as the stars separate and wind material refills the cavity.
Let us now reconsider the H orbital variations in the context of these wind - wind collision models. The H emission forms in dense regions of wind (because the emission process is dependent on density squared) that are mainly found relatively close to the primary star (Hillier et al. 2001). As the companion approaches periastron, the bow shock from the colliding winds gets closer to the primary, and the developing cavity reduces the effective volume of the wind emission from the primary. The resulting H emitting volume will reach a minimum at periastron, but will then increase again as the binary separation increases and the wind is restored to the cavity region. Hillier et al. (2001) present a model for the wind of the primary star alone in which the continuum forming radius is approximately 3 AU (where the Rosseland optical depth is one) and the H formation peaks near a radius of 18 AU (see their Fig. 15). Based upon the momentum balance of the colliding winds, the wind - wind collision zone will occur at a distance from the primary of , where is the binary separation at time , and this reaches a minimum of 1 AU in the binary model (Okazaki et al. 2008). Thus, the colliding winds cavity should significantly reduce the volume of both the continuum and H emitting regions close to periastron. The fact that both the length and relative amplitude of the periastron variation is larger for H than for the continuum (Fig. 4) is consistent with the larger formation radius of the H emission. If we assume that periastron occurred when the H flux was a minimum at HJD 2,454,854 (the same periastron time within errors assumed by Madura et al. 2009 based on a fit of the continuum light curve), then the H flux began to decrease about 39 d before periastron (Fig. 4) when the model distance from the primary to the wind-wind shock was 3 AU. This is closer than the 18 AU H formation radius given by Hillier et al. (2001), but we suspect that a marked H reduction will only be observed once a significant fraction of the wind volume is carved out by the colliding winds (i.e., after the bow shock apex reaches to relatively deep within the wind). After periastron, as the colliding winds zone moves outward, the primary’s wind will re-occupy the volume opened by the fleeing cavity. Hillier et al. (2001) note that the wind flow time to the H formation region is about 100 d, which is comparable to the H flux recovery time that we observed (Fig. 4).
It is probable that the periastron interaction is also the cause of the H radial velocity variations observed at that time. We show in Figure 6 the measured H bisector radial velocity (Table 1) together with the expected Keplerian orbital velocity curve for the primary. Although there is a superficial resemblance, the observed curve has a much lower semiamplitude than expected. A similar change from blue-shift to red-shift around periastron has been reported for other lines but usually with a much larger amplitude than the orbital value (Nielsen et al. 2007; Damineli et al. 2008b). We doubt that the velocity shift observed in H is related to Keplerian motion, because the formation radius of the H flux is so large that any orbital motion vanishes due to conservation of angular momentum (i.e., all the motion becomes radial). However, we suspect that the close interaction at periastron may have a tidal influence on the wind of the primary causing the wind to become locally denser and slower along the instantaneous axis between the stars (a “focused wind”; Friend & Castor 1982). Since the H flux varies as density squared, this wind density enhancement would result in a slight excess in blue-shifted flux while the companion approaches from the near side of the plane of the sky and then a red-shifted excess around periastron as the companion moves beyond the plane of the sky. A full radiative transfer calculation will be required to test whether or not such a tidal enhancement can explain the timing and amplitude of the observed radial velocity variation.
The development of a P Cygni type absorption feature near a radial velocity of km s-1 around the time of periastron (Fig. 2) was also observed by Davidson et al. (2005) during the last two events, so it is probably related to the binary interaction. We suggest that the emergence of this absorption component results from a change in illumination by the hot companion. In the binary model, the hot companion resides in the foreground during most of the orbit, and the radiation from the companion probably tends to overionize the outer layers of the hemisphere facing us. However, as the binary approaches periastron, the companion will appear to set below the optically thick horizon as seen from a position in the outer layers of the wind facing our direction. The subsequent gas cooling will result in greater absorption by this wind material seen projected against the primary and will cause an increase in the blue absorption of the P Cygni line. Ironically, it is then during this brief time around periastron that we see the undisturbed, “normal” wind of the primary (at least in the sector directed towards us) with blue-shifted absorption lines that are more similar to the model predictions (Hillier et al. 2001) than observed at the other orbital phases when the hemisphere facing us is illuminated by the secondary star. Through scattered light spectroscopic studies of the Homunculus Nebula, Smith et al. (2003) found that the polar wind of the primary star exhibits a broad absorption plateau on the blue wing of the P Cygni profile. We see this same behavior in our data (Fig. 2), which suggests that we observe a less obstructed view of parts of the primary star’s wind during the spectroscopic event.
We suspect that this same change in secondary illumination is the cause of the sudden appearance of the anomalous, narrow absorption feature just prior to periastron (Fig. 2). This same increase in absorption strength was first observed during the 1981.5 event by Melnick et al. (1982), then again during the 1992.5 event by Damineli et al. (1998), and finally during the 2003.5 event (Fig. 3) by Davidson et al. (2005), so the phenomenon is clearly linked to the binary clock. This narrow absorption feature is probably formed farther out from the central binary because the feature appears in the spatially resolved, extended emission (see Fig. 15 of Gull et al. 2009) where the gas may be cooler (consistent with the fact that the anomalous absorption is weak or absent in the profiles of the upper Balmer lines; Weis et al. 2005; Nielsen et al. 2007). The feature has the same width and radial velocity as nebular absorption lines that are observed in the far-ultraviolet spectrum and that form in the Little Homunculus, an ionized gas cloud deep within the larger Homunculus Nebula (Ishibashi et al. 2003; Smith 2005; Gull et al. 2006). Since our view to central binary passes through the nearby wall of the Little Homunculus (see Fig. 2 of Nielsen et al. 2009), we suggest that the H anomalous absorption forms there. In the weeks prior to periastron, this part of the Little Homunculus is probably exposed to the ionizing radiation that escapes through the rarefied gas of the secondary star’s wind and surrounding bow shock that is oriented in our direction at that time. We suspect that this ionizing flux leads to a net reduction in the H absorption then because the hydrogen gas in the part of the Little Homunculus along our line of sight becomes over-ionized. However, as the secondary progresses towards periastron and the bow shock surface passes beyond our view to the primary, this source of ionizing flux would decrease suddenly (effectively blocked by the wind of the primary), and the net H absorption would then become much more effective. Such a decrease in the far ultraviolet flux was observed during the 2003.5 event by Iping et al. (2005), who argued that the flux decline resulted from an atmospheric eclipse of a hot companion. The fact that the H absorption features at velocities of km s-1 and km s-1 both appear at about the same time (Fig. 2) strongly supports the idea that both result from cooling associated with the temporary disappearance of the ionizing flux of the companion star. Although the wall of the Little Homunculus where the absorption forms lies about 16 light days closer to us than the primary star (Nielsen et al. 2009), the wall gas would “see” the drop in ionizing flux at about the same time that light arrives from the outer layers of the primary, so the increased absorption from the Little Homunculus will appear to us to occur at about the same time as that from the primary’s wind as long as the cooling timescale in the Little Homunculus is short (less than a day). This change in illumination probably also explains the apparent temperature drop in the excitation/ionization properties of iron-group element absorption lines from the Little Homunculus around the time of periastron (Gull et al. 2006).
These arguments suggest that the primary features of the H emission form in the extended wind of the primary that becomes truncated and asymmetrical around periastron. The reality is certainly more complicated, and, in particular, the wind collision models predict that high gas densities should occur in the vicinity of the bow shock near periastron. Given the density squared dependence of the H emission, it is somewhat surprising that we find no clear evidence of H emission from the bow shock region itself (where we might expect to find a component with a large radial velocity excursion as the bow shock quickly rotates around the primary at periastron). We suspect that the absence of a bow shock emission component may be due to the higher gas temperatures there (which would cause a decrease in emissivity; Ferland 1980) and/or the presence of intervening, dense gas of the primary star’s stellar wind that is too optically thick for the embedded bow shock flux to escape in our direction.
Our results support qualitatively the colliding winds model and, in particular, the predicted changes in the primary’s emitting wind structure that occur around periastron. A detailed comparison of the model predictions will require a 3D radiative transfer calculation of the H line intensities, a very computationally challenging task. Observations around periastron of other emission lines that form closer to the primary will also provide a good test of the validity of the basic picture of the system and its colliding winds. The 2009.0 event of Car has offered us the means to begin this kind of promising investigation. In a subsequent paper, we plan to examine other emission lines in the echelle data and to study their temporal variations around periastron. The timing and duration of line flux reductions for transitions formed at different radii will help us test the model of the migration of the cavity to inner regions of the primary star’s wind and will place observational constraints on the wind geometry and structure of Carinae.
References
- Corcoran (2005) Corcoran, M. F. 2005, AJ, 129, 2018
- Damineli et al. (1997) Damineli, A., Conti, P. S., & Lopes, D. F. 1997, NewA, 2, 107
- Damineli et al. (2000) Damineli, A., Kaufer, A., Wolf, B., Stahl, O., Lopes, D. F., & de Araújo, F. X. 2000, ApJ, 528, L101
- Damineli et al. (1998) Damineli, A., Stahl, O., Kaufer, A., Wolf, B., Quast, G., & Lopes, D. F. 1998, A&AS, 133, 299
- Damineli et al. (2008a) Damineli, A., et al. 2008a, MNRAS, 384, 1649
- Damineli et al. (2008b) Damineli, A., et al. 2008b, MNRAS, 386, 2330
- Damineli et al. (2009) Damineli, A., et al. 2009, IAU Circ., 9011, 1
- Davidson & Humphreys (1997) Davidson, K., & Humphreys, R. M. 1997, ARA&A, 35, 1
- Davidson et al. (2005) Davidson, K., et al. 2005, AJ, 129, 900
- Ferland (1980) Ferland, G. J. 1980, PASP, 92, 596
- Fernández Lajús et al. (2003) Fernández Lajús, E., Gamen, R., Schwartz, M., Salerno, N., Llinares, C., Fariña, C., Amorín, R., & Niemela, V. 2003, IBVS, 5477, 1
- Fernández-Lajús et al. (2010) Fernández-Lajús, E., et al. 2010, NewA, 15, 108
- Friend & Castor (1982) Friend, D. B., & Castor, J. I. 1982, ApJ, 261, 293
- Gaviola (1953) Gaviola, E. 1953, ApJ, 118, 234
- Gull et al. (2006) Gull, T. R., Vieira Kober, G., & Nielsen, K. E. 2006, ApJS, 163, 173
- Gull et al. (2009) Gull, T. R., et al. 2009, MNRAS, 396, 1308
- Hillier & Allen (1992) Hillier, D. J., & Allen, D. A. 1992, A&A, 262, 153
- Hillier et al. (2001) Hillier, D. J., Davidson, K., Ishibashi, K., & Gull, T. 2001, ApJ, 553, 837
- Howell et al. (2006) Howell, S. B., Walter, F. M., Harrison, T. E., Huber, M. E., Becker, R. H., & White, R. L. 2006, ApJ, 652, 709
- Humphreys et al. (2002) Humphreys, R. M., Davidson, K., & Smith, N. 2002, in Exotic Stars as Challenges to Evolution (ASP Conf. Vol. 279), ed. C. A. Tout & W. Van Hamme (San Francisco: ASP), 79
- Iping et al. (2005) Iping, R. C., Sonneborn, G., Gull, T. R., Massa, D. L., & Hillier, D. J. 2005, ApJ, 633, L37
- Ishibashi et al. (2003) Ishibashi, K., et al. 2003, AJ, 125, 3222
- Lépine et al. (1996) Lépine, S., Moffat, A. F. J., & Henriksen, R. N. 1996, ApJ, 466, 392
- Madura et al. (2009) Madura, T., Owocki, S., Gull, T., Okazaki, A., & Smith, N. 2009, in IAU XXVII General Assembly Joint Discussion 13: Eta Carinae in the Context of the Most Massive Stars, ed. A. Damineli et al., in press
- Melnick et al. (1982) Melnick, J., Ruiz, M. T., & Maza, J. 1982, A&A, 111, 375
- Nielsen et al. (2007) Nielsen, K. E., Corcoran, M. F., Gull, T. R., Hillier, D. J., Hamaguchi, K., Ivarsson, S., & Lindler, D. J. 2007, ApJ, 660, 669
- Nielsen et al. (2009) Nielsen, K. E., Vieira Kober, G., Weis, K., Gull, T. R., Stahl, O., & Bomans, D. J. 2009, ApJS, 181, 473
- Okazaki et al. (2008) Okazaki, A. T., Owocki, S. P., Russell, C. M. P., & Corcoran, M. F. 2008, MNRAS, 388, L39
- Parkin et al. (2009) Parkin, E. R., Pittard, J. M., Corcoran, M. F., Hamaguchi, K., & Stevens, I. R. 2009, MNRAS, 394, 1758
- Pittard & Corcoran (2002) Pittard, J. M., & Corcoran, M. F. 2002, A&A, 383, 636
- Shafter et al. (1986) Shafter, A. W., Szkody, P., & Thorstensen, J. R. 1986, ApJ, 308, 765
- Smith (2004) Smith, N. 2004, MNRAS, 351, L15
- Smith (2005) Smith, N. 2005, MNRAS, 357, 1330
- Smith et al. (2003) Smith, N., Davidson, K., Gull, T. R., Ishibashi, K., & Hillier, D. J. 2003, ApJ, 586, 432
- Stahl et al. (2005) Stahl, O., Weis, K., Bomans, D. J., Davidson, K., Gull, T. R., & Humphreys, R. M. 2005, A&A, 435, 303
- van Genderen et al. (2003) van Genderen, A. M., Sterken, C., & Allen, W. H. 2003, A&A, 405, 1057
- Weigelt & Ebersberger (1986) Weigelt, G., & Ebersberger, J. 1986, A&A, 163, L5
- Weis et al. (2005) Weis, K., Stahl, O., Bomans, D. J., Davidson, K., Gull, T. R., & Humphreys, R. M. 2005, AJ, 129, 1694
- Whitelock et al. (2004) Whitelock, P. A., Feast, M. W., Marang, F., & Breedt, E. 2004, MNRAS, 352, 447


| Date | Orbital | (H) | (H) | (H) | |
|---|---|---|---|---|---|
| (HJD - 2450000) | Phase | Spectrograph | (Å) | (Å) | (km s-1) |
| 4779.8615 | 11.969 | R-C | 678 | ||
| 4784.8577 | 11.972 | echelle | 650 | 650 | |
| 4786.8458 | 11.972 | R-C | 640 | 635 | |
| 4801.7878 | 11.980 | R-C | 599 | 611 | |
| 4803.7731 | 11.981 | R-C | 629 | 645 | |
| 4814.8012 | 11.986 | R-C | 639 | 652 | |
| 4818.8060 | 11.988 | echelle | 535 | 551 | |
| 4819.8108 | 11.989 | echelle | 550 | 569 | |
| 4821.8520 | 11.990 | echelle | 561 | 584 | |
| 4824.7536 | 11.991 | echelle | 561 | 589 | |
| 4829.7838 | 11.994 | echelle | 545 | 576 | |
| 4831.7530 | 11.995 | echelle | 518 | 559 | |
| 4836.7315 | 11.997 | echelle | 483 | 526 | |
| 4836.7444 | 11.997 | echelle | 498 | 542 | |
| 4838.7496 | 11.998 | echelle | 481 | 529 | |
| 4840.7721 | 11.999 | echelle | 447 | 496 | |
| 4841.7684 | 12.000 | echelle | 449 | 501 | |
| 4842.7673 | 12.000 | echelle | 428 | 477 | |
| 4843.7668 | 12.001 | echelle | 436 | 491 | |
| 4844.7694 | 12.001 | echelle | 439 | 494 | |
| 4845.7581 | 12.002 | echelle | 438 | 490 | |
| 4846.7611 | 12.002 | echelle | 447 | 500 | |
| 4847.7971 | 12.003 | echelle | 429 | 471 | |
| 4848.7348 | 12.003 | echelle | 424 | 463 | |
| 4849.7148 | 12.004 | echelle | 435 | 470 | |
| 4850.7272 | 12.004 | echelle | 435 | 464 | |
| 4851.7129 | 12.005 | echelle | 434 | 456 | |
| 4852.7313 | 12.005 | echelle | 468 | 486 | |
| 4853.7222 | 12.006 | echelle | 437 | 447 | |
| 4854.7335 | 12.006 | echelle | 466 | 475 | |
| 4855.7283 | 12.007 | echelle | 459 | 458 | |
| 4857.7714 | 12.008 | echelle | 472 | 463 | |
| 4858.7605 | 12.008 | echelle | 471 | 463 | |
| 4859.7681 | 12.009 | echelle | 463 | 455 | |
| 4861.7205 | 12.010 | echelle | 474 | 468 | |
| 4862.7332 | 12.010 | echelle | 480 | 470 | |
| 4863.7529 | 12.011 | echelle | 488 | 479 | |
| 4865.7026 | 12.011 | echelle | 464 | 459 | |
| 4866.7104 | 12.012 | echelle | 474 | 472 | |
| 4867.7011 | 12.012 | echelle | 454 | 453 | |
| 4875.6456 | 12.016 | echelle | 455 | 472 | |
| 4879.6545 | 12.018 | echelle | 455 | 477 | |
| 4880.6719 | 12.019 | echelle | 440 | 461 | |
| 4881.6680 | 12.019 | echelle | 457 | 483 | |
| 4883.5776 | 12.020 | R-C | 429 | 462 | |
| 4897.5556 | 12.027 | R-C | 398 | 462 | |
| 4902.5327 | 12.030 | R-C | 406 | 471 | |
| 4926.5314 | 12.042 | R-C | 414 | 475 | |
| 4938.4690 | 12.047 | R-C | 453 | 526 | |
| 5032.5139 | 12.094 | R-C | 445 | 588 |