Photometry of the Scuti star HD 40372
Abstract
We present B band photometry of the Scuti star HD 40372 using the ARIES three channel fast photometer attached to the -cm Sampurnanand telescope in high-speed photometric mode. The star was observed for 5 hours on December 13, 2008. Based on the high quality photometric data, we have done period analysis by various periodogram analysis techniques. The best estimate of the period is found to be days. With this period and the other stellar parameters determined from photometry available in the literature, we have calculated the value for the star. Comparison of this value with that determined from the model calculations shows that the star is pulsating in p3 mode with .
keywords:
stars: variables: Scuti; stars: oscillation; instrumentation: photometers; techniques: photometric1 Introduction
Pulsating stars play an important role in probing the physical properties of stars, including their masses, luminosities, temperatures and metallicities. Pulsating stars exist over a broad range of stellar parameters and evolutionary stages. The existence of pulsating stars as components of binary systems has drawn a considerable attention in the recent past because binary stars provide useful information on the physical properties of the components such as masses and radii. In addition, the pulsating component offers an independent way of estimating its parameters such as the pulsation constant which is useful for identification of modes (Derekas et al. 2009).
Scuti stars are short period pulsating variables located in the lower part of the classical instability strip on or above zero age main sequence (ZAMS) in the Hertzsprung-Russell (HR) diagram with masses ranging from 1.0 to 3.0 M⊙. The typical time scales of these oscillations range from few minutes to some hours (from 18 min to 8 h) (Breger 2000). Since the time scale of oscillations of these class of stars is short and they are bright, the time sampling of the light curves is of the order of few tens of seconds and requires fast photometry.
These variables are spectral type A to F dwarfs or sub giants that have not yet reached the red giant branch and hence are mainly moderately evolved objects (Alcock et al. 2000). The majority of these variables pulsate with very low amplitudes, ranging from 0.01 mag to several tenths of a mag in V with non-radial, low-degree ( 3) and low order (k = 0 to 6) p modes (Dawson et al. 1995). Some are radial pulsators and some others also pulsate in a mixture of radial and non-radial modes (Breger et al. 1999). A list of pulsating Scuti stars in stellar systems can be found in Lampens & Boffin (2000). More recent complete list of Scuti stars detected in eclipsing binary systems are given in Rodríguez et al. (2004).
HD 40372 has a V magnitude of 5.904 mag and is located at = 05h 58m 24s.44 and = +01o 50 13.59 (Epoch J2000). The star has a spectral type A5me. The Strőmgen indices of HD 40372 are and Hβ = 2.806 (Hauck & Mermilliod 1998) . The star belongs to a spectroscopic binary system with orbital period of 2.74050 days (Nadeau 1951). Also, there are light curve data from Hipparcos photometry with the listed orbital period of 2.74068 days. One of the components of the star HD 40372 was discovered to be a Scuti star by Breger (1973) having a pulsation period of 0.054 days. In a study of this star, Liu (1999) reported a photometric pulsation period of 0.062 days (16.461 c/d) and amplitude of 10.93 mmag in the Strőmgen filter. Their period determination is not so accurate and does not fit the light curve data well. On the other hand, a period of 0.061 day and and an amplitude of 0.02 (V band) has been catalogued in Rodríguez and Breger (2001).
In this paper, we provide highly accurate photometric B band out-of-eclipse data of the pulsating component of HD 40372. The star was observed for a duration of 5 hours in highly photometric sky conditions. In Section 2, we describe the observation and data reduction procedure. Section 3 deals with the analysis of the light curve. In Section 4, we derive the various physical parameters of the star from the available photometry in the literature and the pulsational constant. In Section 5, we present the conclusions of our study.
2 Observation and data reduction
The star HD 40372 was observed in a clear sky condition on December 13, 2008 using the three-channel fast photometer attached to the -m Sampurnanand telescope at ARIES in an out-of-eclipse phase. Details of the photometer are available in Ashoka et al. (2001) and Gupta et al. (2001). The time series photometric observations consist of continuous 10s integrations through a Johnson B filter. An aperture of 30 arc-second is used to minimize the flux variations caused by seeing fluctuations and tracking drift. Large diaphragm is also used in order to diminish the noise caused by the wings of the stellar image. Manual guiding after every 2 to 3 minutes ensured high quality of centering of the star in the diaphragm. The sky background is measured in a non-regular fashion to avoid periodic break in the light curve. The sky background is measured by interpolating the points with a piece wise linear function. The raw data are corrected for the dead time counts (T = 23ns), sky background and mean atmospheric extinction. The bad data points of the light curve are visually inspected and removed during the data reduction process. Finally, the data sets are expressed as Heliocentric Julian Day (HJD) versus fractional magnitude with respect to the mean magnitude of the light curve.111The observational data presented in this paper can be obtained from the authors on request. The processed light curve is shown in the upper panel of Fig. 1.
3 Analysis of the light curve
3.1 Detrending the data
From Fig. 1 (upper panel), it is clearly seen that there is a slow trend present in the data. This trend in the data arises mainly due to the change in the sky transparency and/or change in the air-mass during the time of observations and may be because of the use of single channel of the photometer. In general, single channel photometry is not ideal for measuring the brightness changes of variable stars. However for bright and short period variable stars, such as Scuti stars, under good photometric sky conditions, this technique of measuring the magnitude changes can be shown to be adequate. In a work by Joshi et al. (2003), it was in fact seen that single channel photometry can be used for measuring light variations of short period variable stars in favourable sky conditions.
The processed light curve data are detrended by subtracting out the slow trends using a second order polynomial fit of the form , where is the time of observations and are the coefficients determined from the fit. The procedure removes the slow trends in the data. In the lower panel of Fig. 1, we show the detrended data.

3.2 Period determination
There are a number of period determination techniques available for determining the periodicity in a time series data. We have estimated the period of HD 40372 using a number of algorithms. The various periodogram analysis techniques were applied in order to see the consistency of the result. We have calculated the period of HD 40372 using the following algorithms:
-
(1)
Period04 algorithm (Lenz & Breger 2005)
-
(2)
Discrete Fourier Transform (DFT) algorithm (Deeming 1975)
-
(3)
Non-linear least square fit (NLSQ) method (Press et al. 1992)
-
(4)
Lomb & Scargle (LS) periodogram (Lomb 1976, Scargle 1982, Horne & Baliunas 1986)
-
(5)
CLEAN algorithm (Roberts et al. 1987)
-
(6)
Phase dispersion minimization (PDM) technique (Stellingwerf 1978)
-
(7)
Multi-harmonic ANOVA (MULTIH) algorithm (Schwarzenberg-Czerny 1996)
-
(8)
Minimization of information entropy (ME) method (Cincotta, Mndez & Nez 1995).

For finding multiple frequencies in the time series data, the methods such as Period04 and DFT are very much efficient. We have used Period04 method in order to search for multiple periodicities. To search for multiple periodicities in the data, the data corresponding to the sinusoid of the first detected frequency are subtracted from the original data which is generally called ‘pre-whitening’ of the data. Period analysis is now carried out on the residual data and the next frequency is identified. This procedure is repeated until no significant frequencies are left in the data. In order to search for statistically significant frequency in the time series data, we have used the criterion of Breger et al. (1993) that an amplitude signal to noise ratio () should be greater than 4.0 to judge the reality of a peak in the amplitude spectrum. It consists of calculation of the of the frequency in the periodogram. This is done by finding the highest amplitude of the peak for the frequency obtained and the noise as the average amplitude in the residual periodogram in a frequency range that encloses the detected peak after the detected frequency is pre-whitened. In Fig. 2, we show the amplitude spectrum of the HD 40372 obtained from Period04. The amplitude spectrum peaks at 15.36492 0.02106 c/d with amplitude 0.01232 0.00010 mag (upper panel). Also shown is the corresponding noise level of the peak. The noise level is at 0.00098 mag yielding a of 12.620. The noise level is calculated in the frequency range from [frequency-boxsize/2.0 ,frequency+boxsize/2.0]. We have chosen boxsize = 20. We have also detected another frequency at 11.52369 c/d (lower panel of Fig. 2). SNR of this peak is 4.0. The reality of the peak is suspicious as it lies on the boundary of the Breger’s criterion and because of the short span of observations. We check the presence of the most dominant peak in the periodogram by means of other periodogram analysis techniques: DFT, NLSQ, LS, CLEAN, PDM, MULTIH and ME methods. Since a frequency peak near 15.36492 c/d is found to be present in all of the periodograms, it is taken to be the real and most dominant frequency of the data.
| Method | [days] | Amplitude [mag]∗ | ||
|---|---|---|---|---|
| Period04 | 0.06508 | 0.01267 | 0.00248 | 0.00120 |
| DFT | 0.06539 | 0.01279 | 0.00237 | 0.00108 |
| NLSQ | 0.06782 | 0.01356 | 0.00208 | 0.00094 |
| LS | 0.06548 | 0.01283 | 0.00234 | 0.00100 |
| CLEAN | 0.06392 | 0.01221 | 0.00296 | 0.00140 |
| PDM | 0.06726 | 0.01344 | 0.00204 | 0.00094 |
| MULTIH | 0.06717 | 0.01342 | 0.00204 | 0.00089 |
| ME | 0.06732 | 0.01346 | 0.00204 | 0.00095 |
*Determined from the Fourier fit to the phased light curve as described in Section 3.3. is the variance of the noise after the signal has been subtracted, is the error in the period.


In Table 1 we list the period of HD 40372 as determined by the various methods mentioned above. The final best estimate of the period days is obtained by the ME method. We search for the best period around 10% of an approximate period as determined by the other methods in steps of 10-5 days to calculate the period correct up to five decimal places. ME method, in principle, allows to compute periods with a higher numerical precision, since it is based on proper ordering of the light curve points in the phase-magnitude space with the true period corresponding to the minimum of the entropy. Also in comparison with other methods, this method is computationally straightforward and very fast, just requiring counting points within a binning scheme (Cincotta, Mndez & Nez 1995). Methods such as ME and string length (Dworetsky 1983) are, in general, used to improve the period determined by other techniques (cf. Derekas, Kiss & Bedding 2007).
In Fig. 3, we plot the fit to the data with frequency 14.74540 c/d obtained from the NLSQ method. Fig. 4 shows the LS power spectrum with peak at c/d corresponding to a frequency of 15.27076 c/d. In case of the Scargle periodogram (Fig. 4), two other peaks are detected with confidence level larger than 99%. However, the existence of these multiple frequencies in the data needs to be confirmed by observations spanning over a longer time.
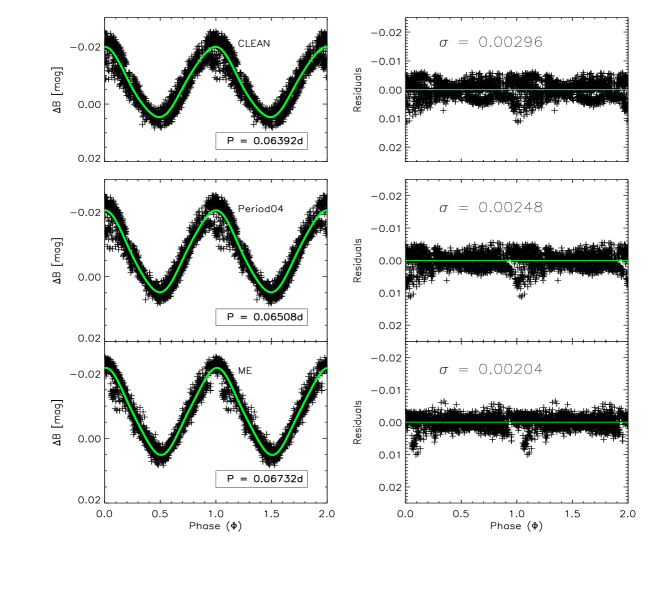
Fig. 5 shows the power spectra of HD 40372 obtained by MULTIH, DFT, PDM and CLEAN methods. In Fig. 6, we plot the information entropy (S) versus Period () for HD 40372 obtained from the ME method. In the left panels of Fig. 7, we plot the light curve of HD 40372 phased with the three periods 0.064, 0.065 and 0.067 respectively. The residuals of the fitted light curves are shown in the corresponding right panels of Fig. 7. The of the residuals is the least for days which is taken to be the best period estimate.

3.3 Error Estimates
Estimation of error () in the period determination is an important task to check the reliability of the period determined by various methods. As described in the above, we have estimated period by the various techniques available in the literature. Some of the period determination techniques give nearly identical results, whereas, the others differ by an insignificant amount in the third decimal places. True and precise period is, in fact, the one which gives a smooth and well-ordered light curve when phased with it, whereas, other periods will give disordered and scattered light curves when phased with them. Since the determination of errors by the various methods are different, we adopt the following common technique for finding error in the period obtained from various techniques :
Firstly, the light curve is phased with the respective periods determined by the various techniques. Then, individual phased light curves are fitted with a Fourier series of third order of the form as described in next section so that the residuals consist of noise only. From each of the fitted light curves, amplitude of the signal (A), variance () of the noise after the signal has been subtracted, are calculated. The error in the period is then calculated by the following formula (Kovács 1981, Horne & Baliunas 1986):
| (1) |
or
| (2) |
where is the angular frequency, is the number of data points, is the total length of the data. In table 1, we list the values of A, of the residuals and the errors in the period obtained by the above technique. In the present case, and hours. From Table 1, It should be noted that the error in the period is least for period days.
3.4 Pulsation parameters
The pulsation parameter of HD 40372 is described by decomposing its phased light curve in the following form :
| (3) |
where ) is the phased light curve and is defined by:
| (4) |
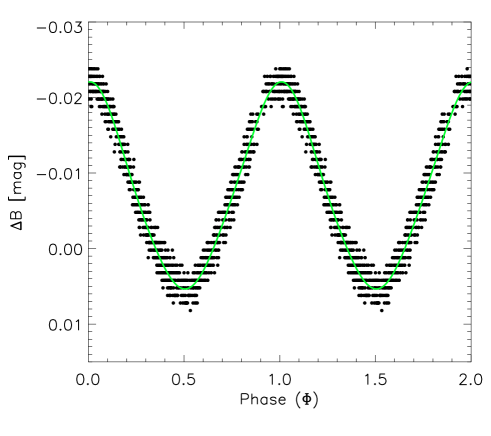
The value of is from 0 to 1, corresponding to a full cycle of pulsation and denotes the integer part of the quantity. The zero point of the phase corresponds to the time of maximum light (). is the mean magnitude, is the time of observations and is the period of the star in days. In Fig. 8, we plot the phased light curve obtained with period 0.06732 days. Points lying 2 away from the fit to the data are removed using a multi-pass nonlinear fitting algorithm in IDL (Interactive data language). The solid line is the 3rd order Fourier fit to the outlier-removed data.
In Table 2, we list the Fourier parameters ’s and ’s determined by using the period as estimated by the minimization of entropy method.
| ID | Period (in days) | |||||||
|---|---|---|---|---|---|---|---|---|
| (1) | (2) | (3) | (4) | (5) | (6) | (7) | (8) | (9) |
| HD 40372 | 0.06732 | -0.00764 | -0.01330 | -0.00034 | -0.00071 | -0.00017 | -0.00038 | -0.00014 |
| 0.00095 | 0.00025 | 0.00024 | 0.00024 | 0.00024 | 0.00024 | 0.00024 | 0.00024 |
4 Physical parameters and evolutionary status
We make use of the photometry from Hauck & Mermilliod (1998) to estimate some of the fundamental physical parameters of HD 40372 including absolute magnitude, the effective temperature, radius and surface gravity. Using the model-atmosphere calibrations of photometry by Moon Dworetsky (1985) and later modified by Napiwotzki et al. (1993) , we obtain the following physical parameters Teff = 7706 K, Mv = 1.23 , R = 2.78 0.21R ⊙, .

The mass can be calculated from Cox (1999):
| (5) |
where M. A bolometric correction BC = 0.03 is calculated from Flower (1996) corresponding to the derived temperature of 7706 K. From the above equation we get an estimate of mass as M = 2.15 0.02 M⊙. In Fig. 9, we plot the position of HD 40372 in the HR diagram. The evolutionary tracks222http://owww.phys.au.dk/jcd/emdl94/eff_v6/ of mass ranging from 1.5M⊙ to 2.5M⊙ are over-plotted for composition X = 0.692827 and Z = 0.02 (Christensen-Dalsgaard 1993). We also estimate mass from the evolutionary tracks. With Teff = 7706 30 K and log (L/L⊙)= 1.40 0.08 , we derive an evolutionary mass of 2 M⊙ which is comparable to the mass determined from Eqn. (5).
The pulsational constant of a star can be used to identify the pulsational mode of a star. The value of a pulsating star is given by the following relation (Breger & Bregman 1975):
| (6) |
Substituting the value of days with the calculated physical parameters as described above leads to = 0.01746 0.00302. In order to identify the pulsational mode of the star HD 40372, we compare the observed value with the theoretical calculations of Fitch (1981). The 2.5M65 model in the Fitch’s Table 2C shows the possible solution with , p3 mode for the frequency pattern of HD 40372. However, the uncertainty in the value calculated from Eqn. (4) is very large. According to Breger (1990), value calculation from the above relation contains an error of 18%. Therefore it is very difficult to find mode accurately with value alone. Simultaneous color measurements would be helpful to determine the mode of HD 40372 more accurately.
5 CONCLUSIONS
In this paper, we have presented a good B band photometric data of HD 40372. We have done period analysis using a number of periodogram analysis techniques. Final best estimate of the period is obtained by the use of minimization of entropy method. We have determined the value of the star using the best determined period along with the other physical parameters determined from the photometry using a code developed by Moon & Dworetsky (1985) and later modified by Napiwotzki et al. (1993). The value indicates that the star is pulsating in the non-radial p3 mode with .
6 ACKNOWLEDGEMENT
The authors would like to thank ARIES for making the telescope time available on the -cm Sampurnanand telescope. SD thanks CSIR, Govt. of India for a Senior Research Fellowship (SRF). The authors thank Dr. Mike Dworetsky for providing the and code. The extensive use of the SIMBAD and ADS databases operated by the CDS center, Strasbourg, France is gratefully acknowledged. The authors thank the anonymous referee for useful comments and suggestions.
References
- [1] Alcock C. et al., 2000, AJ, 536, 798
- [2] Ashoka B. N. et al., 2001, JApA, 22, 131
- [3] Breger M. et al., 1993, A&A, 271, 482
- [4] Breger M., 1973, A&A, 22, 247
- [5] Breger M., Bregman J. N., 1975, ApJ, 200, 343
- [6] Breger M., 1990, CoAst. 20, 1
- [7] Breger M. et al., 1999, A&A, 349, 225
- [8] Breger M., 2000, ASP Conf. Ser., 210, 3
- [9] Cincotta P. M., Mndez M. & Nez J. A., 1995, APJ, 449, 231
- [10] Cox A. N., 1999, Allen’s Astrophysical Quantities, Fourth Edition, AIP press, Springer.
- [11] Christensen-Dalsgaard J., 1993, ASPC, 40, 483
- [12] Dawson D. W., Breger M., López de Coca P., 1995, PASP, 107, 517
- [13] Deeming T. J., 1975, Ap&SS, 36, 137
- [14] Derekas A., Kiss L. L., Bedding T. R., 2007, ApJ, 663, 249
- [15] Derekas A. et al., 2009, MNRAS, 394, 995
- [16] Dworetsky M. M., 1983, MNRAS, 203, 917
- [17] Fitch W. S., 1981, ApJ, 249, 218
- [18] Flower P. J., 1996, ApJ, 469, 355
- [19] Gupta S. K. et al., 2001, BASI, 29, 479
- [20] Hauck B., Mermilliod M., 1998, A&AS, 129, 431
- [21] Horne J. H. & Baliunas S. L., 1986, ApJ, 302, 757
- [22] Joshi S. et al., 2003, MNRAS, 344, 431
- [23] Kovács G., 1981, AP&SS, 78, 175
- [24] Lampens P., Boffin H. M. J., 2000, ASPC, 210, 390
- [25] Lenz P., Breger M., 2005, CoAst., 146, 53
- [26] Liu Y. Y., 1999, IBVS, No. 4741
- [27] Lomb N. R., 1976, Ap&SS, 39, 447
- [28] Moon T. T., Dworetsky M. M., 1985, MNRAS, 217, 305
- [29] Nadeau P. -H., 1951, PDDO, 1, 537
- [30] Napiwotzki R., Schnberner D., Wenske V., 1993, A&A, 268, 653
- [31] Press W., Teukolsky S., Vetterling W., & Flannery B., 1992, Numerical Recipes in FORTRAN (2nd ed.), Cambridge Univ. Press
- [32] Roberts D. H., Lehr J. & Dreher J. W., 1987, AJ, 93, 968
- [33] Rodríguez E., Breger M., 2001, A&A, 366, 178
- [34] Rodríguez E., García J. M., Mkrtichian D. E. et al., 2004, MNRAS, 347, 1317
- [35] Scargle J. D., 1982, ApJ, 263, 835
- [36] Schwarzenberg-Czerny A., 1996, ApJ, 460, 107
- [37] Stellingwerf R. F., 1978, ApJ, 224, 953