Ultraviolet-Selected Field and Pre-Main-Sequence Stars Towards Taurus and Upper Scorpius ††footnotetext: Accepted for publication in The Astronomical Journal. © 2010. The American Astronomical Society. All rights reserved.
Abstract
We have carried out a Galaxy Evolution Explorer (GALEX) Cycle 1 guest investigator program covering 56 square degrees near the Taurus T association and 12 square degrees along the northern edge of the Upper Scorpius OB association. We combined photometry in the GALEX FUV and NUV bands with data from the Two Micron All Sky Survey to identify candidate young ( Myr old) stars as those with an ultraviolet excess relative to older main sequence stars. Follow-up spectroscopy of a partial sample of these candidates suggest 5 new members of Taurus, with 8-20 expected from additional observations, and 5 new members of Upper Scorpius, with 3-6 expected from additional observations. These candidate new members appear to represent a distributed, non-clustered population in either region, although our sample statistics are as of yet too poor to constrain the nature or extent of this population. Rather, our study demonstrates the ability of GALEX observations to identify young stellar populations distributed over a wide area of the sky. We also highlight the necessity of a better understanding of the Galactic ultraviolet source population to support similar investigations. In particular, we report a large population of stars with an ultraviolet excess but no optical indicators of stellar activity or accretion, and briefly argue against several interpretations of these sources.
1 Introduction
Stellar populations associated with most nearby star-forming regions tend to be a few Myr old, while molecular clouds are asserted to have lifetimes of 10 Myr or more. If clouds are long-lived, a subject of current debate (McKee & Ostriker, 2007, and references therein), and they form stars for a significant fraction of their lifetimes, known young stars should represent only a small portion of a given association. The absence of an observed population of 3-10 Myr old stars associated with star-forming regions is known as the post-T-Tauri star problem (Herbig, 1978; Feigelson, 1996). Confirmation of a lack of older association members would place strong constraints on the evolution of molecular clouds, while discovery of a Myr old population would allow new probes of clouds’ star formation histories, overall star formation efficiencies, and circumstellar disk evolution (Feigelson & Montmerle, 1999). However, many surveys are biased toward few Myr old objects, or are restricted to small areas around molecular clouds where the population should be dominated by very young stars that have not had time to migrate away.
All stars cooler than type F and younger than Myr are prominent soft X-ray sources (Feigelson & Montmerle, 1999), and the advent of sensitive X-ray observatories has made large area X-ray surveys the natural tool to probe young stellar populations of all ages (Wichmann et al., 1996; Preibisch et al., 2005; Güdel et al., 2007, among many others). Because stars show little evolution in their X-ray properties until they are 100 Myr old, X-ray data alone cannot distinguish a 3 Myr old pre-main sequence star from a 100 Myr old main sequence star. As a result, X-ray surveys of an association can be heavily contaminated by unrelated field stars (Briceño et al., 1997) and any such survey requires spectroscopic confirmation.
X-ray emission is a tracer of coronal activity, and other stellar activity indicators can in principle be used to identify young stars as well. In particular, the chromospheres and transition regions of active stars produce ultraviolet emission from a variety of lines (Linsky et al., 2001). Chromospheric activity, as traced by the Ca II lines at 3934 and 3968Å, has a similar dependence on age as X-ray emission, remaining constant up to Myr and decaying together with rotation speed in older stars (Mamajek & Hillenbrand, 2008). This makes it a viable youth indicator except among early F or hotter stars, where chromospheric activity shows no correlation with either rotation (Simon & Landsman, 1991) or age over the range 50 Myr-3 Gyr (Rachford, 2000), and among M stars, where activity remains constant for almost a Gyr (Preibisch & Feigelson, 2005). Ultraviolet surveys of chromosphere emission, like X-ray surveys and most other young star search techniques, require spectroscopic follow-up to distinguish the youngest stars from 100 Myr old active field stars.
The Galaxy Evolution Explorer (GALEX), launched in 2003, is an ideal instrument for wide-field ultraviolet surveys. GALEX images the sky in a far-ultraviolet (FUV, 1344-1786Å) and a near-ultraviolet (NUV, 1771-2831Å) band over a circular field of view more than a degree across. The observatory’s microchannel plate detectors can reach 20th magnitude point sources in 100 seconds, while the ″ PSF provides acceptable resolution for the sparse fields of young stellar associations. GALEX can observe for at most 28 minutes of each 99 minute orbit.
As we show in section 2.1, a 300 s GALEX exposure can detect the chromospheres of active main sequence stars at down to type K2 in the nearest star-forming regions. GALEX thus requires 316 s deg-2 to carry out a survey. For comparison, the EPIC-pn camera on XMM-Newton, the most sensitive soft X-ray imager currently in orbit, can detect the same K2 star ( erg cm s-2, assuming ) in 260 s (Ness et al., 2009, section 3.3.8). However, EPIC-pn has a much smaller field of view, requiring 1290 s deg-2 to survey a given region. Even correcting for GALEX’s poor duty cycle, and the resulting shortage of observing time, GALEX effectively requires 1120 s deg-2, while XMM (given 40 usable hours each 48-hour orbit) requires 1550 s deg-2. For solar-type stars in nearby star forming regions, then, GALEX has a slightly higher survey efficiency than X-ray observatories.
The Taurus T association and the Upper Scorpius OB association represent the two nearest regions of recent star formation, both about 140 pc away and 35 pc across. Taurus is the prototype low-mass star forming region, with known members mostly G, K, or M stars less than 2 Myr old (Feigelson, 1996; Kenyon et al., 2008). Taurus still contains of molecular gas with a highly filamentary structure; the T association is dominated by subgroups of stars associated with the densest regions of this gas, although there are a handful of members scattered over a larger area. Slesnick et al. (2006) have identified a new population of pre-main-sequence stars east of the known Taurus association () and suggest the full spatial distribution has not yet been explored. Upper Scorpius, in contrast, is a classic high-mass star forming region. Stellar ages are consistent with a single burst of star formation 5 Myr ago (Slesnick et al., 2008), possibly triggered by the nearby Upper Centaurus-Lupus association (Preibisch & Mamajek, 2008), and any gas has already been blown out. Unlike Taurus, the Upper Scorpius association has no apparent structure.
We construct a toy model to estimate the number of post-T-Tauri stars hotter than type K2 we might find in a survey of the sky around these two regions. We assume that stars form at a constant rate over a disk on the sky of angular radius . A generation of stars of age will have spread into a uniform disk of radius , where is the velocity dispersion of the association. If the region has been constantly forming stars since some time before the present, the density of stars seen at some distance from the center of the association is
| (1) |
This model can also be applied to a region that stopped forming stars at some time before the present, as long as hypothetical stars younger than have not had time to migrate to .
We approximate the Upper Scorpius region as a disk with centered on , although this excludes some outlying members; Kraus & Hillenbrand (2007a) find 34 K2 or hotter members within this circle, giving a mean star formation rate of 7 Myr-1. Most of our survey fields are 8° from the center of the circle. The model predicts that a significant population will appear in these fields only if the region has been forming stars for at least 11 Myr. After 15 Myr, the density there would be 0.1 deg-2; after 30 Myr, it would be 0.3 deg-2. We can likewise model Taurus as a disk with centered on , containing 6 members of type K2 or earlier, though this not only cuts off outliers but ignores the significant internal structure of the association. Many of our fields are also from the disk center; a significant population should appear in them after 8 Myr. After 15 Myr, the density of K2 or earlier stars should be 0.07 deg-2; by 30 Myr, the density approaches its asymptotic value of 0.15 deg-2. In the case of both Taurus and Upper Scorpius, a survey covering several dozen square degrees should detect post-T-Tauri stars if they are present.
2 Our GALEX Survey
2.1 Sensitivity
Modest exposures with GALEX are sensitive to stars as late as G- or K-type at 140 pc, depending on the degree of ultraviolet excess and the degree of extinction. To quantify this limit, we found GALEX magnitude limits (Table 1) using the GALEX Exposure Time Calculator111http://sherpa.caltech.edu/gips/tools/expcalc.html for exposures of 300 s, 1000 s, and 1500 s, which cover the range of exposure times used by our observations presented in section 2.2. For comparison we also give the sensitivity for the GALEX All-Sky-Survey (AIS) exposure time of 100 s.
In section 3.1, we use the Two-Micron All-Sky Survey (2MASS, Cutri et al., 2003) to characterize our GALEX sources, introducing a second set of sensitivity limits. The Explanatory Supplement to the 2MASS All Sky Data Release (Cutri et al., 2008) gives completeness limits both for all detected point sources and for a subset with a photometric quality of A. Both limits are given in Table 2. Since we require only C quality photometry from our 2MASS sources, we expect the completeness limit of our sample to be somewhere between the two values in Table 2. By comparing the location of our fields to figures 7, 9, 22, and 24 from Cutri et al. (2008, section VI.7.a), we find these limits are unaffected by our fields’ proximity to the Galactic plane.
We compare the limiting magnitudes of the GALEX and 2MASS data to the main sequence magnitudes found in appendix A. Assuming a distance to both Taurus and Upper Scorpius of 140 pc, a 300 s GALEX exposure can detect unextinguished photospheres down to spectral type F8 in the FUV and K5 in the NUV. However, both Taurus and Upper Scorpius have significant extinction. Assuming and for (Gil de Paz 2007, private communication), we can detect stellar photospheres as long as they have an extinction less than that given in the first two columns of Table 3. The 2MASS data are sensitive down to spectral type M, even with extinction, so they do not affect our overall sensitivity.
As we show in section 2, our procedure cannot reliably identify excesses below mag in the FUV and mag in the NUV. Therefore, the sensitivity of GALEX does not begin to affect our results until stars with this minimum excess cease to be detectable. The extinctions at which this occurs are given in the last two columns of Table 3. in our Taurus fields is typically less than 3 (Cambrésy, 1999), with the exception of the field TauAur_MOS23, where the L1529 dark cloud has extinctions ranging from 3-6. in our Upper Scorpius fields typically less than 2 (Preibisch & Mamajek, 2008). Therefore, our observations of stars of type K and later are limited by GALEX sensitivity. Under 2 magnitudes of extinction, GALEX can detect only those K4 stars with an NUV excess of at least 3.7 magnitudes, those M0 stars with an excess of at least 6.9 magnitudes, and those M2 stars with an excess of at least 8.7 magnitudes.
To estimate the excesses we expect from young stars, we take from Valenti et al. (2000) narrow-band continuum fluxes of T Tauri stars measured by IUE at 1760Å and 1958Å and assume the stars’ FUV and NUV magnitudes correspond to the 1760Å and 1958Å fluxes, respectively. The magnitudes are underestimates because broad-band photometry will pick up additional flux from emission lines. We estimate that those stars that Valenti et al. (2000) designate as accreting classical T Tauri stars (CTTS) typically have FUV excesses of 10-18 magnitudes and NUV excesses of 2-7 magnitudes. These stars should be detectable in either the FUV or the NUV down to spectral type K0 under magnitudes of extinction. Stars marked as non-accreting naked T Tauri stars (NTTS) can have excesses of up to 10 magnitudes in the FUV and up to 2 magnitudes in the NUV, although some show no continuum excess at all. A 2 magnitude NUV excess is too small for us to easily distinguish, but we can detect sources with an FUV excess of 5-10 magnitudes down to spectral type F8-G8.
2.2 Observations
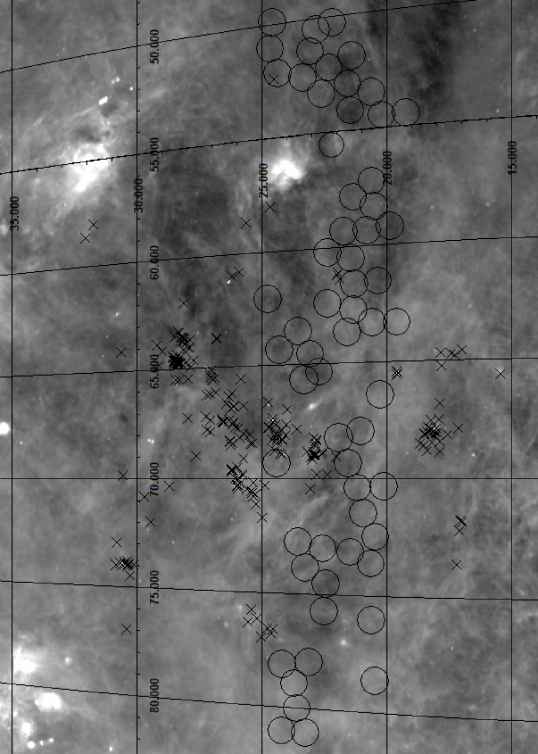
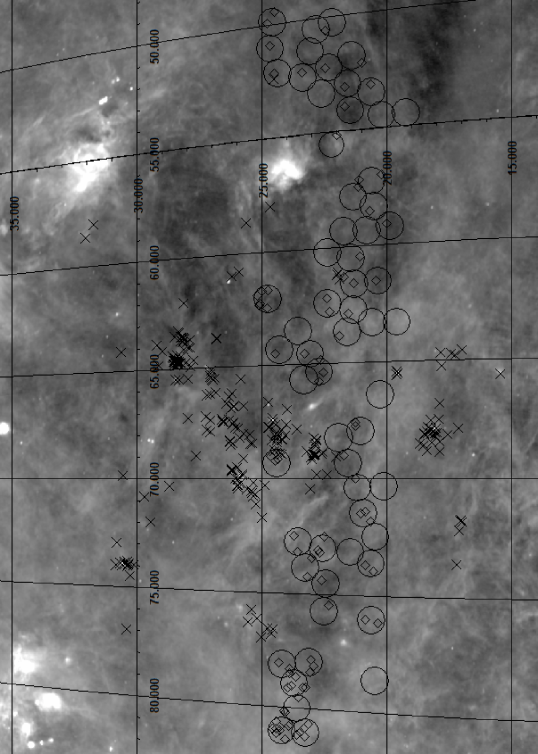
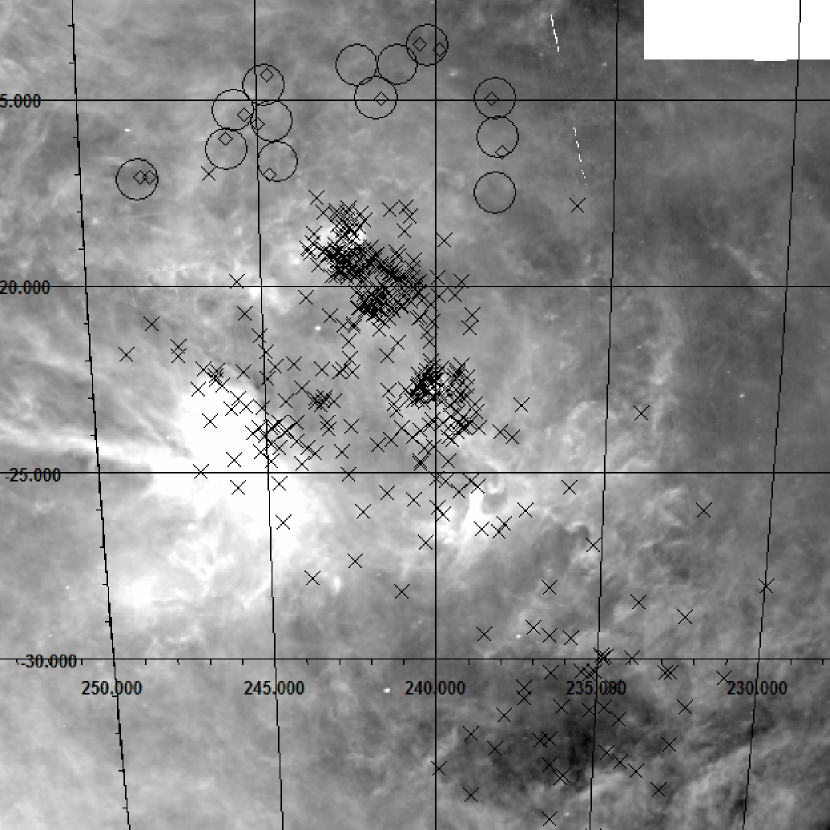
As part of our Cycle 1 proposal, GALEX imaged 61 fields, covering 56 square degrees, in southern Taurus in the FUV and NUV bands and 13 fields, covering 12.2 square degrees, in northern Upper Scorpius in only the NUV band. The fields were chosen to coincide with the survey area of Slesnick et al. (2006) and Slesnick et al. (2008). The observed fields are shown in figures 1 and 2. Because of concerns that bright stars or dense groups of stars might damage the detectors, GALEX avoids fields containing either; unfortunately, these are exactly the fields containing most of the known young stars in these regions. In particular, the observed Taurus fields are located south of the molecular cloud L1527, but north of L1551. We catch the eastern edge of L1529 but avoid L1536. The observed Upper Scorpius fields are located north of all major concentrations of known sources. Most of the pointings were taken in sets of five 300 s exposures of adjacent fields, but a few observations were instead scheduled as full-orbit exposures of 1100-1500 s. The observations are summarized in Table 4.
The observations were reduced automatically by the GALEX data release 2 and 3 pipeline (Morrissey et al., 2007) except for two orbits, TauAur_CH45 and TauAur_CH56, which were processed by an earlier pipeline version. We visually inspected the images and discarded those that were made unusable by clear artifacts or corrupted data.
Two fields, TauAur_CH11_0002_sv03 and TauAur_MOS23, had offsets in their astrometry solutions but no artifacts or signs of data corruption. We found mean astrometry corrections by comparing the positions of 8 bright NUV and 2MASS sources in each field, assuming a fixed offset independent of position on the detector. We found we needed to correct the source positions in TauAur_CH11_0002_sv03 by and those in TauAur_MOS23 by for the GALEX and 2MASS positions to agree. Residuals from the fixed offset (″) were larger than the scatter in GALEX-2MASS offsets in comparison fields (″) but showed no pattern. The latter is similar to the absolute astrometric precision of 0.49″ found by Morrissey et al. (2007). We applied the corrections to the positions of all GALEX sources in these two fields before considering cross-matches to other catalogs.
We adopted photometry from the band-merged SExtractor (Bertin & Arnouts, 1996) catalog produced by the GALEX pipeline. Because GALEX observations have low backgrounds, the pipeline used a customized background algorithm (Morrissey et al., 2007) rather than the one provided with SExtractor. The background was calculated as means over 128-pixel bins, iteratively clipping pixels having a probability of being Poisson fluctuations below . Bright sources were masked out using an initial SExtractor run. The background map was then linearly interpolated back up to the resolution of the image. The detection threshold map was calculated from the background map as the count rate above which a pixel had less than a 31.7% probability of being a Poisson fluctuation. Except where deblending was needed, SExtractor defined a source as a group of at least 10 adjacent pixels above the local detection threshold.
SExtractor found source fluxes by summing over an elliptical aperture with radius , which should enclose of a source’s light for both stars and galaxies (Bertin & Arnouts, 1996). Errors were calculated as where is the source area, is the background rms, is the source flux, and is the gain222http://www.ifa.hawaii.edu/r̃gal/science/sextractor_notes.html. We found that the catalog fluxes are consistent with wide (tens of arcseconds) aperture photometry performed on a trial field. We investigated but did not apply additional nonlinearity or color corrections to the catalog output, as such corrections are still highly uncertain (Wyder 2008, private communication).
For the remainder of our work we selected only GALEX sources that:
-
•
have flux measurements in at least one GALEX band
-
•
SExtractor determined to be a point source with 0.9 or higher probability in each detected band
-
•
are within 0.55° of the field center, where PSF variations are negligible, astrometric precision is uniformly high, detector efficiency is high, and artifacts are rare
-
•
do not have an artifact flag in the GALEX catalog
-
•
do not suffer any ambiguity in matching FUV and NUV sources
25389 ultraviolet sources in Taurus and 5863 in Upper Scorpius met these criteria. Over 99% of these are unique detections; the rest are multiple detections of sources located in areas of overlap between two GALEX fields.
3 UV Excesses
3.1 Reference photospheres
To characterize our sources, we matched them to data from the Two-Micron All-Sky Survey (2MASS, Cutri et al., 2003). We chose 2MASS photometry because it is a high quality, well-characterized data set, is available at low Galactic latitudes, and is less sensitive to extinction than visible photometry. We selected 2MASS sources that:
-
•
have C quality or better photometry in both and band, i.e. repeatable detections, flux measurements, and a source profile well fit by a single PSF
-
•
are not blended or contaminated in or band
-
•
are not in the 2MASS extended source catalog
-
•
are not associated with a known solar system object
-
•
are within 2″ of a GALEX source, the matching radius recommended by Morrissey et al. (2007)
20045 of the 25389 Taurus GALEX sources and 4210 of the 5863 Upper Scorpius sources had 2MASS counterparts, after removing 184 duplicate GALEX observations from the Taurus sample. There were no duplicates in the Upper Scorpius sample because there were very few overlapping GALEX fields. Figure 3 shows the GALEX-2MASS match fraction as a function of color, which is relatively insensitive to extinction: for (Gil de Paz 2007, private communication). Many of the GALEX sources with no 2MASS counterpart have , the colors expected of star-forming galaxies or B or early A stars. Both types of objects are often too distant to be detected by 2MASS. Even among the redder GALEX sources lack 2MASS counterparts. These may simply be sources that were rejected by our quality control criteria.
After the merged sources were placed on vs. color-color diagrams (section 3.2), we found that the source distribution changes rapidly near . Brighter sources tend to form a clear main sequence, as shown in Figure 4, while fainter sources form a different distribution at constant . Since we already expected most sources with to be unresolved galaxies (Kochanek et al., 2001), we imposed an additional constraint on all our sources.
This left 14130 matched sources in Taurus and 2828 in Upper Scorpius.
3.2 The UV-IR color locus
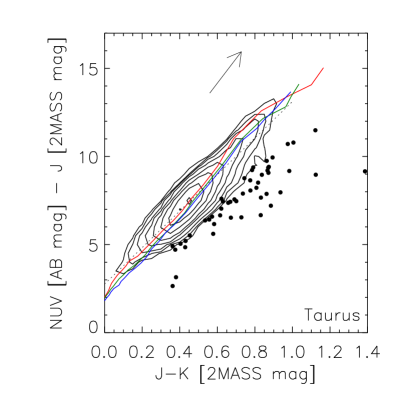
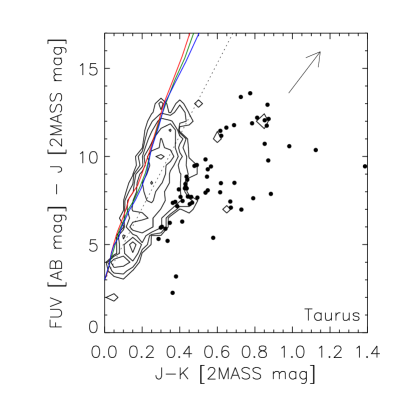
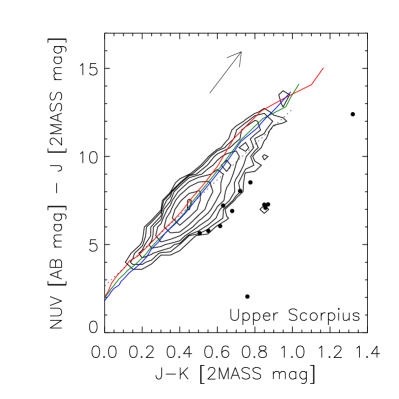
Colors calculated by Laget333http://www.oamp.fr/people/laget/intg/intg0.html from Kurucz models suggest that stellar photospheres form a well-defined locus in the GALEX vs. and vs. color spaces, largely independent of surface gravity (figure 4). Ultraviolet excess sources should appear below this locus, with bluer UV colors relative to non-excess stars of the same photospheric infrared color. Since atmosphere models are not well tested in the ultraviolet, we did not rely on them to determine the precise position of the stellar locus. Instead we used the population of field stars, a mixture of dwarfs and giants, to define an empirical vs. locus.
Since they can be detected at distances much farther than 140 pc, most of the early-type, intrinsically blue, stars in the field population are background objects, and are therefore extinguished by Taurus or Upper Scorpius. On the other hand, most of the detectable late-type, intrinsically red, stars are in the foreground and suffer little extinction (cf. Table 3). In practice, since we cannot detect redder stars unless they have an ultraviolet excess, our measurement of the field star locus is determined by early-type stars, which have a similar extinction to those in Taurus or Upper Scorpius (). In addition, the reddening vector is almost parallel to the main sequence, and as a result the locus of reddened stars inferred e.g. from the Kurucz model colors is much narrower than the stellar locus we observe. Since we are interested in the distance of a star from the locus, we infer that any systematic errors associated with reddening are much smaller than the effect of other errors or astrophysical variations.
Although we tried to characterize the main sequence by taking the median color of narrow bins, following Covey et al. (2007), this approach failed for bins with in the FUV and in the NUV, as there were too few field stars to give an unbiased median. Instead, we iteratively removed points that differed from the median locus by three standard deviations, then made linear fits to the remaining points with in the FUV and in the NUV. The resulting solutions were
| (2) |
We defined a source’s FUV and NUV excess as the difference between its observed FUV-J and NUV-J color, respectively, and the value predicted by equation 2. The formal error in the excess, propagated from the photometric uncertainties and the uncertainties in the fit, is dominated by the error in the color. Because the stellar locus has a steep slope in ()-() space, the mean uncertainty of 0.05 in propagates to an uncertainty of magnitudes in the FUV excess and magnitudes in the NUV excess. Since in section 3.3 we identify our sample of UV excess sources as those differing by a certain number of standard deviations from the main stellar locus, this translates to the smallest excess we can reliably detect: 3.2 FUV magnitudes and 1.6 NUV magnitudes if we select sources with a or larger excess, or 5.3 FUV magnitudes and 2.6 NUV magnitudes if we require a or larger excess. For stars with more precise colors, we can detect excesses below these limits.
3.3 UV excess object selection
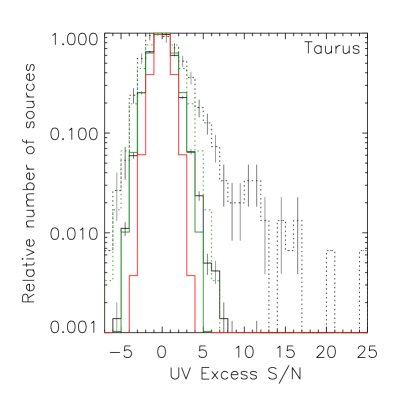
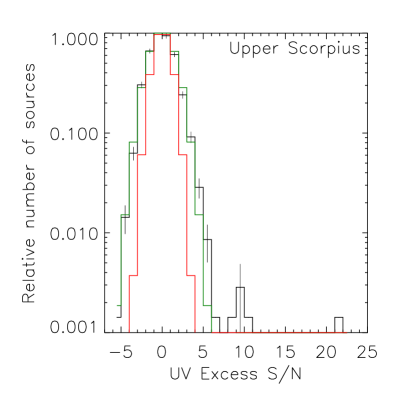
We show in Figure 5 the distribution of excesses divided by their errors. The observed distributions are roughly 1.9 times broader in the FUV than the errors imply, and 1.5 times broader in the NUV. This might suggest a source of error we have overlooked. An alternative is that the locus of field stars is broadened by variations in properties other than temperature and gravity, and we are seeing a convolution of such astrophysical broadening with our errors. We will continue to quote excesses in multiples of the formal errors as a measure of whether a source lies outside the locus, but the reader should bear in mind that this ratio is not a rigorous measure of statistical significance. However, in sparsely populated areas of the color-color diagram, especially at high , there are too few sources for us to use alternative measures such as the locus width.
We now define our sample of UV excess sources as those having ultraviolet excess normalized by the formal error in that excess above a given cutoff value. For several choices of cutoff (, , …, ) we estimate the number of sources erroneously included in the UV excess sample by assuming the distribution of field star colors is symmetric with respect to positive and negative excesses. For example, to estimate the number of erroneously included stars whose measured UV excess is or greater, we find the number of sources with a or greater UV deficit and subtract it from the number of UV excess sources, assuming the former are all outliers from the field locus. We list in Table 5 the total number of UV excess sources, the expected number of erroneous sources, and the fraction of UV excess sources that appear legitimate for each cutoff value.
Table 5 shows that the choice of cutoff carries a steep trade-off between completeness of the UV excess sample and reliability of an individual source’s identification as UV excess. For example, only a third of the sources with a measured excess of over should be true UV excess sources, while around 86% of the sources are reliable identifications. On the other hand, only 42% of the genuine UV excess sources are expected to appear in a sample – the rest are buried in the more heavily contaminated population with excess between and . To support projects where completeness is a higher priority than reliability, we present in Table 6 all sources with a or better excess in at least one band. However, for many of our discussions in this paper we will concentrate on the more reliable subsample.
3.4 Results
The spatial distribution of the excess sources is shown in figures 6 and 7. Most of our sample of sources in both Taurus and Upper Scorpius is spread uniformly over the observed fields.
In Taurus we also find concentrations of sources near and near , as well as some outlying members of the previously known group of sources associated with the cloud L1529 (Kenyon et al., 2008). The first group might not be a true physical association, appearing dense only because it is less than ten degrees from the Galactic plane. The group near (62°, 25°), consisting of 6 sources, is likely a Poisson fluctuation. Given the mean density of 1.5 sources per field, we find a 21% probability that at least one of our 61 Taurus fields contains 6 sources or more. We conclude there is no statistical evidence for clustering of the UV excess sources.
There are very few sources in our Upper Scorpius sample, consistent with the observation by Slesnick et al. (2008) that only a small fraction of Upper Scorpius members of spectral types M3-M8 are north of . The sample is too sparse for us to look for evidence of structure, nor has any previously been observed in the association (Preibisch & Mamajek, 2008).
We examine in section 6.1 whether any of these UV excess sources are plausible members of Taurus or Upper Scorpius.
4 Validation
4.1 Comparisons with previous surveys
To test our survey’s recovery rate, we identified samples of Taurus and Upper Scorpius members compiled without reference to our observations. Kraus & Hillenbrand (2007a) and Walter et al. (1988) together list 261 known Taurus members and Kraus & Hillenbrand (2007a) list in addition 401 Upper Scorpius members. Unfortunately, because of concerns that a bright UV source or concentration of sources might damage the GALEX detectors, our GALEX pointings avoid areas with large numbers of known young stars (figures 1 and 2). Only 5 of the previously known Taurus members were in the GALEX survey region, and none of the known Upper Scorpius members; the former are listed in Table 7.
We recover AA Tau and DN Tau, both well known classical T Tauri stars, as UV excess objects to high significance. TAP 4, a naked T Tauri star, has only a UV excess. The remaining two sources, which we do not detect, are M stars, and therefore strongly selected against by GALEX without strong UV excesses (section 2.1). While the detections of AA Tau and DN Tau are reassuring, the marginal detection of TAP 4 suggests that many of the more mature Taurus members – our main goal – may be buried in the UV-bright tail of the field star population, possibly below our limit.
4.2 Control sample
To investigate the amount of field contamination in our UV excess sample, we repeated our procedure on a set of 7 Medium Imaging Survey ( s exposure) fields, covering 6.5 square degrees, taken near (, ). This latitude is slightly higher than that of Taurus or Upper Scorpius, but there were no GALEX observations at lower latitudes. The longitude was chosen as a point intermediate between the bulge (the direction of Upper Scorpius) and the anticenter (the direction of Taurus). IRAS images of this region show little emission aside from Galactic cirrus, and there are no known open clusters within ten degrees of the fields444From the WEBDA cluster database, http://www.univie.ac.at/webda/. Based on these observations, we do not expect a population analogous to the Taurus or Upper Scorpius association in our comparison fields.
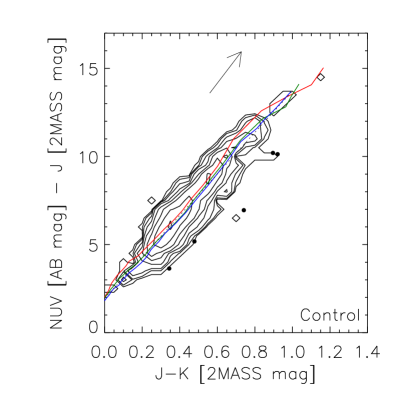
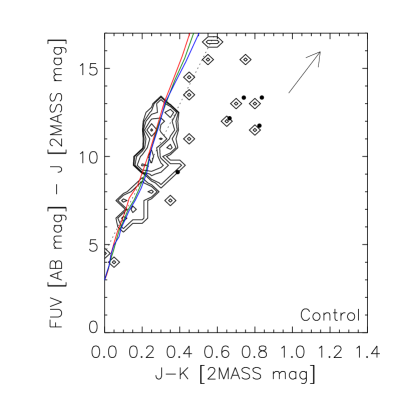
Of the 10496 GALEX sources that met our quality cuts, 3148 had 2MASS matches. From examining the source distribution in color-color space we confirmed that discriminated stars from unresolved galaxies in these fields, but only 1461 sources met this last criterion. The small fraction of matching sources, and stellar sources in particular, is expected from the higher galactic latitude and lower extinction of our control fields compared to our target fields. For reference, 14130 of our 25389 Taurus GALEX sources had a 2MASS counterpart with , as did 2828 of our 5863 Upper Scorpius GALEX sources. Because of the low extinction, our sample of GALEX sources in the control fields contains on average more distant sources than the samples in the target fields do. We show in Figure 8 the distribution of sources as a function of color, analogous to Figure 3 and the discussion in section 3.1. Very few of the sources with (either stars earlier than mid-A or unresolved star-forming galaxies) have 2MASS counterparts; the effect is much stronger here than in Figure 3. In addition, the distribution of magnitudes for matched sources (Figure 9) peaks over a magnitude fainter than in our target fields, suggesting again that we are probing greater distances in the control field.
We show in Figure 10 color-color diagrams for the control fields analogous to Figure 4. These fields contain nine UV excess sources. This is the same fraction of GALEX-2MASS sources () as in Taurus () and Upper Scorpius (). We cannot tell what fraction of the excess sources in the control fields are outliers from the main stellar locus, as there are no UV-deficit sources in Table 5 with which to repeat the analysis of section 3.3. Since these sources appear far from known clusters or star-forming regions, we assume they represent a population spread evenly throughout the Galactic disk. If this is the case, then the population should appear along any line of sight at similar Galactic latitude, including towards Taurus and Upper Scorpius, and in fact should account for a large fraction of the sources we see there.
This inferred population of UV excess sources is qualitatively similar to the population of Myr old G and K stars invoked by Briceño et al. (1997) to explain ROSAT detection rates of X-ray luminous stars. However, they predicted a surface density of 0.2-0.3 deg-2 for these stars, implying an average of 1.3-1.9 such stars in an area the size of our control fields. Because Briceño et al. (1997)’s work was based on ROSAT’s sensitivity limits, most of the detectable stars in their model are within 100-200 pc. Three of the nine UV excess stars in the control sample have magnitudes too faint for a distance of 200 pc, so we drop these three to allow a fair comparison of our sample, now reduced to six, to their results. The probability that we would observe six or more sources when we expect 1.9, however, is only 1.3%. Since to our knowledge there is no study on low-latitude ultraviolet populations analogous to Briceño et al. (1997), we cannot explain why our background of UV excess sources is much larger than their background of X-ray sources.
5 Spectroscopic Follow-Up
5.1 Target selection
Like all youth indicators, ultraviolet excess is not perfectly correlated with age (Altenbach 2010, in prep.). As a result, like most young star surveys, we need spectroscopic follow-up to confirm the youth of our photometrically selected stars. We carried out a spectroscopic observing program of some of our ultraviolet excess sources using the Double Spectrograph (DBSP) on the 200-inch Hale Telescope at Palomar. Our program had several goals. One was to obtain representative spectra of excess sources across a broad area of color-color and color-magnitude space. Another was to understand the diversity of sources that produce a UV excess. A third was to create as large a sample of spectroscopic candidate young stars as possible.
To balance these goals, we created a spectroscopic target list containing the following groups of sources, in decreasing order of population:
-
1.
UV excess sources with and , as we found from our first run that this region of parameter space contained many emission line stars
-
2.
UV excess sources with and , as this region of color-magnitude space was dominated by sources with an excess only in the FUV, suggesting they represented a different population from sources in other regions
-
3.
UV excess sources with and an FUV excess, as these sources tended to have very large excesses with no clear pattern
-
4.
obvious outliers in Figure 4, either sources with much lower or much higher than the main body of UV excess sources or sources with much larger excesses than other UV excess sources with similar
At the telescope, we would usually choose the brightest sources consistent with the above criteria to keep the exposure times reasonable. In addition, we tended to pick sources with large excesses ( mag in FUV or mag in NUV) as a previous program of AIS-selected observations had shown that these sources are much more likely to have chromospheric activity indicators in their spectra (Altenbach 2010, in prep.). As a result, the spectroscopic sample has strong biases not present in the photometric sample of section 3.4.
5.2 Observations
We observed 20 of the 95 candidates in Upper Scorpius, including 7 of the 11 candidates, on 2008 June 5-6. We also observed Sco X-1, but do not count it as a candidate as we were aware of its identity before the run (see section 6.2). We likewise observed 43 of the 471 candidates in Taurus, including 20 of the 89 candidates, on 2008 November 28. The spectra covered the ranges 3890-5430Å at SNR , and 6190-6750Å at SNR , , allowing us to observe the key youth indicators Ca II emission (3934, 3968Å), H emission (4861Å), H emission (6563Å), and Li absorption (6707Å). The images were reduced using the JHU astronomy library in IDL, and the spectra were extracted with the NOAO two-dimensional spectral package in IRAF.
5.3 Results
In Table 8 we list all the Palomar targets, together with equivalent widths of the youth indicators where we could measure them. In addition, where we did not detect lithium we give an upper limit on the equivalent width of , where is the formal signal-to-noise ratio of the surrounding continuum, as propagated by the IRAF spectral extraction routines. The constant of proportionality was set by noting that, had the lithium line in 2MASS J04505356+2139233 been weaker than its 0.15 Åvalue, we would have taken it for a statistical fluctuation.
The spectra were classified visually using spectra of standards taken on a previous DBSP run, with the statistics shown in Table 9. As expected, our Upper Scorpius sample is dominated by G and K stars, the lowest-mass (and therefore most numerous) stars to which we are sensitive. On the other hand, our Taurus sample shows a large number of M stars but very few K stars, particularly with a or greater excess. This is surprising because while K stars with weak excesses are not detectable by GALEX, those with a 3.5 mag () excess or low extinction should be (section 2.1). Table 8 has many stars of other spectral types, including later types, with excesses of this level. We suspect the deficit of K stars in our sample may represent an unexpected selection effect in our choice of spectroscopic targets.
We found that roughly a third of our sources had chromospheric activity indicators (Table 9). Three of those, all in Taurus, also show lithium absorption. We present spectra of these three in Figure 11. Among the three lithium stars, our survey recovers one previously known Taurus member, 1RXS J044712.8+203809, and confirms a previous candidate, 1RXS J045053.5+213927. The third star, 2MASS J05122759+2253492, is a previously unknown lithium-rich M dwarf toward the Galactic plane. The self-absorbed H profile suggests this star is still accreting, and the high Li equivalent width of 530 mÅ implies an age under 10 Myr.
While many of our emission line stars in Taurus show both Balmer and calcium emission lines, all but one in Upper Scorpius show only calcium emission. Since, unlike Balmer emission, calcium emission is a chromospheric activity indicator often seen in field stars, this may mean that our Upper Scorpius fields are too far from the main body of the association to contain significant numbers of young stars and that nearly all of our Upper Scorpius candidates are Myr old field stars.
Two thirds of the spectra, even of targets, show no unusual features, only photospheric absorption lines. This is surprising because we anticipated a good correlation between UV photometric excess and the presence of optical emission lines, aside from the population included from statistical fluctuations that we estimated in section 3.3. From Table 5 we expect only one sixth of the targets to be erroneously identified as UV excess, and therefore for five sixths, not the observed one third, of the targets to show emission lines. We conclude there is a significant population of UV excess sources with normal optical spectra; we explore this population more in section 6.3.
6 Discussion
6.1 Membership in Taurus and Upper Scorpius
With our spectroscopic data we can investigate how much of our UV excess sample, most of which lacks spectra, can be associated with Taurus or Upper Scorpius. A significant number of our spectra are of sources found below the main sequence at 140 pc, in part because we wanted to characterize our contaminants, in part because we were biased toward optically bright (and therefore blue, at fixed ) sources, and in part because we were concerned that our brightest sources were too bright even for pre-main sequence stars and must instead be field giants. Of the 19 sources above the main sequence in Upper Scorpius, we obtained spectra of 9. Of the 101 sources above the main sequence, we followed up 23. In addition, we found information in the literature confirming or ruling out Taurus membership for 14 sources, 2 of which were also spectroscopic targets. We searched for but found no such information for our Upper Scorpius candidates. We summarize these results in Table 10, classifying UV excess stars above the 140 pc main sequence as follows:
-
•
stars confirmed as members of Taurus or Upper Scorpius in previous literature, usually by lithium detection
-
•
stars rejected as members in previous literature, usually by lithium non-detection or by proper motion association with the nearby Pleiades or Hyades
-
•
Palomar targets with no emission lines
-
•
Palomar targets with emission lines, but with a spectral type or luminosity class indicating they are actually either reddened background main sequence stars or background giants
-
•
Palomar targets with spectral type consistent with Taurus or Upper Scorpius membership and emission lines but no lithium line
-
•
Palomar targets with spectral type consistent with Taurus or Upper Scorpius membership and emission lines and a lithium detection
-
•
stars with neither membership information in previous literature nor Palomar spectra
For the 5 stars in Taurus and 5 in Upper Scorpius that had both emission lines and a spectral type consistent with Taurus or Upper Scorpius membership, we acquired preliminary proper motions based on published USNO and 2MASS positions (Kraus 2009, private communication). The results, presented in Table 11, indicate that 3 of the spectroscopic candidates in Taurus are likely members of the association, while only one of the candidates in Upper Scorpius is. However, we emphasize that these are very rough proper motions and should be used with caution.
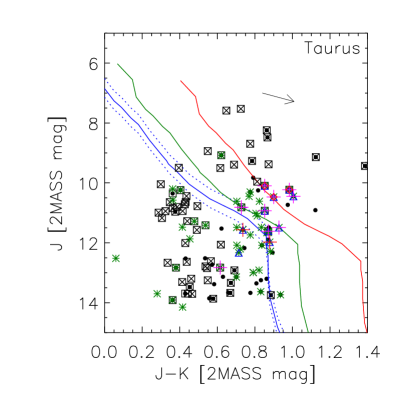
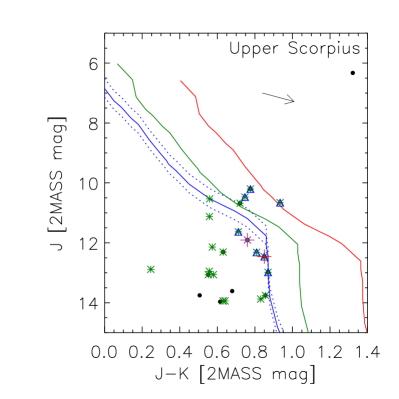
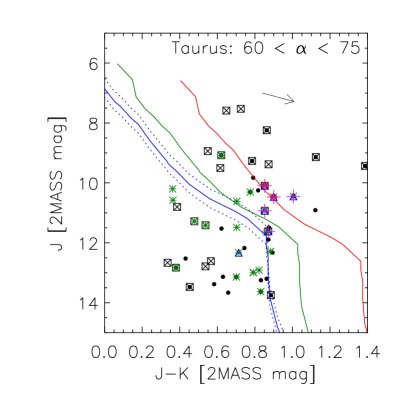
We show in Figure 12 color-magnitude diagrams of the Taurus, the Upper Scorpius, and the control fields, distinguishing both UV excess sources and spectroscopic targets (details in caption). We show the main sequence at 140 pc in blue. We expect low mass Taurus and Upper Scorpius members to lie above the indicated main sequence, as would extinguished early-type main sequence stars at a comparable distance. Figure 12 shows that, as expected, almost all of our Palomar targets with emission lines are above the 140 pc main sequence, to within uncertainties in the stars’ color. The rarity of emission lines among the background UV excess stars suggests that the emission-line stars above the main sequence may represent a population associated with Taurus or Upper Scorpius, although we are limited by small numbers: a Fisher’s exact test gives a probability of 20% that we would see at least this large a discrepancy from statistical fluctuations if the fraction of emission stars were spatially uniform.
In section 3.4, we found many UV excess sources in the easternmost fields of our Taurus survey, but noted that these are the fields closest to the Galactic plane. To determine the nature of these fields we plot their sources in Figure 14, with the fields in central Taurus for comparison. Clearly, the vast majority of the sources in the eastern fields are background objects; the high density of UV excess sources merely reflects the high density of stars toward the Galactic plane.
To see if the high density of emission-line stars in eastern Taurus is likewise due to the fields’ low Galactic latitude, we repeat a test from Slesnick et al. (2006), who carried out an optical survey of roughly the same area as our GALEX survey. By selecting candidate pre-main-sequence stars from optical color-magnitude diagrams and using follow-up spectroscopy to look for gravity indicators, they found a broadly distributed population of pre-main sequence stars at . They found no such population in western Taurus. Using Fisher’s exact test they showed that the probability of observing so great a difference between the fraction of spectroscopically confirmed pre-main-sequence stars east and west of the known Taurus population is less than 3% if in fact the two regions represent identical populations.
Applying Fisher’s exact test to our own results (4 out of 15 Palomar targets have emission lines east of Taurus, 2 out of 8 have them west of Taurus), we find a probability of 100% of observing fractions of emission-line stars differing by at least as much as they do. Repeating the test on samples restricted to sources, or samples above the main sequence, likewise gives no significant result. We can explain the insignificance of our result in part as an effect of selecting sources only by their colors, making us more sensitive to background objects than Slesnick et al. (2006), and in part by the small number of spectra we have. If we had a larger sample, we might be able to get a more useful constraint on the existence of an eastern extension to the Taurus association.
Despite the strong backgrounds, we have identified possible new members of Taurus and Upper Scorpius, with more likely to be identified once we have additional spectra. Since our GALEX fields do not cover the known areas of newly formed stars in either Taurus or Upper Scorpius, any new members we find must represent either previously unnoticed subgroups of Taurus (though we find no significant clustering), a more distributed mode of star formation than previously inferred in either region (though this is hard to reconcile with the classical theory that stars form in dense clumps), or migration from the actual sites of star formation (Feigelson, 1996; Briceño et al., 1997). In principle, we can constrain this last hypothesis with the toy model we presented in the introduction to this paper. However, as we find only one new candidate of type K2 or earlier in our Taurus survey, in addition to the three already known from the literature, and three new candidates of type K2 or earlier in Upper Scorpius, we do not yet have a sample large enough for good constraints. Our single detection in Taurus implies that 13% of our sources might be K2 or earlier members. Extrapolating to the 36 sources in our central Taurus fields, where the calculations of the introduction apply, we predict a member density of 0.3 deg-2. Our three K2 or earlier candidates in Upper Scorpius imply that 33% of our unobserved sources might also be members, implying a member density of 0.5 deg-2. Assuming that half of the sources in either region turn out to be ZAMS stars or other field contaminants, we find densities similar to the ones we predicted for constant star formation histories of 30 Myr or longer. Trying to apply formal upper limits rather than these highly uncertain values gives no constraint at all.
Since most of our emission line stars lack lithium detections, our arguments that they truly are Taurus or Upper Scorpius members are statistical in nature. Better constraints on the ages of these stars could tell us whether they are co-eval with the known Taurus and Upper Scorpius populations or whether they are a distinctly older group – since stars of given age show a broad scatter in their lithium equivalent widths, our non-detections are suggestive but do not by themselves prove an old population. In addition, more rigorous proper motions could confirm individual stars’ membership and provide cleaner statistics, especially once we have an expanded spectroscopic sample.
6.2 Unusual UV excess sources
While our survey targeted chromospherically active young stars in Taurus and Upper Scorpius, GALEX is an ideal facility for finding a variety of UV-bright sources, potentially including new classes of objects. However, this diversity means that any search for a specific type of object must consider a variety of interlopers. As a demonstration of both the power of UV surveys to find unusual objects and the potential contaminants of such surveys, we note that our photometrically selected sample includes an X-ray binary, a possible mass-transfer binary, and a white dwarf M dwarf pair.
2MASS J16195506-1538250 (Sco X-1)
At , , Sco X-1 is a clear outlier in Figure 4. We observed it at Palomar so that we would have a template spectrum for other X-ray binaries that might appear at smaller UV excess. Since there are no other sources in our Palomar sample with similar (emission-line dominated) spectra, and since we deliberately selected high-excess sources as Palomar targets, we are confident this is the only X-ray binary in our sample.
2MASS J05161463+2313174
This A0e V star has a self-absorbed H emission line and an inverse P Cygni H line (Figure 15), both signs of accretion. The difference between the peak and the trough of the H line is about 200 km s-1. The star’s magnitude of 10.8 and a diffuse interstellar band at 4430Å are difficult to reconcile with Taurus membership. It may instead be a background ( pc away) mass-transfer binary; however, we note that it has a much more modest UV excess than Sco X-1 (Table 8).
2MASS J04015065+2103495
This star’s spectrum contains both broad Balmer absorption lines and strong TiO bands, identifying it as a white dwarf M dwarf (WDMD) double. It is found at , in Figure 4. While it is at the edge of the locus of UV excess sources, it is not an obvious outlier as was Sco X-1. As a result, WDMD pairs are a potentially significant contaminant in our sample.
To identify the locus of WDMD doubles in vs. space we find empirical absolute magnitudes of white dwarfs in appendix B. In particular, a white dwarf with K has . A double with an M0 primary and a 16000 K secondary, then, has , , (or an apparent excess of 20 magnitudes and excess of 7.3 magnitudes over the M dwarf photosphere). As their white dwarfs cool, WDMD pairs form the WDMD locus by migrating along lines of constant toward the main sequence. Any extinction moves the WDMD locus redward almost parallel to the field locus.
Smolčić et al. (2004) report that 1 out of every 2300 SDSS stars with are WDMD pairs, while Seibert et al. (2005) find that using data from the GALEX Early Release rather than the band doubles this number. Given 14130 and 2828 matched sources in Taurus and Upper Scorpius, respectively, we expect about 12 and 2 of them to be WDMD pairs. Since it is not clear to what excess level Seibert et al. (2005) were able to probe, we cannot convert this figure to a number of UV excess sources in our sample; their study, benefiting from the high precision of SDSS photometry, may be sensitive to WDMDs to which we are not.
6.3 UV excess sources without optical activity indicators
We identified in section 6.2 examples of sources other than chromospherically active stars that produce an ultraviolet excess, with spectra characteristic of X-ray binaries or WDMD pairs. However, many other UV excess sources remain unexplained, as their spectra are those of ordinary main sequence stars. In Taurus, 12 of our 20 targets show no signs of chromospheric activity in their spectra. Extrapolating to the rest of the sample, we infer a density of UV excess sources without optical activity indicators between 0.7 deg-2 and 1.2 deg-2 (90% symmetric confidence interval). In Upper Scorpius, the spectra of 4 of our 7 targets show no unusual features. We infer a density of UV excess sources without optical activity indicators between 0.4 deg-2 and 0.7 deg-2 with 90% confidence. We might have overlooked chromospheric activity indicators among A or early F stars, where the strong photospheric background makes it difficult to discern optical emission lines (e.g. Simon & Landsman, 1991), but we should have seen any such indicators among the later spectral types.
We cannot attribute the entire population of stars with UV excesses but normal optical spectra to errors in our photometry or in our characterization of the field locus. Based on the statistics in Table 5, we expect 3 of our Taurus spectroscopic targets to be included by such errors, and at most 1 in our Upper Sco sample. In addition, we see stars with normal spectra at up to excess, where such uncertainties should have no effect. We must seek other explanations for this result.
The first possibility is that we are looking at chance superpositions of UV and infrared sources. To find the expected number of such sources, we model the GALEX and 2MASS sources in our fields as three uniformly and independently distributed populations: one of UV-only sources with density , one of IR-only sources with density , and one of sources visible in both bands with density . The observed densities of UV sources, IR sources, and matched sources should then be
| (3) |
where is the area around a GALEX source in which a 2MASS source would be assumed a counterpart. Taking values for , , and from Table 4 (note we only count 2MASS sources with , as we have throughout the paper) and solving for the density of chance alignments , we expect 6 such matches in our Taurus survey region and 2 in our Upper Scorpius fields. Since there are 89 UV-excess sources in Taurus and 11 in Upper Scorpius, and since some chance matches might produce a smaller excess than , we can discount them as the source of most of these unexplained UV excesses.
Carpenter (2009, private communication) has suggested based on Hogg & Turner (1998) that some of our UV excess sources, those detected at low signal to noise ratio, have overestimated UV fluxes. If this flux bias is responsible for our unexplained UV excess sources, then we expect low SNR GALEX sources to be more likely to show a UV excess. However, when we measure the fraction of UV excess sources as a function of the GALEX SNR, we find no significant dependence on the SNR. SNR-related biases do not explain why so many UV excess sources appear inactive in spectroscopic follow-up.
Bianchi et al. (2007) have suggested that spurious UV excess sources may arise from confused matches in which a single GALEX source has multiple 2MASS counterparts. Our matching radius of 2″ does not let us find more than one of a GALEX source’s 2MASS counterparts, so we cannot easily identify sources where this occurs. As a test of whether overlooked counterparts can account for our excess sources, we match our GALEX sample to the All Sky Combined Catalog (Kharchenko, 2001), finding four close doubles detected by GALEX: HD 21392, HD 26514, HD 141959, and HD 242903. Of these, HD 26514 was excluded from our 2MASS sample because it had only E quality photometry in J band [profile fit failed or intermittent detection], HD 242903 because it had F quality in K band [error could not be determined], and HD 141959 because it had a confused K detection. Only HD 21392 was included in our 2MASS sample, and it had an color consistent with a single photosphere ( excess). This test suggests that our quality cuts reliably exclude marginally resolved doubles and our procedure is not susceptible to this source of error.
As a second test of the confusion hypothesis, we examine the fraction of UV excess sources without spectroscopic activity indicators as a function of the offset between GALEX and 2MASS positions. If either the GALEX or 2MASS source is a marginally resolved double, we expect its measured position to have a greater offset from its true position than if it were a single source, and therefore a greater offset from an independent measurement in another band. If this is the cause of our spectroscopically unconfirmed UV excess sources, we expect the apparently inactive sources to be biased towards larger GALEX-2MASS separations. In Figure 16, we show a histogram of the Palomar targets as a function of the separation. 32 of the 44 sources (73%) with separations less than 1″ lack optical activity indicators, whereas 11 of the 19 sources (58%) with separations between 1″ and 2″ do. Assuming, as a prior, that the parent fraction of sources with no activity indicators is uniformly and independently distributed over the interval in either group, we find only a 12% probability that the high-separation targets were drawn from a population with a larger such fraction than the low-separation targets.
Having considered several forms of experimental error, we now consider what contaminating sources could produce an ultraviolet excess but a normal optical spectrum. One possibility is a binary consisting of a G- or K-type primary and a flare star secondary. In appendix C we show that the flare star CR Dra has in quiescence and if observed during a flare. A K0 star with a companion similar to CR Dra would show an apparent UV excess of 0.15 magnitudes in quiescence and 0.29 magnitudes if we caught it during a flare. Only for a K4 or later primary would a companion flare star produce apparent excesses of the right order (1.7 magnitudes in quiescence, 2.4 in flare) to be detectable by our procedure. Allowing for a flare magnitudes brighter makes this a potential source of contamination for K2 and later stars. However, since most of our UV excess sources with normal spectra are around G or earlier stars (cf. Table 9), we cannot explain the NUV excesses as flux from a companion flare star. We do not have any data with which to estimate the effect of a flare star companion on a system’s FUV magnitude.
A similar alternative is a binary consisting of a G- or K-type primary and a white dwarf secondary. A G or K star has an NUV flux comparable to that of a white dwarf, so such binaries are most prominent in the FUV. Taking values from the appendices, a K0 star with a 16000 K white dwarf companion would have an apparent NUV excess of only 1 magnitude, but a clear apparent FUV excess of 10 magnitudes. A G0 star and a 16000 K white dwarf would have a somewhat more marginal apparent FUV excess of 5 magnitudes. Since a white dwarf cools to 16000 K within 150 Myr, and even a dwarf cools within 450 Myr (Fontaine et al., 2001), binaries with white dwarfs hotter than 16000 K should be too rare to contribute a significant population of NUV excess sources. G and K stars with white dwarfs might explain some of our FUV-only excess sources, but nothing with an NUV excess.
5 of our 20 spectroscopic targets in Taurus and 1 of our 7 targets in Upper Scorpius are late F- or G-type stars with an NUV excess and normal optical spectra. None of the explanations discussed here are plausible for these stars, and they will form the subject of a future paper once additional follow-up is obtained.
7 Summary and Future Work
By combining a photometric, wide-field survey of ultraviolet excess objects with an optical follow-up search for emission lines and lithium absorption, we have confirmed two new members of Taurus through lithium detections, and identified 3 additional probable members of Taurus and 5 of Upper Scorpius on the basis of emission lines. We expect to identify 8-20 more such sources in our Taurus survey fields and 3-6 in our Upper Scorpius fields once we complete our follow-up program. Because our survey probes areas away from the molecular clouds in Taurus and away from the association body in Upper Scorpius, our detections represent tentative evidence for a distributed population (cf. Slesnick et al., 2006). However, without lithium detections we will need additional evidence to confirm our proposed members.
We have found, in addition to possible new Taurus and Upper Scorpius members, over 400 background UV-excess stars in our fields. We can detect such stars to distances of several hundred parsecs (see section 6.2) along sight lines away from the Taurus molecular clouds. While some of these stars show optical emission lines and are presumably older chromospherically active stars, two thirds show no evidence of stellar activity. We have not yet identified the source of the ultraviolet excess in the latter stars.
Most Galactic work using GALEX has been based on the rough classification of large GALEX-SDSS matched data sets (e.g. Agüeros et al., 2005; Bianchi et al., 2007; Budavári et al., 2009) or on the detailed analysis of a small number of previously known sources (e.g. Welsh et al., 2006; Sahai et al., 2008). Very few studies have used GALEX colors to identify specific populations of stars (notable exceptions are Rhee et al. (2006) and Kinman et al. (2007)) and as far as we know ours is the first to include fields near the Galactic plane. As such, our work explores a previously overlooked part of the ultraviolet sky in more detail than is typical for large-area GALEX surveys. A new domain means new problems: the broader than expected field locus in vs. space, the high density of UV-excess sources even in fields distant from known star-forming regions, the small fraction of excess sources with emission lines. In the absence of constraints from population models or field observations, we do not yet have a robust way of dealing with any of these complications.
At present, the Galactic population of ultraviolet sources is constrained only in very rough terms. Main sequence stars are among the most common UV sources in the Galaxy, but the variation of UV properties among main sequence stars as a function of age or rotation speed, or the diversity of UV properties at a fixed mass, metallicity, age, or rotation speed, has been constrained only through indirect tracers. The contributions of white dwarfs and of white-dwarf-main-sequence binaries are well known from both models and observations (Bianchi et al., 2007, and references therein), but discussions of ultraviolet populations make no mention of accreting systems, young active stars, RS CVn binaries, flaring M dwarfs, or other objects expected to be prominent ultraviolet sources. Understanding these details of the Galactic ultraviolet background would make UV-selected samples of rare objects much more complete and reliable.
Appendix A Main Sequence Absolute Magnitudes
In their table 5, Kraus & Hillenbrand (2007b) compiled empirical magnitudes in the 2MASS bands for main sequence stars covering spectral types B8-L0. We reproduce these magnitudes in Table 12. To our knowledge, no one has made a similar compilation for the GALEX bands. Instead, we used colors calculated from Kurucz models by Laget555http://www.oamp.fr/people/laget/intg/intg0.html, linearly interpolated to the appropriate temperature and surface gravity for each spectral type as given by Kraus & Hillenbrand (2007b). We list the resulting and magnitudes in Table 12.
Appendix B White Dwarf Absolute Magnitudes
We found ultraviolet absolute magnitudes for white dwarfs by cross-matching a sample of white dwarfs with parallaxes (Holberg et al., 2002) to the GALEX GR5 public data. We found approximate temperatures by comparing the colors of these white dwarfs to Kawka & Vennes (2007). A selection of white dwarfs is given in Table 13; a more thorough study will be presented in a separate paper.
Appendix C Flare Star Absolute Magnitudes
Unfortunately, there is no systematic study of the absolute magnitudes of flare stars in the GALEX bands. For example, Welsh et al. (2006) observed only one star, CR Dra, that had a known distance (20.7 pc). Many other papers observed none at all.
From GALEX time-series data, CR Dra had a quiescent NUV flux of 58 counts per second, corresponding to an absolute magnitude of 14.09. 800 s into the 1500 s exposure GALEX observed a flare; the NUV flux had not yet returned to the quiescent level by the end of the orbit. The SExtractor source catalog for the orbit gave an average magnitude , corresponding to an absolute magnitude of 13.27. Had CR Dra been in our survey area, we would have used this catalog magnitude in our analysis.
References
- Agüeros et al. (2005) Agüeros, M. A., Ivezić, Ž., Covey, K. R., Obrić, M., Hao, L., Walkowicz, L. M., West, A. A., Vanden Berk, D. E., Lupton, R. H., Knapp, G. R., Gunn, J. E., Richards, G. T., Bochanski, J. J., Brooks, A., Claire, M., Haggard, D., Kaib, N., Kimball, A., Gogarten, S. M., Seth, A., & Solontoi, M. 2005, AJ, 130, 1022
- Bertin & Arnouts (1996) Bertin, E., & Arnouts, S. 1996, A&AS, 117, 393
- Bianchi et al. (2007) Bianchi, L., Rodriguez-Merino, L., Viton, M., Laget, M., Efremova, B., Herald, J., Conti, A., Shiao, B., Gil de Paz, A., Salim, S., Thakar, A., Friedman, P. G., Rey, S.-C., Thilker, D., Barlow, T. A., Budavári, T., Donas, J., Forster, K., Heckman, T. M., Lee, Y.-W., Madore, B. F., Martin, D. C., Milliard, B., Morrissey, P., Neff, S. G., Rich, R. M., Schiminovich, D., Seibert, M., Small, T., Szalay, A. S., Wyder, T. K., Welsh, B. Y., & Yi, S. K. 2007, ApJS, 173, 659
- Briceño et al. (1997) Briceño, C., Hartmann, L. W., Stauffer, J. R., Gagné, M., Stern, R. A., & Caillault, J.-P. 1997, AJ, 113, 740
- Budavári et al. (2009) Budavári, T., Heinis, S., Szalay, A. S., Nieto-Santisteban, M., Gupchup, J., Shiao, B., Smith, M., Chang, R., Kauffmann, G., Morrissey, P., Schiminovich, D., Milliard, B., Wyder, T. K., Martin, D. C., Barlow, T. A., Seibert, M., Forster, K., Bianchi, L., Donas, J., Friedman, P. G., Heckman, T. M., Lee, Y.-W., Madore, B. F., Neff, S. G., Rich, R. M., & Welsh, B. Y. 2009, ApJ, 694, 1281
- Cambrésy (1999) Cambrésy, L. 1999, A&A, 345, 965
- Covey et al. (2007) Covey, K. R., Ivezić, Ž., Schlegel, D., Finkbeiner, D., Padmanabhan, N., Lupton, R. H., Agüeros, M. A., Bochanski, J. J., Hawley, S. L., West, A. A., Seth, A., Kimball, A., Gogarten, S. M., Claire, M., Haggard, D., Kaib, N., Schneider, D. P., & Sesar, B. 2007, AJ, 134, 2398
- Cutri et al. (2008) Cutri, R. M., Skrutskie, M. F., Van Dyk, S., Beichman, C. A., Carpenter, J. M., Chester, T., Cambresy, L., Evans, T., Fowler, J., Gizis, J., Howard, E., Huchra, J., Jarrett, T., Kopan, E., Kirkpatrick, J. D., Light, R. M., Marsh, K. A., McCallon, H., Schneider, S., Stiening, R., Sykes, M., Weinberg, M., Wheaton, W., Wheelock, S., & Zacharias, N. 2008, Explanatory Supplement to the 2MASS All Sky Data Release and Extended Mission Products (Pasadena, CA: Infrared Processing and Analysis Center), http://www.ipac.caltech.edu/2mass/releases/allsky/doc/
- Cutri et al. (2003) Cutri, R. M., Skrutskie, M. F., van Dyk, S., Beichman, C. A., Carpenter, J. M., Chester, T., Cambresy, L., Evans, T., Fowler, J., Gizis, J., Howard, E., Huchra, J., Jarrett, T., Kopan, E. L., Kirkpatrick, J. D., Light, R. M., Marsh, K. A., McCallon, H., Schneider, S., Stiening, R., Sykes, M., Weinberg, M., Wheaton, W. A., Wheelock, S., & Zacarias, N. 2003, 2MASS All Sky Catalog of point sources. (NASA/IPAC Infrared Science Archive)
- Feigelson (1996) Feigelson, E. D. 1996, ApJ, 468, 306
- Feigelson & Montmerle (1999) Feigelson, E. D., & Montmerle, T. 1999, ARA&A, 37, 363
- Fontaine et al. (2001) Fontaine, G., Brassard, P., & Bergeron, P. 2001, PASP, 113, 409
- Güdel et al. (2007) Güdel, M., Briggs, K. R., Arzner, K., Audard, M., Bouvier, J., Feigelson, E. D., Franciosini, E., Glauser, A., Grosso, N., Micela, G., Monin, J.-L., Montmerle, T., Padgett, D. L., Palla, F., Pillitteri, I., Rebull, L., Scelsi, L., Silva, B., Skinner, S. L., Stelzer, B., & Telleschi, A. 2007, A&A, 468, 353
- Herbig (1978) Herbig, G. H. 1978, Can Post-T Tauri Stars Be Found?, ed. L. V. Mirzoyan, 171–+
- Hogg & Turner (1998) Hogg, D. W., & Turner, E. L. 1998, PASP, 110, 727
- Holberg et al. (2002) Holberg, J. B., Oswalt, T. D., & Sion, E. M. 2002, ApJ, 571, 512
- Kawka & Vennes (2007) Kawka, A., & Vennes, S. 2007, ArXiv Astrophysics e-prints
- Kenyon et al. (2008) Kenyon, S. J., Gómez, M., & Whitney, B. A. 2008, Low Mass Star Formation in the Taurus-Auriga Clouds, ed. B. Reipurth, Vol. 1 (ASP Monograph Publications), 405–458
- Kharchenko (2001) Kharchenko, N. V. 2001, Kinematika i Fizika Nebesnykh Tel, 17, 409
- Kinman et al. (2007) Kinman, T. D., Salim, S., & Clewley, L. 2007, ApJ, 662, L111
- Kochanek et al. (2001) Kochanek, C. S., Pahre, M. A., Falco, E. E., Huchra, J. P., Mader, J., Jarrett, T. H., Chester, T., Cutri, R., & Schneider, S. E. 2001, ApJ, 560, 566
- Kraus & Hillenbrand (2007a) Kraus, A. L., & Hillenbrand, L. A. 2007a, ApJ, 662, 413
- Kraus & Hillenbrand (2007b) —. 2007b, AJ, 134, 2340
- Linsky et al. (2001) Linsky, J., Redfield, S., Ayres, T., Brown, A., & Harper, G. 2001, in Astronomical Society of the Pacific Conference Series, Vol. 242, Eta Carinae and Other Mysterious Stars: The Hidden Opportunities of Emission Spectroscopy, ed. T. R. Gull, S. Johannson, & K. Davidson, 247–+
- Mamajek & Hillenbrand (2008) Mamajek, E. E., & Hillenbrand, L. A. 2008, ApJ, 687, 1264
- McKee & Ostriker (2007) McKee, C. F., & Ostriker, E. C. 2007, ARA&A, 45, 565
- Morrissey et al. (2007) Morrissey, P., Conrow, T., Barlow, T. A., Small, T., Seibert, M., Wyder, T. K., Budavári, T., Arnouts, S., Friedman, P. G., Forster, K., Martin, D. C., Neff, S. G., Schiminovich, D., Bianchi, L., Donas, J., Heckman, T. M., Lee, Y.-W., Madore, B. F., Milliard, B., Rich, R. M., Szalay, A. S., Welsh, B. Y., & Yi, S. K. 2007, ApJ, 173, S682
- Ness et al. (2009) Ness, J.-U., Ehle, M., Riestra, R. G., Guainazzi, M., Rodr guez, P., Talavera, A., & de la Calle, I. 2009, XMM-Newton Users Handbook (Madrid, ES: XMM-Newton Science Operations Center), http://xmm.esac.esa.int/external/xmm_user_support/documentation/uhb/
- Preibisch & Feigelson (2005) Preibisch, T., & Feigelson, E. D. 2005, ApJS, 160, 390
- Preibisch et al. (2005) Preibisch, T., Kim, Y.-C., Favata, F., Feigelson, E. D., Flaccomio, E., Getman, K., Micela, G., Sciortino, S., Stassun, K., Stelzer, B., & Zinnecker, H. 2005, ApJS, 160, 401
- Preibisch & Mamajek (2008) Preibisch, T., & Mamajek, E. 2008, The Nearest OB Association: Scorpius-Centaurus (Sco OB2), ed. B. Reipurth, Vol. 2 (ASP Monograph Publications), 235–284
- Rachford (2000) Rachford, B. L. 2000, MNRAS, 315, 24
- Rhee et al. (2006) Rhee, J., Seibert, M., Østensen, R. H., Yi, S. K., Rey, S.-C., Rich, R. M., Bianchi, L., & Lee, Y.-W. 2006, Baltic Astronomy, 15, 77
- Sahai et al. (2008) Sahai, R., Findeisen, K., Gil de Paz, A., & Sánchez Contreras, C. 2008, ApJ, 689, 1274
- Seibert et al. (2005) Seibert, M., Budavári, T., Rhee, J., Rey, S.-C., Schiminovich, D., Salim, S., Martin, D. C., Szalay, A. S., Forster, K., Rich, R. M., Barlow, T., Bianchi, L., Byun, Y.-I., Donas, J., Friedman, P. G., Heckman, T. M., Jelinsky, P., Lee, Y.-W., Madore, B. F., Malina, R., Milliard, B., Morrissey, P., Neff, S., Siegmund, O., Small, T., Welsh, B., & Wyder, T. K. 2005, ApJ, 619, L23
- Simon & Landsman (1991) Simon, T., & Landsman, W. 1991, ApJ, 380, 200
- Slesnick et al. (2006) Slesnick, C. L., Carpenter, J. M., Hillenbrand, L. A., & Mamajek, E. E. 2006, AJ, 132, 2665
- Slesnick et al. (2008) Slesnick, C. L., Hillenbrand, L. A., & Carpenter, J. M. 2008, ApJ, 688, 377
- Smolčić et al. (2004) Smolčić, V., Ivezić, Ž., Knapp, G. R., Lupton, R. H., Pavlovski, K., Ilijić, S., Schlegel, D., Smith, J. A., McGehee, P. M., Silvestri, N. M., Hawley, S. L., Rockosi, C., Gunn, J. E., Strauss, M. A., Fan, X., Eisenstein, D., & Harris, H. 2004, ApJ, 615, L141
- Valenti et al. (2000) Valenti, J. A., Johns-Krull, C. M., & Linsky, J. L. 2000, ApJS, 129, 399
- Walter et al. (1988) Walter, F. M., Brown, A., Mathieu, R. D., Myers, P. C., & Vrba, F. J. 1988, AJ, 96, 297
- Welsh et al. (2006) Welsh, B. Y., Wheatley, J., Browne, S. E., Siegmund, O. H. W., Doyle, J. G., O’Shea, E., Antonova, A., Forster, K., Seibert, M., Morrissey, P., & Taroyan, Y. 2006, A&A, 458, 921
- Wichmann et al. (1996) Wichmann, R., Krautter, J., Schmitt, J. H. M. M., Neuhaeuser, R., Alcala, J. M., Zinnecker, H., Wagner, R. M., Mundt, R., & Sterzik, M. F. 1996, A&A, 312, 439


| 100 s | 300 s | 1000 s | 1500 s | |
|---|---|---|---|---|
| (mag) | (mag) | (mag) | (mag) | |
| FUV | 21.1 | 22.1 | 22.9 | 23.2 |
| NUV | 22.0 | 22.8 | 23.5 | 23.8 |
Note. — All magnitudes AB.
| A quality | All sources | |
|---|---|---|
| (mag) | (mag) | |
| J | 15.7 | 16.1 |
| H | 14.7 | 15.5 |
| K | 14.4 | 15.1 |
Note. — Limits are for the high photometric quality (“A”) 2MASS sources and for the entire point source catalog. Since we required C quality photometry, our 2MASS completeness limits should lie between these two values.
| Photosphere | Minimum Excess | |||
|---|---|---|---|---|
| FUV | NUV | FUV | NUV | |
| Type | (mag) | (mag) | (mag) | (mag) |
| F0 | 2.5 | 4.2 | 4.4 | 5.2 |
| F2 | 2.0 | 4.0 | 4.0 | 5.0 |
| F5 | 1.1 | 3.6 | 3.1 | 4.5 |
| F8 | 0.4 | 3.2 | 2.4 | 4.2 |
| G0 | 3.0 | 2.0 | 4.0 | |
| G2 | 2.8 | 1.6 | 3.8 | |
| G5 | 2.7 | 1.3 | 3.7 | |
| G8 | 2.3 | 0.8 | 3.3 | |
| K0 | 1.9 | 0.2 | 2.9 | |
| K2 | 1.3 | 2.3 | ||
| K4 | 0.6 | 1.6 | ||
| K5 | 0.1 | 1.1 | ||
| K7 | 0.7 | |||
| M0 | 0.4 | |||
| M1 | 0.1 | |||
| M2 | ||||
Note. — The first two columns assume that a star produces only photospheric UV flux, the second two that a star has the smallest UV excess that can be reliably identified (see section 2). Values are for a 300 s GALEX exposure; the maximum for 1500 s exposures is about 0.5 mag higher in both bands. An entry marked by denotes a star that cannot be detected even if .
| Taurus | Scorpius | |
|---|---|---|
| Number of FUV fields | 61 | 0 |
| Number of NUV fields | 61 | 13 |
| Number of 300s fields | 54 | 12 |
| Number of 1500s fields | 7 | 1 |
| Area (deg2) | 56.1 | 12.2 |
| GALEX Sources | 25389 | 5863 |
| 2MASS Sources with | ||
| Matched Sources | 14130 | 2828 |
| Region | Cutoff | Total Sources | Field Sources | Reliability |
|---|---|---|---|---|
| Taurus | 471 | 306 | 0.35 | |
| Taurus | 191 | 60 | 0.69 | |
| Taurus | 89 | 13 | 0.85 | |
| Taurus | 58 | 4 | 0.93 | |
| Taurus | 36 | 1 | 0.97 | |
| Upper Sco | 96 | 55 | 0.43 | |
| Upper Sco | 32 | 11 | 0.66 | |
| Upper Sco | 12 | 1 | 0.92 | |
| Upper Sco | 6 | 0 | ||
| Upper Sco | 5 | 0 | ||
| Control | 50 | 24 | 0.52 | |
| Control | 21 | 0 | ||
| Control | 9 | 0 | ||
| Control | 4 | 0 | ||
| Control | 4 | 0 |
Note. — The number of field sources is estimated from the number of apparent UV-deficit sources; see section 3.3. The last column in the table gives the expected fraction of UV excess sources that are not contaminants from the field.
| 2MASS | (deg) | (deg) | GALEX Tile | (mag) | (mag) | (mag) | (mag) | (mag) | (mag) | (mag) | (mag) | ||
|---|---|---|---|---|---|---|---|---|---|---|---|---|---|
| 03171986+2447143 | 49.332784 | 24.787331 | TauAur_MOS44_v2 | 20.187 | 0.066 | 1.5 | 0.5 | 3.1 | |||||
| 03174690+2429233 | 49.445453 | 24.489820 | TauAur_MOS44_v2 | 20.273 | 0.068 | 2.1 | 0.4 | 5.0 | |||||
| 03180156+2411297 | 49.506523 | 24.191601 | TauAur_MOS44_v2 | 20.085 | 0.061 | 1.7 | 0.4 | 4.1 | |||||
| 03181321+2447174 | 49.555079 | 24.788185 | TauAur_MOS44_v2 | 18.324 | 0.021 | 1.3 | 0.3 | 4.2 | |||||
| 03181487+2429114 | 49.561995 | 24.486513 | TauAur_MOS44_v2 | 19.905 | 0.052 | 1.8 | 0.4 | 4.5 |
Note. — Table 6 is published in its entirety in the electronic edition of The Astronomical Journal. A portion is shown here for guidance regarding its form and content. The electronic table contains more rows and columns. Positions are in J2000.0 and taken from the 2MASS Point Source Catalog. FUV and NUV photometry in AB magnitudes is taken from the GALEX SExtractor catalogs. J, H, and K photometry in Vega-based magnitudes is taken from 2MASS. The notation denotes the FUV excess. If we know of an association between the GALEX source and a known object, and if the literature confirms or rules out membership in Taurus or Upper Scorpius, we list the information in the last two columns. Our list of associations is not complete.
| Spectral | FUV Excess | NUV Excess | ||
|---|---|---|---|---|
| ID | 2MASS | Type | (mag) | (mag) |
| TAP 4 | 03293837+2430379 | K1 | Not Detected | 1.2 (3.3) |
| AA Tau | 04345542+2428531 | K7 | 22.0 (24) | 8.0 (21) |
| DN Tau | 04352737+2414589 | M0 | 15.7 (21) | 5.4 (17) |
| Co Ku Tau 3 | 04354093+2411087 | M1 | Not Detected | Not Detected |
| 2MASS J04361030+2159364 | 04361030+2159364 | M8.5 | Not Detected | Not Detected |
| FUV | NUV | J | K | FUV Excess | NUV Excess | ||||||||
|---|---|---|---|---|---|---|---|---|---|---|---|---|---|
| 2MASS | Previous Literature | (mag) | (mag) | (mag) | (mag) | (mag) | (mag) | Spectral Type | (Å) | (Å) | (Å) | (Å) | (Å) |
| Taurus Sources | |||||||||||||
| 03283651+2100015 | 17.94 | 15.29 | 10.24 | 9.84 | 3.6 (6.2) | 1.9 (6.4) | A1-3 V | ||||||
| 03284114+2429333 | 21.70 | 13.74 | 12.80 | 4.5 (8.4) | M2 IV-V | ||||||||
| 03291688+2233071 | 20.91 | 11.02 | 10.21 | 1.2 (3.3) | K1 IV? | ||||||||
| 03322691+2138499 | 19.46 | 11.56 | 10.83 | 2.5 (7.9) | G5e III? | aaCore emission line in an absorption line. Could not measure emission equivalent width. | aaCore emission line in an absorption line. Could not measure emission equivalent width. | -0.6454 | |||||
| 03531583+2007078 | 20.82 | 12.08 | 11.38 | 1.3 (3.8) | G5 V | ||||||||
| 03540872+2039003 | 16.17 | 16.56 | 13.91 | 13.55 | 8.1 (8.6) | 3.9 (8.0) | F1-2 V | ||||||
| 03575997+2120125 | 17.78 | 11.87 | 11.41 | 1.6 (4.9) | F2-3 V | ||||||||
| 03592289+2234169 | Mel 22 DH 875, Non-Member | 21.99 | 11.49 | 10.56 | 1.9 (3.8) | K5e V | -8.364 | -8.992 | -0.5841 | -1.087 | |||
| 04015065+2103495 | 20.30 | 13.63 | 12.80 | 4.7 (11.3) | WDMD | ||||||||
| 04060135+2024074 | 20.62 | 12.99 | 12.20 | 11.6 (14.5) | G0 IV-V | ||||||||
| 04062461+2118284 | 20.61 | 13.14 | 12.44 | 2.6 (6.5) | G2 IV | ||||||||
| 04083270+2450332 | 22.21 | 12.91 | 12.09 | 2.0 (4.9) | F6 V | aaCore emission line in an absorption line. Could not measure emission equivalent width. | |||||||
| 04083606+2459336 | 22.11 | 11.66 | 10.79 | 1.3 (3.3) | K0-1? III? | ||||||||
| 04084754+2223470 | 16.02 | 15.98 | 12.83 | 12.45 | 7.6 (11.0) | 3.5 (10.1) | F1-2 IV | ||||||
| 04095113+2446211 | 1RXS J040951.0+244639, Member | 22.15 | 20.27 | 10.10 | 9.25 | 8.4 (12.1) | 1.4 (4.7) | M1e IV-V | -16.97 | -13.59 | -1.986 | -2.505 | 0.2583 |
| 04110570+2216313 | 21.65 | 20.92 | 10.93 | 10.08 | 9.8 (12.7) | 1.6 (4.1) | M4e V | -20.97 | -17.62 | -6.211 | -5.276 | ||
| 04113544+2132023 | 21.25 | 19.95 | 11.42 | 10.88 | 4.2 (5.8) | -0.2 (-0.6) | G5-8 V | ||||||
| 04213355+2311060 | 21.79 | 15.72 | 10.20 | 9.84 | -1.2 (-1.7) | 1.0 (3.3) | F2 V | ||||||
| 04301583+2113173 | 21.39 | 20.98 | 11.61 | 10.74 | 11.1 (15.0) | 2.4 (6.7) | M2e-3e III-V | -10.99 | -9.063 | -3.031 | -2.839 | ||
| 04455392+2100427 | 18.95 | 10.31 | 9.53 | 2.1 (6.9) | G3-5 II-III | ||||||||
| 04505356+2139233 | 1RXS J045053.5+213927 | 20.88 | 10.47 | 9.57 | 1.7 (4.4) | M2e V | -14.94 | -16.9 | -3.224 | -3.791 | 0.1542 | ||
| 04511488+2345034 | 20.14 | 11.49 | 10.79 | 1.4 (4.4) | F7 IV-V | ||||||||
| 04522346+2243195 | 20.75 | 17.75 | 11.28 | 10.80 | 3.3 (5.3) | 1.2 (4.1) | A3 V | ||||||
| 04541932+2249418 | 19.47 | 10.62 | 9.91 | 1.2 (4.0) | G0 IV | ||||||||
| 04551985+2314331 | 21.00 | 12.33 | 11.62 | 1.5 (4.2) | G5 III | aaCore emission line in an absorption line. Could not measure emission equivalent width. | |||||||
| 04554339+2044503 | 20.61 | 16.04 | 10.58 | 10.21 | 0.4 (0.7) | 1.1 (3.7) | F2 IV-V | ||||||
| 04565683+2308514 | 21.24 | 10.45 | 9.44 | 2.4 (6.1) | K2e-4e IV | aaCore emission line in an absorption line. Could not measure emission equivalent width. | aaCore emission line in an absorption line. Could not measure emission equivalent width. | -0.4059 | -3.193 | ||||
| 04573053+2235135 | HD 284988 | 20.25 | 16.12 | 9.08 | 8.46 | 4.5 (5.6) | 2.2 (5.3) | F2 | |||||
| 05034320+2228535 | 19.92 | 10.45 | 9.68 | 1.3 (3.9) | G2 III-IV | ||||||||
| 05040207+2020419 | 21.85 | 11.98 | 11.10 | 2.0 (4.6) | G8e-K0e III | aaCore emission line in an absorption line. Could not measure emission equivalent width. | aaCore emission line in an absorption line. Could not measure emission equivalent width. | -1.215 | |||||
| 05050209+2017375 | 21.99 | 11.66 | 10.79 | 1.5 (3.8) | G8-K1 V | ||||||||
| 05111074+2419209 | 14.67 | 14.61 | 12.52 | 12.46 | 2.0 (2.9) | 1.3 (3.7) | B1 V | ||||||
| 05111165+2356327 | 17.23 | 17.26 | 13.70 | 13.43 | 5.1 (4.9) | 2.1 (3.9) | B3 V | ||||||
| 05112064+2417542 | 21.04 | 11.48 | 10.65 | 1.9 (3.8) | K0 V | ||||||||
| 05112299+2359353 | 21.19 | 11.74 | 10.96 | 1.3 (3.2) | G8-K0? III-IV? | ||||||||
| 05114780+2329554 | 20.57 | 10.61 | 9.79 | 1.3 (3.9) | G3-5 IV-V | ||||||||
| 05122759+2253492 | 20.81 | 19.41 | 10.23 | 9.25 | 12.6 (16.5) | 3.8 (11.3) | M2e IV-V | -19.36 | -25.57 | -7.008 | bbSelf-absorbed profile. Could not measure emission equivalent width. | 0.5303 | |
| 05131650+2352552 | 20.80 | 19.49 | 12.83 | 12.21 | 7.6 (11.3) | 2.5 (7.6) | A2e V | bbSelf-absorbed profile. Could not measure emission equivalent width. | aaCore emission line in an absorption line. Could not measure emission equivalent width. | ||||
| 05135696+2351438 | 21.05 | 12.08 | 11.25 | 2.5 (5.1) | F8 V | ||||||||
| 05153663+2038127 | 21.02 | 11.10 | 10.28 | 1.3 (3.5) | F7 V | ||||||||
| 05161463+2313174 | 17.80 | 17.36 | 10.82 | 10.09 | 10.9 (16.5) | 3.8 (11.6) | A0e V | ccInverse P Cygni profile. Could not measure emission equivalent width. | ababfootnotemark: | ||||
| 05215550+2339297 | 21.13 | 12.20 | 11.48 | 1.3 (3.3) | F0 IV-V | ||||||||
| 05250924+2344444 | 22.14 | 21.83 | 14.15 | 13.73 | 3.5 (3.3) | -0.6 (-1.1) | A0-2 | ||||||
| Upper Scorpius Sources | |||||||||||||
| 15522878-1551090 | 19.68 | 11.63 | 10.92 | 1.8 (4.0) | K0-1 V | aaCore emission line in an absorption line. Could not measure emission equivalent width. | aaCore emission line in an absorption line. Could not measure emission equivalent width. | ||||||
| 15523589-1555386 | 21.35 | 12.32 | 11.51 | 1.7 (3.7) | K0 IV-V | aaCore emission line in an absorption line. Could not measure emission equivalent width. | aaCore emission line in an absorption line. Could not measure emission equivalent width. | ||||||
| 15525340-1504400 | 17.26 | 10.53 | 9.97 | 1.5 (4.3) | G1-3 V | ||||||||
| 15530107-1458325 | 19.74 | 13.06 | 12.48 | 1.8 (4.0) | G8p | ||||||||
| 15534689-1457364 | 20.27 | 12.99 | 12.12 | 4.1 (10.0) | K7 V? | aaCore emission line in an absorption line. Could not measure emission equivalent width. | aaCore emission line in an absorption line. Could not measure emission equivalent width. | ||||||
| 15534807-1740333 | 17.80 | 11.12 | 10.57 | 1.6 (4.1) | F7-G0 IV | ||||||||
| 15535071-1436057 | 20.59 | 13.94 | 13.31 | 2.3 (3.5) | F2-5 | ||||||||
| 16014778-1328293 | 19.52 | 12.31 | 11.68 | 1.8 (5.0) | F8-G2 III | ||||||||
| 16060455-1456342 | 18.84 | 13.06 | 12.51 | 2.4 (6.3) | F0-5 | ||||||||
| 16155520-1634512 | 16.36 | 12.89 | 12.64 | 1.6 (3.6) | A0 IV? | ||||||||
| 16163981-1527048 | 19.47 | 12.95 | 12.39 | 1.7 (4.5) | F3-5 V? | ||||||||
| 16181899-1526538 | 18.67 | 12.14 | 11.57 | 1.9 (4.8) | F3-5 IV | ||||||||
| 16183457-1654379 | 21.12 | 10.66 | 9.73 | 1.6 (3.6) | K2-3 III | aaCore emission line in an absorption line. Could not measure emission equivalent width. | aaCore emission line in an absorption line. Could not measure emission equivalent width. | ||||||
| 16184513-1419042 | 20.85 | 13.76 | 12.90 | 4.2 (8.1) | M1e-2e II-III? | ||||||||
| 16184596-1659455 | 19.73 | 12.46 | 11.61 | 3.9 (9.1) | K4e V | aaCore emission line in an absorption line. Could not measure emission equivalent width. | aaCore emission line in an absorption line. Could not measure emission equivalent width. | -0.4271 | |||||
| 16185702-1632303 | 20.80 | 13.94 | 13.30 | 2.2 (3.7) | G1-3 V | ||||||||
| 16195506-1538250 | Sco X-1, Non-member | 13.96 | 11.91 | 11.15 | 8.2 (21) | LMXB | -0.92 | -5.14 | |||||
| 16212481-1523160 | 18.73 | 10.20 | 9.43 | 1.9 (5.4) | K2 III | aaCore emission line in an absorption line. Could not measure emission equivalent width. | aaCore emission line in an absorption line. Could not measure emission equivalent width. | ||||||
| 16220590-1505118 | 18.93 | 10.47 | 9.72 | 1.7 (4.8) | G3 V | aaCore emission line in an absorption line. Could not measure emission equivalent width. | |||||||
| 16232902-1601156 | 18.73 | 10.68 | 9.96 | 1.8 (6.0) | F2-3 IV | ||||||||
| 16333769-1711347 | 20.00 | 13.88 | 13.05 | 4.9 (4.9) | F5-7 | ||||||||
Note. — GALEX magnitudes are in AB, infrared magnitudes are in the 2MASS system. If we know of an association between the GALEX source and a known object, and if the literature confirms or rules out membership in Taurus or Upper Scorpius, we list the information in the “Previous Literature” column.
| Taurus | Upper Scorpius | |||||||||
|---|---|---|---|---|---|---|---|---|---|---|
| Type | Sources | Ca II | H I | Li I | Young | Sources | Ca II | H I | Li I | Young |
| Excess Sources | ||||||||||
| B | 2 | 0 | 0 | 0 | 0 | 0 | 0 | 0 | 0 | 0 |
| A | 5 | 0 | 2 | 0 | 2 | 1 | 0 | 0 | 0 | 0 |
| F | 11 | 0 | 0 | 0 | 0 | 7 | 0 | 0 | 0 | 0 |
| G | 13 | 3 | 2 | 0 | 3 | 5 | 1 | 0 | 0 | 1 |
| K | 5 | 2 | 2 | 0 | 2 | 6 | 6 | 1 | 0 | 6 |
| M | 7 | 5 | 5 | 3 | 5 | 1 | 0 | 0 | 0 | 0 |
| Total | 43 | 11 | 11 | 3 | 13 | 20 | 7 | 1 | 0 | 7 |
| Excess Sources | ||||||||||
| A | 4 | 0 | 2 | 0 | 2 | 0 | 0 | 0 | 0 | 0 |
| F | 4 | 0 | 0 | 0 | 0 | 2 | 0 | 0 | 0 | 0 |
| G | 5 | 1 | 1 | 0 | 1 | 1 | 0 | 0 | 0 | 0 |
| K | 1 | 1 | 1 | 0 | 1 | 3 | 2 | 1 | 0 | 2 |
| M | 6 | 4 | 4 | 2 | 4 | 1 | 1 | 0 | 0 | 1 |
| Total | 20 | 6 | 8 | 2 | 8 | 7 | 3 | 1 | 0 | 3 |
Note. — Number of spectroscopically observed stars by spectral type, followed by total number of Ca-emission, Balmer-emission, and Li-absorption stars. The last column in each section lists the number of stars that had at least one of these three indicators.
| East Taurus | Central Taurus | West Taurus | Upper Scorpius | |
|---|---|---|---|---|
| Sources | ||||
| total sources | 20 | 54 | 27 | 19 |
| literature members | 0 | 4 | 1 | 0 |
| literature non-members | 0 | 5 | 4 | 0 |
| Palomar target with no emission lines | 6 | 5 | 3 | 4 |
| Palomar background target with emission | 2 | 0 | 0 | 0 |
| Palomar non-background target with emission, no lithium | 0 | 3 | 0 | 5 |
| Palomar non-background target with emission, lithium | 1 | 1 | 0 | 0 |
| unidentified stars | 11 | 36 | 19 | 10 |
| expected emission-line stars in unidentified group | 2-3 | 6-13 | 0-4 | 3-6 |
| Sources | ||||
| total sources | 8 | 25 | 3 | 6 |
| literature members | 0 | 3 | 0 | 0 |
| literature non-members | 0 | 4 | 0 | 0 |
| Palomar target with no emission lines | 1 | 3 | 2 | 2 |
| Palomar background target with emission | 1 | 0 | 0 | 0 |
| Palomar non-background target with emission, no lithium | 0 | 3 | 0 | 3 |
| Palomar non-background target with emission, lithium | 1 | 0 | 0 | 0 |
| unidentified stars | 5 | 12 | 1 | 1 |
| expected emission-line stars in unidentified group | 3 | 5-6 | 0 | 0 |
Note. — Total number of UV excess sources above the 140 pc main sequence, broken down by whether we determined membership from previous literature or from our Palomar observations. We do not count Palomar targets that are also identified in the literature. Because our Taurus fields cover a large region we divide them into western (), central (), and eastern () groups, following Slesnick et al. (2006).
| Youth | PM RA | PM Dec. | PM Error | |||
|---|---|---|---|---|---|---|
| 2MASS | Spectral Type | Indicators | (mas/yr) | (mas/yr) | (mas/yr) | PM Member? |
| Taurus Sources | ||||||
| 04110570+2216313 | M4e V | Ca, H | +2.8 | -19.3 | 3.4 | Yes |
| 04301583+2113173 | M2e-3e III-V | Ca, H | -33.6 | +9.2 | 3.3 | No |
| 04505356+2139233 | M2e V | Ca, H, Li | +0.7 | -20.3 | 3.6 | Yes |
| 04565683+2308514 | K2e-4e IV | Ca, H | +8.9 | -6.6 | 3.7 | No |
| 05122759+2253492 | M2e IV-V | Ca, H, Li | +0.8 | -15.4 | 3.1 | Yes |
| Upper Scorpius Sources | ||||||
| 15534689-1457364 | K7 V? | Ca | -19.3 | -10.6 | 3.5 | Yes |
| 16183457-1654379 | K2-3 III | Ca | +1.8 | -0.4 | 3.1 | No |
| 16184596-1659455 | K4e V | Ca, H | +1.9 | -38.9 | 3.1 | No |
| 16220590-1505118 | G3 V | Ca | +2.6 | +12.9 | 3.4 | No |
Note. — These are the emission-line stars with spectral type and CMD location consistent with Taurus or Upper Scorpius membership. We also present proper motions and errors calculated by A. Kraus (2009, private communication) from published positions along with a qualitative indication of whether the proper motion is consistent with membership in the Taurus or Upper Scorpius association, respectively.
| Type | (mag) | (mag) | (mag) | (mag) |
|---|---|---|---|---|
| B8 | 1.47 | 0.88 | 0.01 | 0.11 |
| A0 | 3.52 | 2.49 | 0.54 | 0.56 |
| A2 | 4.88 | 3.40 | 1.12 | 1.12 |
| A5 | 6.88 | 4.39 | 1.53 | 1.48 |
| A7 | 8.52 | 5.20 | 1.75 | 1.66 |
| F0 | 9.77 | 5.94 | 2.10 | 1.96 |
| F2 | 10.91 | 6.54 | 2.32 | 2.14 |
| F5 | 13.46 | 7.73 | 2.85 | 2.61 |
| F8 | 15.25 | 8.59 | 3.31 | 3.01 |
| G0 | 16.43 | 9.13 | 3.53 | 3.20 |
| G2 | 17.40 | 9.60 | 3.64 | 3.30 |
| G5 | 18.07 | 10.01 | 3.86 | 3.48 |
| G8 | 19.45 | 10.94 | 4.31 | 3.86 |
| K0 | 21.23 | 11.99 | 4.49 | 4.00 |
| K2 | 24.11 | 13.65 | 4.80 | 4.24 |
| K4 | 27.15 | 15.50 | 5.08 | 4.43 |
| K5 | 28.75 | 16.69 | 5.20 | 4.51 |
| K7 | 29.98 | 17.80 | 5.46 | 4.70 |
| M0 | 30.84 | 18.73 | 6.04 | 5.18 |
| M1 | 31.74 | 19.47 | 6.33 | 5.47 |
| M2 | 33.02 | 20.46 | 6.73 | 5.86 |
| M3 | 7.31 | 6.44 | ||
| M4 | 8.10 | 7.22 | ||
| M5 | 9.08 | 8.16 | ||
| M6 | 10.15 | 9.16 | ||
| M7 | 10.76 | 9.69 | ||
| M8 | 11.19 | 10.03 | ||
| M9 | 11.49 | 10.26 | ||
| L0 | 11.76 | 10.44 |
Note. — GALEX magnitudes are given on the AB system; 2MASS magnitudes are Vega-based.
| Distance | |||||
|---|---|---|---|---|---|
| ID | Type | (pc) | (K) | (mag) | (mag) |
| WD 1134+300 | DA2 | 15.32 | 16000 | 11.11 | 11.41 |
| WD 2326+049 | DA4 | 13.62 | 13000 | 14.41 | 13.13 |
| WD 2105-820 | DA6 | 17.06 | 11000 | 15.80 | 13.21 |
| WD 1609+135 | DA6 | 18.35 | 9000 | 18.78 | 14.86 |
| WD 1953-011 | DA6 | 11.39 | 20.48 | 15.10 |
Note. — The temperatures are estimated from comparing the color to Kawka & Vennes (2007).