Evidences of evanescent Bloch waves in Phononic Crystals
Abstract
We show both experimentally and theoretically the evanescent behaviour of modes in the Band Gap (BG) of finite Phononic Crystal (PC). Based on experimental and numerical data we obtain the imaginary part of the wave vector in good agreement with the complex band structures obtained by the Extended Plane Wave Expansion (EPWE). The calculated and measured acoustic field of a localized mode out of the point defect inside the PC presents also evanescent behaviour. The correct understanding of evanescent modes is fundamental for designing narrow filters and wave guides based on Phononic Crystals with defects.
pacs:
43.20.+g, 43.35.+d, 63.20.D-, 63.20.PwDuring the past few years, there has been a great deal of interest in studying propagation of waves inside periodic structures. These systems are composites made of inhomogeneous distribution of some material periodically embedded in other with different physical properties. Phononic crystals (PC) Sigalas93 ; Kushwaha94PRB are one of the examples of these systems. PC are the extension of the so-called Photonic crystals Yablonovitch when elastic and acoustic waves propagate in periodic structures made of materials with different elastic properties. When one of these elastic materials is a fluid medium, then PC are called Sonic Crystals (SC) Martinez95 ; Sanchez98 .
For these artificial materials, both theoretical and experimental results have shown several interesting physical properties Joannopoulus08 . In the homogenization limit Torrent06 , it is possible to design acoustic metamaterials that can be used to build refractive devices Torrent07 . In the range of wavelengths similar to the periodicity of the PC (), multiple scattering process inside the PC leads to the phenomenon of so called Band Gaps (BG),which are required for filtering sound Sanchez98 , trapping sound in defects Wu01 ; Wu09 and for acoustic wave guiding Vasseur08 .
Propagating waves inside a periodic media are a set of solutions of the wave equations satisfying the translational symmetry property. However, periodic media with point defects where the translational symmetry is broken, or finite periodic media, can support evanescent modes as well. Recently Laude et al. Laude09 have analyzed the evanescent Bloch waves and the complex band structure of PC. Complex band structures show bands that are simply not revealed by the traditional method. By means of the complex band structures, BG can be defined as ranges of frequencies where all Bloch waves must be evanescent.
The goal of the paper is to characterize the evanescent behaviour of waves with frequencies in the BG inside of PC. Analytical, numerical and experimental data show the evidences for the exponential-like decay of these modes. Engelen et al. Engelen09 shown that modes inside BG in photonic crystals decay multiexponentially. Supercell approximation in Extended Plane Wave Expansion (EPWE) Hsue05 ; Laude09 ; Romero10 has been used in the preseent work to determine the imaginary part of the wave vector of evanescent modes. Specifically, we have deduced both analytically and experimentally the imaginary part of the wave vector observing that only the first harmonic contributes substantially to the decay of the acoustic field inside complete SC. In all cases we have obtained a very good agreement between theoretical and experimental results.
We have performed experiments in an echo-free chamber of dimensions 863m3. The finite 2D SC used in this paper forms a square array with lattice constant cm. The size of the SC is 55 and the radius of the cylinders is cm. A prepolarized free-field 1/2” microphone Type B&K has been used throughout the experiments. The diameter of the microphone is cm, which is approximately . Our system 3DReAMS (3D Robotized e-Acoustic Measurement System) is capable of sweeping the microphone through a 3D grid of measuring points located at any trajectory inside the echo-free chamber. Motion of the robot is controlled by NI-PCI 7334.
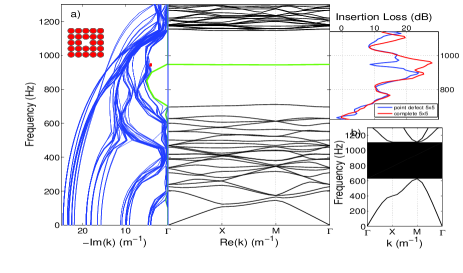
Figure 1 shows the complex and real band structures for the SC with a point defect. The complex band structures and the value of the number for the modes inside the BG can be obtained by EPWE and it becomes in a purely real value for the localized mode. We can observe the localized mode at Hz (green continuous line). That value exactly coincides with the value obtained by Plane Wave Expansion (PWE) with supercell approximation. We have compared these results with experimental data measuring the Insertion Loss (IL) behind the SC with and without the point defect. In Figure 1 we can observe that the experimental IL for the localized mode at frequency Hz (blue line) is lower than the case of the complete SC (red line), i.e., it can be concluded that there is a passing mode. This results because the localized mode is not killed completely by the SC around the point defect (see also Wu09 ). In fact, although the localized mode has an evanescent behaviour, as we will see later, in this case there is not enough number of rows around the point defect to kill it.
For frequencies in the BG, the borders of the point defect act as perfect mirrors producing the localization in this cavityJoannopoulus08 . The localized mode sees a complete SC from inside the point defect in every directions. Thus, the localized mode should present out of the cavity a decay analogous to a wave with the same frequency impinging over the SC from outside. Both cases should be represented by the same , i.e., by the same evanescent behaviour. There are several values of the imaginary part of the wave vector at the localized frequency in the Complex Band structures shown in Figure 1 which shows the multiexponential behaviour. In this paper we show for the localized frequency, 920Hz, that the first harmonic obtained from the Figure 1 (red square), m-1, can represent thee decay of the mode inside the SC. The contribution to the next harmonics to the multiexponential decay can be neglected.
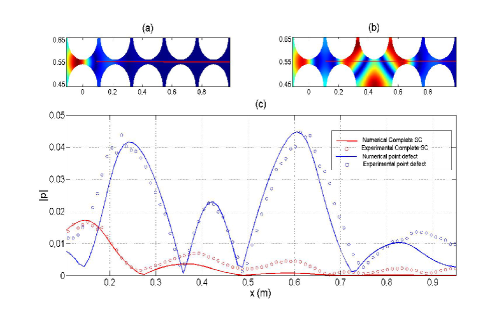
In order to study this behaviour of the localized mode we have analyzed numerically the acoustic field inside the SC. In Figures 2a and 2b we can observe the maps obtained by Finite Element Method (FEM) for the complete SC and for the SC with a point defect respectively. In Figure 2c we represent both numerical and experimental absolute values of the pressure for complete SC and for SC with a point defect corresponding to the cross sections marked with a red line in Figures 2a and 2b. Experimental results are also plotted in Figure 2c.
For a complete SC, we can observe in Figure 2 both numerically (red continuous) and experimentally (red open circles) exponential-like decay of the mode with the distance all along the SC without point defect. From these experimental data, we have chosen the points with maximum values in order to fit an exponential . The values of the parameters in the fit are and m-1.
In the blue line in Figure 2c we can observe the effect of the point defect in the acoustic field inside the SC. In the region of the point defect there is an increasing value of the acoustic pressure because of the localized mode. We can also observe that the absolute value of the pressure for the localized mode is bigger than in the case of the complete SC at the end of the SC, proving the passing mode shown in Figure 1. To enhance the localization of the sound inside the SC we would need a SC with a bigger number of rows around the point defect as it was shown by some authorsWu09 .
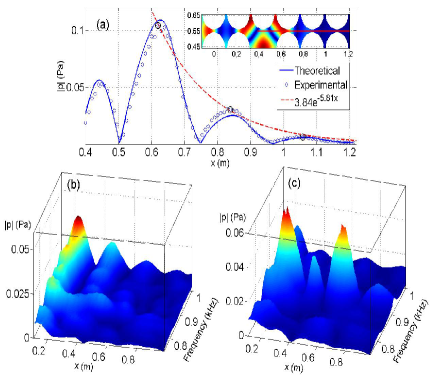
The border of the cavity is located approximately at m as we can observe in Figure 2b. From this point to the end of the SC we can observe that the acoustic field is drastically reduced, but with these evidences we cannot confirm that the behaviour of the localized mode out of the cavity is evanescent. To do that, we have analyzed the sound inside a bigger SC with a point defect (see inset of Figure 3a). Figure 3a presents both numerical (blue line) and experimental (blue open circles) values of the acoustic field from the end of the cavity to the end of a SC showing the evanescent behaviour of the localized mode out of the cavity. Analogously as the case of complete SC, here we have also chosen the points with maximum values (see black open circles in Figure 3a) in order to fit an exponential decay . The values of the parameters in the fit are and m-1 and the curve is also plotted in Figure 3a with red dashed line. From the experimental point of view we are constrained by the size of the SC, and as a consequence we have only been able to use a few points for the exponential fit. This results in a big error in the parameters of the fit. Even so, the value obtained for the is very closed to the one obtained both analytically (EPWE) and experimentally for the complete SC. The difference is less than 4% in both cases.
We have analyzed one frequency (Hz) inside the BG, but this exponential-like decay should be observed for every the frequencies inside BG independently if there is or not a point defect in the SC. Figures 3b and 3c represent the experimental 3D spectra for both complete SC and SC with a point defect respectively. in the range of frequencies [750, 1000]Hz, in the BG. In Figure 3b we observe the experimental evidences of the evanescent behaviour for all the modes inside the BG for a complete SC. For the case of the SC with a point defect there is a change in the propagation properties. We observe clearly in Figure 3c the evanescent behaviour of the localized frequencies out of the region of the point defect and how the localization is produced, showing the effect of the cavityWu09 . We can also observe in Figure 3c the evanescent behaviour for all modes out of the frequencies of the localization range.
The propagation of waves inside periodic structures consists on both propagating and evanescent modes. Using EPWE we have observed the evanescent nature of the modes inside the BG with negative complex Bloch vectors. From the experimental point of view we have observed that the exponential-like decay is dominated by the first harmonic of the Fourier expansion of the Bloch wave, obtaining this exponential-like decay for the modes in the BG (m-1 for Hz) and for localized modes in a SC with a point defect (m-1). From analytical and experimental data we can conclude that localized modes present evanescent behaviour out of the cavity with the same exponential-like decay than a wave with the same frequency impinging over a complete SC. Due to the breaking periodicity, the physical situations are very different between complete SC and SC with point defects, even so we can conclude that the space observed by the localized wave from inside of the cavity is topologically equivalent to the observed by the same wave from outside of a complete SC. This work is fundamental for the correct understanding of the design of narrow filters and wave guides based on Phononic Crystals with point defects.
Acknowledgements.
This work was supported by MEC (Spanish Government) and FEDER funds, under grands MAT2009-09438 and MTM2009-14483-C02-02. Authors want to thanks J. M. Herrero, S. García-Nieto, and X. Blasco for their work in the control and acquisition system of 3DReAMS.References
- (1) M. Sigalas and E. Economou, Solid State Commun. 86, 141 (1993)
- (2) M. S. Kushwaha, P. Halevi, G. Martínez, L. Dobrzynski, and B. Djafari-Rouhani, Phys. Rev. B 49, 2313 (1994)
- (3) E. Yablonovitch, Phys. Rev. Lett. 58, 2059 (1987)
- (4) R. Martínez-Sala, J. Sancho, J. V. Sánchez, V. Gómez, J. Llinares, and F. Meseguer, nature 378, 241 (1995)
- (5) J. V. Sánchez-Pérez, D. Caballero, R. Martínez-Sala, C. Rubio, J. Sánchez-Dehesa, F. Meseguer, J. Llinares, and F. Gálvez, Phys. Rev. Lett. 80, 5325 (1998)
- (6) J. D. Joannopoulus, S. G. Johnson, J. N. Winn, and R. D. Meade, Photonic Crystals. Molding the Flow of Light (Princeton University press, Princeton, 2008)
- (7) D. Torrent, A. Hakansson, F. Cervera, and J. Sánchez-Dehesa, Phys. Rev. Lett. 96, 204302 (2006)
- (8) D. Torrent, J. Sánchez-Dehesa, New. Jour. Phys. 9, 323 (2007)
- (9) F. Wu, Z. Hou, Z. Liu, and Y. Liu, Phys. Lett. A 292, 198 (2001)
- (10) L. Wu, L. Chen, and C. Liu, Physica B 404, 1766 (2009)
- (11) J. O. Vasseur, P. A. Deymier, B. Djafari-Rouhani, Y. Pennec, and A.C. Hladky-Hennion, Phys. Rev.B 77, 085415 (2008)
- (12) R. J. P. Engelen, D. Mori, T. Baba, and L. Kuipers, Phys. Rev. Lett. 102, 023902 (2009)
- (13) V. Laude, Y. Achaoui, S. Benchabane, and A. Khelif, Phys. Rev. B 80, 092301 (2009)
- (14) V. Romero-García, J.V. Sánchez-Pérez, and L.M. Garcia-Raffi, Preprint, arXiv:1001.3758v1 (2010)
- (15) Young-Chung Hsue, Arthur J. Freeman, and Ben-Yuan Gu, Phys. Rev B 72, 195118 (2005)
- (16) A. Khelif, A. Choujaa, B. Djafari-Rouhani, M. Wilm, S. Ballandras, and V. Laude, Phys. Rev. B 68, 214301 (2003)