Testing PDR models against ISO fine structure line data for extragalactic sources.
Abstract
Far-infrared [C ii] 158-m, [O i] 145-m and [O i] 63-m fine structure emission line fluxes were measured from archival Infrared Space Observatory Long Wavelength Spectrometer spectra of 46 extragalactic sources, with 28 sources providing detections in all three lines. For 12 of the sources, the contribution to the [C ii] 158-m line flux from H ii regions could be estimated from their detected [N ii] 122-m line fluxes. The measured [C ii]/[O i] and [O i] 63/145-m line flux ratios were compared with those from a grid of PDR models previously computed using the UCL_PDR code. Persistent offsets between the observed and modelled line ratios could be partly attributed to the effects of [O i] 63-m self-absorption. Using the SMMOL code, we calculated model [O i] line profiles and found that the strength of the [O i] 63-m line was reduced by 20-80%, depending on the PDR parameters. We conclude that high PDR densities and radiation field strengths, coupled with the effects of [O i] 63-m self-absorption, are likely to provide the best match to the observed line flux ratios.
keywords:
FIR fine structure emission lines, PDRs, Extragalactic Sources, ISO LWS, Oxygen self-absorption.1 Introduction
Studies of our own Galaxy and observations of external galaxies have suggested that stellar ultraviolet radiation can ionize vast volumes of a galaxy and that far-ultraviolet radiation impinging on neutral cloud surfaces is responsible for a large fraction of the observed far-infrared (FIR) spectral line emission that cools the gas (Crawford et al., 1985). The relative contributions from different gas phases can be estimated from observations of several FIR forbidden lines. Fine structure (FS) emission lines can be used as tracers of nebular conditions such as density, excitation and ionization. By virtue of their different excitation potentials and critical densities, FS emission lines provide an insight into the energetics and chemical composition of the regions from which they originate. The FIR fine structure lines of abundant species, such as [C ii] and [O i], have long been recognised as one of the most important coolants in the interstellar medium (ISM). In particular, the emission from singly ionized carbon [C ii], at =158 m, is known to trace warm and dense photodissociation regions (PDRs) and is used to trace the gas surrounding active star-forming regions. Carbon is the fourth most abundant element and has a lower ionization potential (11.26 eV) than hydrogen. For this reason it is predominantly in the form of C+ in the surface layers of PDRs, where photoionization of neutral carbon is effective, but can potentially also be excited in ionized regions. [C ii] 158m emission is reasonably easy to excite, with a transition energy of 92 K. The line is widely observed and is usually optically thin. The depth of the C+ zones in neutral clouds is generally determined by dust extinction of carbon ionizing photons and often extends to Av 4, although C+ decreases in abundance for Av1 (Bell et al., 2006).
Another important species is oxygen, which has an ionization potential of 13.62 eV, slightly above that of hydrogen. This means that the ionization structure of OO0 closely follows the ionization structure of hydrogen. Also, the charge exchange of neutral oxygen in two-body recombination with hydrogen cannot be neglected as it affects the ionization balance. The incident FUV radiation maintains a significant abundance of atomic oxygen deep into the cloud through photodestruction of CO and O2. All oxygen not incorporated into CO can remain in atomic form to depths as large as Av=10 mag under strong FUV irradiation (Sternberg & Dalgarno, 1995).The fraction of oxygen at magnitudes greater than 10 depends on the physical conditions in the cloud (i.e. its density, metallicities and radiation field strength), but essentially if the gas density is 105 cm-3 at these depths, the oxygen not locked in CO is depleted on the grains. However for the purpose of these calculations, the code that we use, UCL_PDR, does not take into account freeze out reactions. Atomic oxygen has two fine structure transitions, at 63 and 145 m. The [O i] line at 63m has an excitation energy corresponding to 228 K, is emitted predominantly by warm and dense gas, although it can also have an ionized gas component (Aannestad & Emery, 2003), and can act as a coolant in neutral hydrogen regions. It may also be a heating agent as O i can heat the gas through the collisional de-excitation of the dust continuum radiation-excited fine structure level (Tielens & Hollenbach, 1985). However this mechanism is not well studied. This line is optically thick in some cases (Abel et al., 2007) and its optical depth can be estimated by comparing the [O i] line flux at 63m to that of the [O i] line at 145m (Abel et al., 2007). The [O i] 145m line can be harder to detect: in fact the relative faintness of this line diminishes its capabilities as a robust PDR diagnostic. The lower level of the 145m line is not the ground state of O0, meaning that [O i] 145m emission is usually optically thin (Abel et al., 2007). The 145m line has an excitation energy of 326 K, almost 100 K higher than that of the 63m line, so the ratio of the two line intensities is sensitive to the gas temperature for T300 K. Since the strength of the FUV radiation field governs the heating of the gas, this line ratio is also a diagnostic of the incident FUV flux (Tielens & Hollenbach, 1985).
In the presence of foreground cold and tenuous gas the [O i] 63m line can show both emission and absorption components (Tielens & Hollenbach, 1985; Liseau et al., 2006; González-Alfonso et al., 2004). Nevertheless observations of the FIR fine structure emission lines of [O i] and [C ii] can be used as diagnostics to infer the physical conditions in the emitting gas, such as temperatures, densities and radiation field strengths, by comparing with models of photodissociation regions (Tielens & Hollenbach, 1985) and Hii regions (Rubin et al., 1991). In the past, several models have been used to interpret infrared, submillimeter and millimeter line observations of neutral gas in our own Galaxy as well as in the central regions of nearby starburst galaxies (e.g. Mao et al., 2000; Seaquist & Frayer, 2000; Wild et al., 1992, and references therein).
In this paper we will use FIR line fluxes measured from the ISO archive for a sample of extragalactic sources. We present the fluxes of fine structure emission lines observed by ISO from 46 sources and we estimate the bulk properties of the gas in these external galaxies using the UCL_PDR model of Bell et al. (2005) and the radiative transfer code SMMOL (Rawlings & Yates, 2001).
The paper is structured as follows: in Section 2 we give details of the sources selected and the fine structure emission line fluxes we measured. In Section 3 we describe the UCL_PDR models. In Section 4 we evaluate the sensitivity of the UCL_PDR models to variations in the physical parameters. In Section 5 we will consider the contribution of H ii regions to fine structure emission lines. The results are given in Section 6, and there we discuss their interpretation in the context of our SMMOL line profile calculations. Concluding remarks are given in Section 7.
2 The ISO data
All the FIR data included in this paper were acquired using the ISO Long Wavelength Spectrometer (LWS; Clegg et al., 1996), which had an estimated FWHM beam size of 80 arcsec.
We collected [C ii]158m, [O i]145m and 63m emission line fluxes from ISO LWS archival observations for 46 external galaxies. The [C ii]158m, [O i]145m, 63m emission line fluxes were measured from the spectra using the interactive package SMART (Spectroscopy Modeling Analysis and reduction Tool; Higdon et al. (2004).)
| Index | Source | Radial Vel | TDT No. of | [CII] 158m | [OI] 63m | [OI] 145m | [CII]158 | [OI]63 | |
|---|---|---|---|---|---|---|---|---|---|
| (km s-1) | Observation | [OI]63 | [OI]145 | ||||||
| 1 | IC 10 | -348 | 45700609 | 0.9660.034 | 0.5910.025 | 0.02170.0032 | 1.640.13 | 27.235.17 | |
| 0.7630.021 | 0.650.02 | 0.0240.004 | 1.170.07 | 27.085.34 | |||||
| 2 | Haro 11 | 6175 | 54900720 | 0.04100.0022 | 0.09540.0041 | 0.0086 | 0.430.04 | n.a | |
| 0.0390.001 | 0.0920.018 | 0.0030.001 | 0.420.09 | 30.616.2 | |||||
| 3 | NGC 253 | 243 | 56901708 | 4.6180.126 | 3.470.16 | 0.461 0.074 | 1.330.09 | 7.531.55 | |
| 5.191.04 | 3.760.75 | 0.520.11 | 1.380.55 | 7.232.97 | |||||
| 4 | NGC 520 | 2281 | 77702295 | 0.21880.0045 | 0.290.015 | 0.01330.0028 | 0.750.05 | 21.805.72 | |
| 0.280.06 | 0.210.04 | 0.020.01 | 1.330.54 | 10.57.3 | |||||
| 5 | Maffei 2 | -17 | 85800682 | 1.0720.051 | 0.5120.051 | 0.0710.021 | 2.090.31 | 7.212.85 | |
| 1.210.24 | 0.530.11 | 0.050.01 | 2.280.93 | 10.64.3 | |||||
| 6 | NGC 1068 | 1137 | 60500401 | 1.8810.062 | 1.4160.043 | 0.15220.0024 | 1.330.08 | 9.300.43 | |
| 2.130.43 | 1.600.32 | 0.090.02 | 1.330.54 | 17.87.5 | |||||
| 7 | IC 342 | 31 | 64600302 | 0.31460.0097 | 0.117 | 0.02020.0049 | n.a | n.a | |
| n.a | n.a | n.a | n.a | n.a | |||||
| 8 | NGC 1482 | 1916 | 79600984 | 0.5710.022 | 0.3620.025 | 0.057 | 1.580.17 | n.a | |
| 0.6550.013 | 0.3180.063 | n.a | 2.060.45 | n.a | |||||
| 9 | NGC 1569 | -104 | 64600489 | 0.6520.027 | 0.6570.025 | 0.00850.0019 | 0.990.08 | 77.320.2 | |
| 0.6740.134 | 0.5890.119 | n.a | 1.140.46 | n.a | |||||
| 10 | NGC 1614 | 4778 | 85501010 | 0.19530.0067 | 0.3460.016 | 0.01790.0026 | 0.560.05 | 19.333.70 | |
| 0.2260.010 | 0.3430.016 | n.a | 0.650.05 | n.a | |||||
| 11 | NGC 2146 | 893 | 67900165 | 2.4790.078 | 1.7560.091 | 0.1640.023 | 1.410.12 | 10.702.06 | |
| 2.620.52 | 1.730.35 | 0.100.02 | 1.510.61 | 17.36.7 | |||||
| 12 | NGC 2388 | 4134 | 71802360 | 0.14730.0073 | 0.09540.0058 | 0.00320.0010 | 1.540.17 | 29.8111.13 | |
| 0.1910.038 | 0.0970.019 | n.a | 1.970.77 | n.a | |||||
| 13 | M 82 | 203 | 65800611 | 13.020.30 | 16.700.59 | 1.3660.056 | 0.780.05 | 12.230.93 | |
| 12.792.59 | 16.943.38 | 1.460.29 | 0.750.31 | 11.604.62 | |||||
| 14 | NGC 3256 | 2804 | 25200456 | 1.1240.044 | 1.1780.033 | 0.032 | 0.950.03 | n.a | |
| 1.370.27 | 1.280.26 | n.a | 1.070.43 | n.a | |||||
| 15 | IRAS 10565 | 12921 | 20200453 | 0.05510.0076 | 0.08480.0069 | 0.011 | 0.650.14 | n.a | |
| +2448 | |||||||||
| 0.0470.009 | 0.0760.008 | n.a | 0.610.18 | n.a | |||||
| 16 | NGC 3620 | 1680 | 27600981 | 0.1730.012 | 0.1520.093 | 0.046 | 1.140.77 | n.a | |
| 0.2490.049 | 0.1640.029 | 0.0290.006 | 1.520.57 | 5.652.17 | |||||
| 17 | NGC 3690 | 3121 | 18000704 | 0.7550.028 | 0.8950.084 | 0.0740.012 | 0.840.11 | 12.093.10 | |
| 0.860.17 | 0.830.17 | 0.050.005 | 1.030.41 | 16.65.1 | |||||
| 18 | NGC 4039/9 | 1641 | 25301107 | 0.3780.011 | 0.4120.079 | 0.02110.0041 | 0.920.20 | 19.537.54 | |
| 0.370.01 | 0.340.07 | n.a | 1.090.25 | n.a | |||||
| 19 | NGC 4102 | 846 | 19500584 | 0.3220.012 | 0.3410.022 | 0.01410.0041 | 0.9440.096 | 24.188.59 | |
| 0.2890.049 | 0.2690.049 | 0.0220.004 | 1.070.38 | 12.224.45 | |||||
| 20 | NGC 4151 | 995 | 35800185 | 0.05510.0043 | 0.4010.032 | 0.03310.0047 | 0.140.02 | 12.112.71 | |
| 35300163 | 0.0740.006 | 0.3760.029 | n.a | 0.190.031 | n.a | ||||
| 21 | NGC 4194 | 2501 | 19401369 | 0.20940.0073 | 0.2670.010 | 0.0057 | 0.780.06 | n.a | |
| 0.2170.008 | 0.280.02 | 0.0130.003 | 0.770.08 | 21.536.50 | |||||
| 22 | NGC 4449 | 207 | 23400120 | 0.23830.0086 | 0.1510.046 | 0.01870.0044 | 1.580.53 | 8.074.36 | |
| 0.2780.008 | 0.1330.013 | n.a | 2.090.26 | n.a | |||||
| 23 | NGC 4490 | 565 | 20501578 | 0.4300.014 | 0.3330.017 | 0.0063 | 1.290.11 | n.a | |
| 0.4230.084 | 0.3280.065 | 0.0110.002 | 1.290.51 | 29.8111.33 | |||||
| 24 | NGC 4670 | 1609 | 58000205 | 0.09540.0083 | 0.7170.075 | 0.02480.0051 | 0.130.03 | 28.918.97 | |
| 0.0940.008 | 1.13 | 0.17 | n.a | n.a | |||||
| 25 | NGC 4945 | 563 | 28000446 | 3.5470.075 | 1.820.061 | 0.38 0.021 | 1.950.11 | 4.790.43 | |
| 3.520.70 | 1.930.39 | 0.340.07 | 1.820.73 | 5.672.31 | |||||
| 26 | Cen A | 547 | 63400464 | 2.7640.085 | 1.7570.068 | 0.1020.0062 | 1.570.11 | 17.231.71 | |
| 2.900.58 | 1.920.39 | 0.100.02 | 1.510.61 | 19.27.74 | |||||
| 27 | NW Cen A | 547 | 45400151 | 2.790.22 | 0.9840.070 | 0.07440.0058 | 2.830.43 | 13.221.97 | |
| 2.430.48 | 0.900.18 | 0.080.02 | 2.71.1 | 11.255.06 | |||||
| 28 | M 51 | 600 | 35100651 | 0.9510.048 | 0.6230.057 | 0.02680.0038 | 1.530.22 | 23.255.42 | |
| 1.040.01 | 0.440.09 | n.a | 2.360.51 | n.a | |||||
| 29 | M 83 | 513 | 64200513 | 1.2020.051 | 1.370.29 | 0.1370.032 | 0.880.22 | 10.04.45 | |
| 1.760.35 | 1.180.24 | 0.100.02 | 1.490.60 | 11.84.8 | |||||
| 30 | Circinus | 434 | 10401133 | 2.610.10 | 2.1700.084 | 0.16060.023 | 1.200.09 | 3.580.27 | |
| 2.650.53 | 2.300.46 | 0.180.05 | 1.150.46 | 12.776.10 | |||||
| 31 | Mrk 297 | 4739 | 62702069 | 0.2270.027 | 0.2910.037 | 0.19 | 0.780.19 | n.a | |
| 0.210.008 | 0.2250.18 | 0.18 | 0.930.78 | n.a | |||||
| 32 | NGC 6240 | 7339 | 27801108 | 0.24470.0082 | 0.6510.027 | 0.03490.0029 | 0.380.03 | 18.652.32 | |
| 0.290.06 | 0.690.14 | 0.0310.007 | 0.420.17 | 22.269.54 | |||||
| 33 | NGC 6810 | 2031 | 84700610 | 0.3110.014 | 0.220.031 | 0.016 | 1.410.26 | n.a | |
| 0.400.08 | 0.180.04 | n.a | 2.220.93 | n.a | |||||
| 34 | NGC 6946 | 48 | 45700139 | 0.8760.028 | 0.6110.024 | 0.061 | 1.430.10 | n.a | |
| 1.030.21 | 0.590.12 | 0.050.01 | 1.740.71 | 11.84.8 |
| Index | Source | Radial Vel | TDT No. of | [CII] 158m | [OI] 63m | [OI] 145m | [CII]158 | [OI]63 |
|---|---|---|---|---|---|---|---|---|
| (km s-1) | Observation | [OI]63 | [OI]145 | |||||
| 35 | NGC 7673 | 3408 | 76601364 | 0.10610.0041 | 0.1720.041 | 0.0075 | 0.620.17 | n.a |
| n.a | n.a | n.a | n.a | n.a | ||||
| 36 | Mrk 331 | 5541 | 56500637 | 0.1820.006 | 0.0960.008 | 0.00760.0018 | 1.890.22 | 12.634.03 |
| 0.1480.008 | 0.110.006 | 1.340.14 | n.a | |||||
| 37 | NGC 4151 | 995 | 35300163 | 0.8220.006 | 0.4450.024 | 0.042 | 1.850.11 | n.a |
| 0.0740.006 | 0.370.029 | n.a | 0.200.03 | n.a | ||||
| 38 | NGC 6286 | 5501 | 20700509 | 0.1870.008 | 0.0870.004 | 0.00940.0013 | 2.150.19 | 9.251.70 |
| 0.1680.005 | 0.0730.009 | 0.0050.001 | 2.300.35 | 14.64.7 | ||||
| 39 | NGC 6574 | 2282 | 70500604 | 0.4360.021 | 0.2230.034 | 0.0780.017 | 1.950.39 | 2.861.05 |
| 0.440.020 | 0.230.041 | n.a | 1.910.42 | n.a | ||||
| 40 | NGC 6822 | -57 | 34300915 | 0.1760.011 | 0.1280.005 | 0.0080.002 | 1.370.15 | 16.53.9 |
| 0.1870.011 | 0.1430.006 | 0.05 | 1.300.13 | n.a | ||||
| 41 | NGC 7552 | 1608 | 36903087 | 0.5830.028 | 0.200.04 | 0.0370.007 | 2.920.72 | 5.412.10 |
| 0.640.015 | 0.630.023 | n.a | 1.010.06 | n.a | ||||
| 42 | NGC 7771 | 4277 | 56500772 | 0.290.01 | 0.1410.009 | 0.01870.0026 | 2.060.20 | 7.541.52 |
| 0.2980.009 | 0.1150.013 | n.a | 2.590.37 | n.a | ||||
| 43 | NGC 4041 | 1234 | 22202506 | 0.320.01 | 0.380.05 | 0.14 | 0.840.13 | n.a |
| 0.3480.005 | 0.1970.016 | n.a | 1.760.16 | n.a | ||||
| 44 | NGC 0278 | 627 | 59702260 | 0.720.002 | 0.03 | 0.0200.002 | n.a | n.a |
| 0.7280.012 | 0.3470.016 | 0.021 | 2.090.13 | n.a | ||||
| 45 | NGC 0695 | 9735 | 63300744 | 0.1370.007 | 0.190.01 | 0.0100.002 | 0.720.07 | 194.8 |
| 0.200.008 | 0.1180.009 | n.a | 1.690.19 | n.a | ||||
| 46 | NGC 0986 | 1974 | 74300187 | 0.2780.009 | 0.190.04 | 0.0130.001 | 1.460.35 | 14.624.20 |
| 0.3040.011 | 0.1270.013 | 0.025 | 2.390.33 | n.a |
Table 1 lists the emission line fluxes measured by us from the ISO spectra. For 33 of the galaxies, fluxes previously published in the literature were available and these are also listed in Table 1. When uncertainties were not listed for these literature fluxes, we have estimated them as 20 for fluxes 10-14 W m-2 and 10 for fluxes 10-14 W m-2. Although the choice of how to estimate the associated errors, when it is not provided, is arbitrary, we used typical uncertainties resulting from calibration and pointing errors in the submillimeter and IR domain (Martín et al., 2006; Bayet et al., 2004; Israel et al., 1995). The percentage uncertainty estimated in this way appears, on average, to be similar to the percentage line flux uncertainties measured by us using the interactive package SMART.

In order to show that our measurements are in good agreement with the fluxes collected from the literature we have plotted our measurements versus literature values in Fig 1. We have plotted the ratio of the literature value of [C ii]158 /[O i]63 over our own measured [C ii]158 /[O i]63 value, with respective error bars (open triangles), as well as the ratio of the literature value of [O i]63/[O i]145 over our own value of [O i]63/[O i]145, with respective error bars (filled triangles). The horizontal line in Fig 1 represents the case in which the literature ratios and our own measured ratios are in perfect agreement.
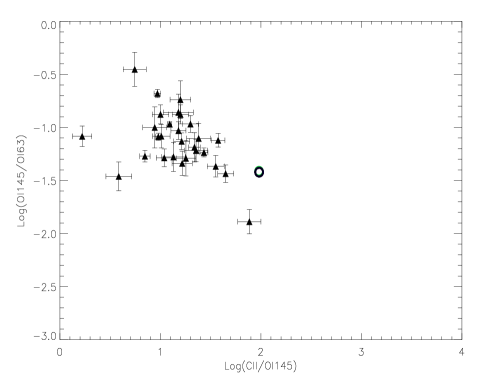
Flux ratios of two lines of the same species, such as [O i]145/[O i]63 can provide information about nebular conditions such as temperature (or radiation field strength). In addition, a ratio such as [O iii]88/[O iii]52 can provide information on the electron density. In addition by using ratios, rather than fitting the line intensities directly, the beam filling factors of the two emission lines cancel out, assuming that they come from the same regions and are the same size.

3 The UCL_PDR models
We used the UCL_PDR time and depth-dependent PDR code (Bell et al., 2006) which solves the chemistry, thermal balance and radiative transfer self-consistently within a cloud. The range of parameter values input to the code are listed in Table 2, including the mean grain radius and grain number density adopted for grain surface reactions. The FUV grain opacity properties adopted by UCL_PDR are listed by Bell et al. (2006). The outputs of the code are the abundances of each species included in the chemical network, their column densities, the emissivities and integrated intensities of the emission lines involved in the cooling, and the gas and dust temperatures. All of these quantities are functions of depth and time. At each depth-step, the model calculates the attenuation of the FUV field before beginning an iterative cycle to determine the gas temperature at which the total heating and cooling rates are equal, that is, when the condition of thermal balance is satisfied. For each iteration, the chemistry is first calculated, based on the gas temperature and attenuated FUV flux, after which the heating and cooling rates are computed, together with the radiative transfer in the emission line, using the revised chemical abundances. The difference between the total heating and cooling rates is then used to derive a new gas temperature. We use a grid of 1702 PDR models, already computed and partially used in previous works (Bell at al. 2006, Bell Hartquist et al. 2006, Bell et al. 2007) spanning a large range of densities, metallicities and cosmic ray ionization rates. Amongst the range of parameter values covered by the grid of models (see Table 2), we do not consider variations of the turbulent velocity parameter in our attempts to fit the observed emission from each galaxy, since the line ratios are believed to be fairly insensitive to small changes in the turbulent velocity (Wolfire et al., 1989).
| Parameter | Range of values | Reference |
| parameter | ||
| values | ||
| Cloud density (cm -3) | 102 nH 105 | nH= 103 |
| Incident FUV flux (Habing) | 10 G0105 | Go=10 |
| Age of the cloud (yr) | 104 t 108 | t=107 |
| Cloud size (mag) | 0 Av10 | Av=10 |
| Metallicity | Z/Z⊙=5,4,3,2,1,0.5 | Z=Z⊙ |
| 0.1,0.25,0.01 | ||
| C.R. ionization rate (s-1) | = 5x,50x,500x10-15 | = 5x10-17 |
| 5x,50x,500x10-16 | ||
| 5x,50x,500x10-17 | ||
| Turbulent velocity (km s-1) | vturb=1.5 | vturb=1.5 |
| Carbon elemental abundance | 1.4x10⁻⁴nH | Sofia & Myer |
| (2001) | ||
| Oxygen elemental abundance | 3.2x10⁻⁴nH | Sofia & Myer |
| (2001) | ||
| Grain radius | 0.1 m | 0.1 m |
| Grain number density ng | 2x10-12Z cm-3 | 2x10⁻⁹ cm-3 |
4 Sensitivity of model results to parameter variations
We attempted to find the range of physical parameters which best reproduced the observations, such as visual extinction, metallicity, cosmic ray ionization rate and UV radiation field strength. The influence of changing the number density of hydrogen nuclei (nH), the visual extinction (Av), the incident radiation field strength (Go), the cosmic ray ionization rate and the metallicity (Z) is considered individually by varying only one of these parameters at a time. The age of the modeled regions was set to a value of 107 yrs, owing to the fact that clouds with ages 107 yrs do not undergo significant changes in their predicted chemical profiles, even though, in some cases, the chemistry only reaches its final steady state somewhat later (Bell et al., 2006).
When one parameter was varied the remainder were held constant at the reference parameter values listed in the final column of Table 2.
In Figs 3 through 8 we overplot our model predictions against flux ratios from the [C ii] 158m and [O i] 63m and 145m ISO LWS fluxes. Table 3 lists these 3 important PDR cooling transitions, their wavelengths, upper energy levels , and critical densities . In this section we will only discuss the sensitivity of the ratios to changes in the input parameters. The comparison with observations will be made in Section 6.
| Wavelength | Eupper/k | ncr | ||
|---|---|---|---|---|
| Species | Transitions | (m) | (K) | (cm-3) |
| [C ii] | 157.74 | 92 | 3x10³ | |
| [O i] | 63.18 | 228 | 4.7x10⁵ | |
| [O i] | 145.53 | 326 | 1x10⁵ |
4.0.1 Visual Extinction
PDRs derive their properties primarily from the penetration of FUV photons into their interiors. Dust grains provide the major source of continuum opacity and attenuate the incident radiation field by selectively absorbing and scattering light at visible and ultraviolet wavelengths. This means that there is a strong correlation between visual extinction and the chemistry of PDRs. We examined models for different visual extinction values in the range 1Av10.
From Fig 3 one can see that there is no significant change in the emission line ratios from Av=1 (black circle) to Av=10 (green circle). This trend implies that the majority of the line fluxes arise from 1Av2 and is consistent with the C+ abundance because, for values of Av larger than 2, this ion recombines to form C0 and subsequently forms CO. Indeed C+ is a tracer of the edge of PDRs. This implies that the C+ fine structure emission lines that are observed are coming predominantly from regions with low visual extinction. Although neutral oxygen is still present at higher visual extinctions, it is somewhat reduced beyond Av=1 because a fraction of oxygen combines with C to form CO (see Röllig et al., 2007). We fixed Av=10 as the most appropriate depth range to fit our sample of sources, since Fig 3 shows that we cannot distinguish between models with optical depths in the range of 1Av10.
4.0.2 Radiation field
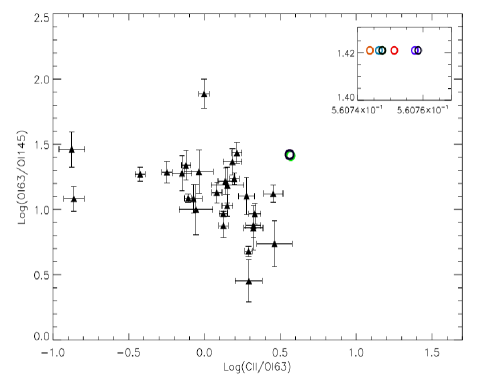
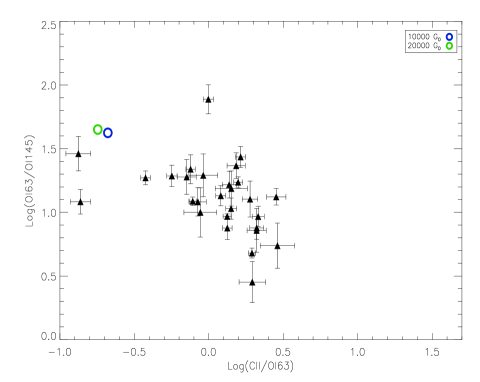
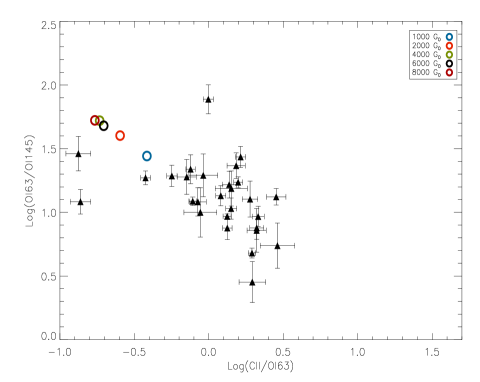
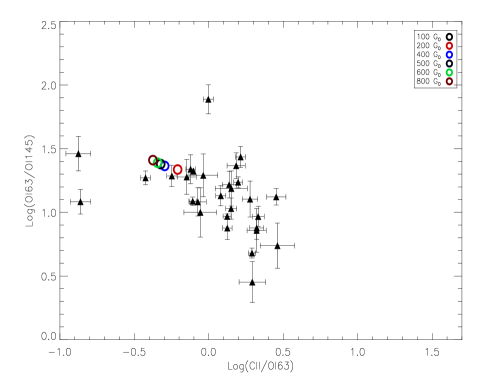
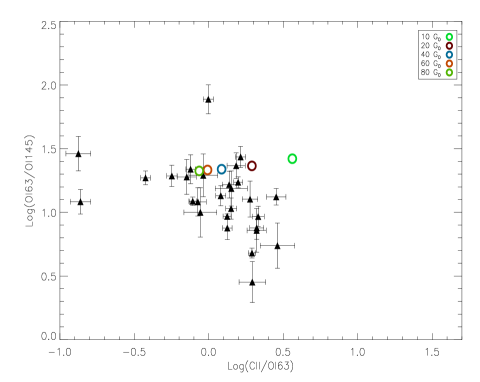
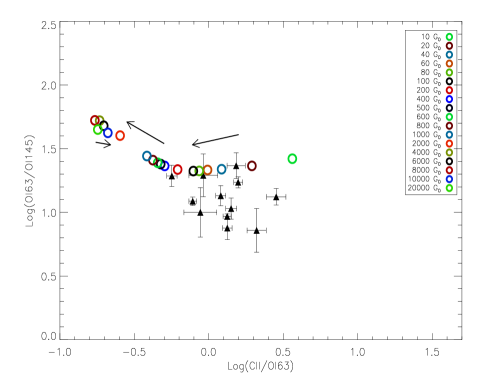
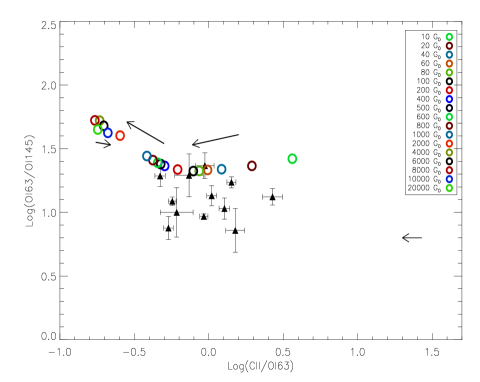
Radiation field strengths incident upon a gas cloud can vary from the standard interstellar field ( = Draine) up to 107 Draines (Draine, 1978) in regions of intense star formation (see Hollenbach & Tielens, 1997). The FUV field may be also expressed in terms of the Habing parameter (Habing, 1968). The FUV flux expressed in this way is determined by the parameter G0=/1.7. We adopt a range of 10G0500000 Habings for consideration in this study, but we only plot the significant results. From Fig 4, [C ii]158 /[O i]63 versus [O i]63/[O i]145 appears to be sensitive to variations in the radiation field strength. As the radiation field strength increases so does the [O i]63/[O i]145 ratio, while the [C ii]158 /[O i]63 ratio decreases. The energy required to excite the [O i]63 transition is somewhat higher than that for [C ii]158, hence the line intensity ratio [O i]63/[C ii]158 is expected to increase with gas temperature and hence higher FUV flux. PDR models predict that for nH103 cm-3 the line ratio will increase with both G0 and nH, due to the different critical densities of the two transitions (Wolfire et al., 1990).
4.0.3 Metallicity
Metallicities significantly below solar are observed in Local Group galaxies, including the Small Magellanic Cloud, as well as in more distant dwarf galaxies, with I Zw 18’s metallicity of 1/40 being amongst the lowest known (Izotov & Thuan, 1999). The metallicity-dependence appears in several key processes in the UCL_PDR code. Elemental abundances of all metals are assumed to scale linearly with metallicity (Z/Z⊙); the dust-to-gas mass ratio is also assumed to scale linearly with metallicity and takes a standard a value of 10-2 at Solar metallicity. The formation rate of H2 on grain surfaces and the grain photoelectric heating rate are assumed to scale linearly with metallicity.
We investigated a metallicity range of 0.01 Z/Z⊙5 for this study, with the adopted solar neighbourhood carbon and oxygen elemental abundances listed in Table 2. Metallicity affects the total abundances of carbon and oxygen bearing species, and hence can influence the chemical and thermal structure of PDRs in galaxies.
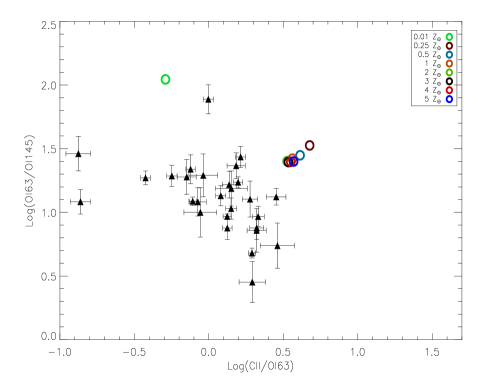
In Fig 5 we show our model results for metallicities of 0.01 (light green circle), 0.25 (claret circle) and 0.5 (turquoise circle), with remaining symbols representing values of 1, 2, 3, 4 and 5 times solar metallicity respectively.
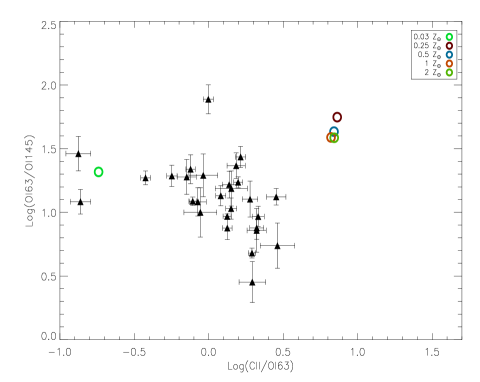
The C/O ratios for the Sun, the Large Magellanic Cloud (LMC) and the Small Magellanic Cloud (SMC) are all 0.5 within the uncertainties, but for lower metallicities than the SMC C/H decreases faster than O/H. We tried to reproduce this trend by changing carbon and oxygen elemental abundances with metallicity. In Fig 6 we show our model results for a metallicity of Z/Z⊙=1, with C/O=0.53 (Asplund et al., 2005), then we scaled all the elemental abundances with Z/Z⊙ down to Z/Z⊙=0.25. Below Z/Z⊙=0.25 the C/O ratio was scaled from 0.53 to 0.16 as Z/Z⊙ was reduced from 0.25 to 0.03 (Izotov & Thuan, 1999). As expected, the [O i]63/[O i]145 ratio is not sensitive to variations of metallicity whereas the [C ii]158 /[O i]63 ratio would appear at first sight to be a good tracer of metallicity.
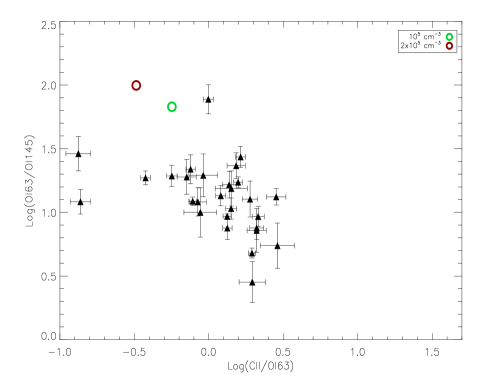
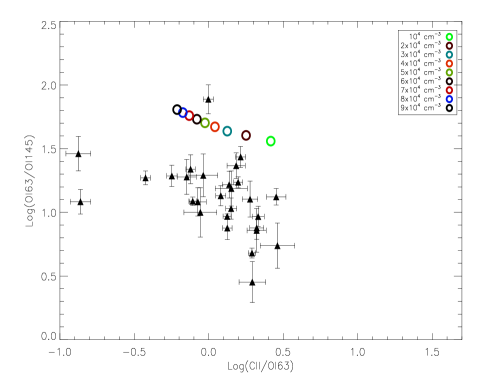
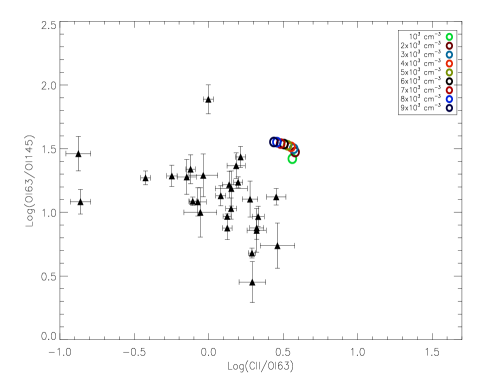
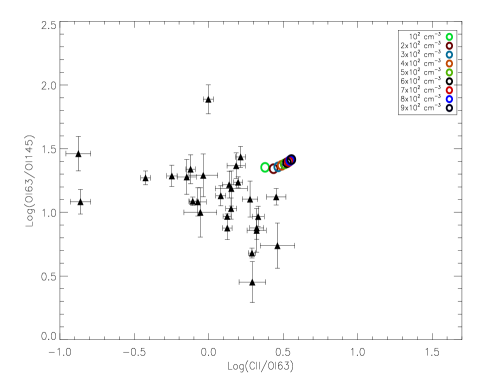
4.0.4 Density
We have considered the sensitivity of the fine structure emission line intensities to H-nuclei densities in the range 102 nH105 cm-3. In Fig 7 we show our model results for different values of density. The [C ii]158 /[O i]63 and [O i]63/[O i]145 ratios are both sensitive to density, however there is a higher sensitivity for the [C ii]158 /[O i]63 ratio. As expected, there is a substantial decline in the [O i]63/[O i]145 ratio as the density decreases from nH105 cm-3 to nH9x103 cm-3, and a steady decline in the [O i]63/[O i]145 ratio as the density decreases from nH9x103 while the model [C ii]158 /[O i]63 ratios increase initially with decreasing density until the density reaches a value of nH103 cm-3 and then decrease as the density decreases further. Clearly, the changes in the [O i]63/[O i]145 ratio at 105 cm-3 are partly due to the critical density of the two lines (see Table 3). Similarly, the decrease in the [C ii]158 /[O i]63 ratio as the density decreases is partially due to the density falling below the critical density of the [C ii]158 line.
4.0.5 Cosmic ray ionization rate
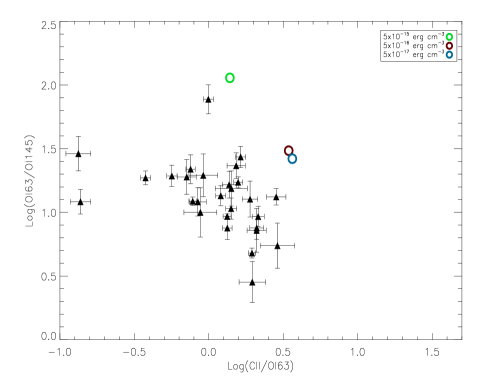
The cosmic ray flux is known to vary by over an order of magnitude in the Milky Way (Schilke et al., 1993). Magnetic field lines can channel cosmic rays away from dense molecular cores; alternatively, the flux of particles in star forming regions can be many times higher than the canonical rate (Schilke et al., 1993). The UCL_PDR code does not have a separate treatment for X-ray Dominated Region (XDR) effects that may be important in some galaxies (see Meijerink et al., 2006). However to a first approximation one may use an enhanced cosmic ray ionization rate to mimic the effects of XDRs (Bell Hartquist et al. 2006). In Fig 8 we show our model results for cosmic ray ionization rates in the range 5x10-155x10-17s-1. The higher end of our range can represent a higher ionization rate (see e.g. McCall et al., 2003) or the effect of additional ionization due to X-rays. There is a substantial decline in the [O i]63/[O i]145 ratio as the cosmic ray ionization rate decreases from =5x10-15s-1 (green circle) to =5x10-16s-1 (claret circle) and it then decreases slightly for =5x10-17s-1 (blue circle); the [C ii]158 /[O i]63 ratio decreases significantly from =5x10-15s-1 (green circle) to =5x10-16s-1 (claret circle) and then remains constant. In fact both the [C ii] and [O i]63 fluxes decrease with a decrease in ionization rate, with [O i]63 decreasing at a faster rate.
5 Using [N ii] fluxes to estimate the ionized gas contribution to [C ii] fluxes
Several studies have been made that show that significant [C ii] emission can arise from H ii regions (Heiles, 1994; Abel et al., 2005; Kaufman et al., 2006; Abel, 2006). Since the ionization potential from C+ to C2+ is 24 eV, the [C ii] 158 m 2P3/2 to 2P1/2 line can be formed over a substantial part of a H ii region and according to Aannestad & Emery (2003) may contribute up to 1/3 of the total intensity in the line.
More recent work has indicated that approximately 25 of the observed [C ii] 158 m emission may come from ionized regions (Abel, 2006). This is particularly true where low-density H ii regions are adjacent to PDRs (Heiles, 1994; Abel et al., 2005; Kaufman et al., 2006; Abel et al., 2007). This effect can hamper the use of [C ii] emission as a pure PDR diagnostic in cases where ionized and PDR emission are observed in a single spectrum. Therefore, the contribution of [C ii] emission from the ionized gas must be estimated. Such an estimate requires a separate model of the H ii region, although in recent years computional methods exist that allow the H ii region and PDR spectrum to be calculated self-consistentely (Abel et al., 2005; Kaufman et al., 2006). A study of S125 by Aannestad & Emery (2003) found that 40 of the [C ii] and 20 of the [O i] 63-m line intensities come from the ionized regions. Therefore, even though [C ii] emission is widely observed and is usually optically thin, its dependence on the properties of the H ii region can diminish its use as a PDR diagnostic. The possibility that some of the [C ii] flux may come from H ii regions is not explicitly taken into account by the UCL_PDR models.
While ionized carbon, because of its ionization potential, can be found in both neutral gas and ionized gas clouds, species such as ionized nitrogen, N+, requiring an ionization potential of 14.53 eV, can arise only from H ii regions. Along with the [C ii] 158m emission line, the [N ii] 122-m and 205-m lines are the brightest emission lines contributing to the total far-infrared emission from our Galaxy (Wright et al. 1991). The ground state 3P term of the N+ ion is split into the three 3P2,1,0 levels from which the 122 m and 205 m lines arise. Therefore if a predicted H ii region value for the [C ii]158/[N ii]122 flux ratio is available, the observed [N ii] 122-m flux could be used to indicate the amount of [C ii] 158-m emission arising from H ii regions that are in the telescope beam.
The COBE FIRAS Galactic Plane spectral measurements yielded an integrated value of [N ii]122/[N ii]205=1.5 (Wright et al., 1991). The same [N ii]122/[N ii]205 flux ratio was measured by Oberst et al. (2006) for the Great Carina nebula, which has Ne30 cm-3. They used photoionization models for the Carina nebula to estimate [C ii]158/[N ii]122 = 1.6 for the H ii region. Table 4 lists the [N ii] 122-m emission line fluxes measured by us from the ISO LWS spectra of 12 out of the 46 sources listed in Table 1 that showed a detection, together with the relative [C ii]158/[N ii]122 ratios and the estimated percentage of [C ii]158 coming from the H ii region. The 12 sources that have detections of both [C ii] 158 m and [N ii] 122 m have mean and median [C ii]158/[N ii]122 flux ratios of 10.2 and 5.9 respectively. A H ii region [C ii]158/[N ii]122 ratio of 1.6 implies that H ii regions contribute only 16 (mean case) and 27 (median case) of the overall [C ii] 158m flux that is observed.
We used the above predicted H ii region [C ii]158/[N ii]122 ratio of 1.6 along with the observed [N ii] 122-m fluxes, to correct the observed [C ii] 158m flux of these 12 sources for H ii region contributions. In Fig 9 we overplot our model results, with the same physical parameters used in Fig 4, on the observations. In the right-hand panel the observations have been corrected for the predicted H ii region contribution to the 158-m fluxes using the measured [N ii] 122-m fluxes. As shown in Fig 9, the model results appears to fit the corrected observations better, compared to Fig 4, because the observations have been shifted to lower values of [C ii]158/[O i]63. The remaining discrepancy is attributed to [O i] 63-m self-absorption, as discussed in Section 6, below.
| Index | Source | TDT No. of | [N ii] 122m | [C ii]158 | [C ii]158 |
|---|---|---|---|---|---|
| Observation | [N ii]122 | from H ii | |||
| 3 | NGC 253 | 56901708 | 1.720.18 | 2.70.4 | 60% |
| 5 | Maffei 2 | 85800682 | 0.1880.014 | 5.70.7 | 28% |
| 6 | NGC 1068 | 60500401 | 0.3560.026 | 5.30.6 | 30% |
| 10 | NGC 1614 | 85501010 | 0.0210.004 | 9.72.5 | 17% |
| 11 | NGC 2146 | 67900165 | 0.1520.006 | 16.36.4 | 10% |
| 13 | M 82 | 65800611 | 2.200.17 | 5.90.6 | 27% |
| 18 | NGC 4039/9 | 25301107 | 0.04680.0049 | 8.081.09 | 20% |
| 26 | Cen A | 63400464 | 0.1700.019 | 16.22.4 | 10% |
| 27 | NW Cen A | 45400151 | 0.0970.011 | 28.85.7 | 5.5% |
| 28 | M 51 | 35100651 | 0.2280.027 | 4.20.7 | 38% |
| 29 | M 83 | 64200513 | 0.2310.066 | 5.21.7 | 31% |
| 30 | Circinus | 10401133 | 0.2130.019 | 12.21.5 | 13% |
6 Fitting the observations
The clear discrepancy between the location of the observations and our models in Figures 3-8 can at least be partly attributed to self absorption in the [O i] 63-m line. This is consistent with what Liseau et al. (2006) found: namely that 65 of observed [O i]63/[O i]145 emission line ratios from Milky Way PDRs are lower than can be explained by current models, which they attributed to optical depth effects in the [O i] 63-m line. They partially attributed the low observed ratios to absorption by cold foreground O0 in front of the 63-m-emitting region, although other explanations such as very optically thick [O i] line emission could not be ruled out.
The overall conclusion of Liseau et al. (2006) was that because this ratio depends sensitively on models, [O i] emission has a limited diagnostic value. In fact most PDR models calculate the emergent flux from a plane-parallel slab of gas illuminated from one side. A galaxy has many PDRs at all orientations, and optical depth effects are non-negligible. In the approximation that the densest PDRs correspond to the shells of molecular clouds and that the [C ii] line emission and far-IR dust continuum emission are optically thin, while the [O i] 63-m line is optically thick, then the [O i] 63-m line will be seen only from the front side of each cloud while the [C ii] line arises from both the front and the near sides. The velocity dispersion from cloud to cloud, however, allows most [O i] 63-m photons that have escaped their parent cloud to escape the galaxy entirely. This scenario implies that we should observe only a fraction of the [O i] flux and all of the [C ii] flux expected from PDR models (Malhotra et al., 2001).
The observed [C ii]158/[O i]63 and [O i]63/[O i]145 ratios, in the selected range, do not appear to be traced properly by our UCL_PDR model results although there is a common trend in the behaviour of these ratios, indicating that the observations are off-set compared to our model results. At first glance the model in the lower right panel of Fig 4, where we varied the radiation field strength, appears to show the best fit to the observations. However, taking into account the effects of [O i] self-absorption and the [C ii] contribution from H ii regions, the models in the lower left panel of Fig 4 could also probably provide a fit to the observations. In fact both these effects would shift the models downwards and to the right relative to the observations. A similar trend could be found when we varied the density. Although at first glance the models in the top right panel of Fig 7 do not appear to show a good fit to the observations, if one takes into account the effects of [O i]63 self-absorption, which will shift observations downwards and to the left relative to the models, due to the decrease in the [O i] 63-m flux, these models will probably provide a better fit to the observations. The models will be shifted downwards and to the right relative to the observations. Unfortunately the results obtained varying the cosmic ray ionization rate and the metallicity suggest that the [C ii]158/[O i]63 versus [O i]63/[O i]145 ratio is not a good tracer for these parameters. We identified the best parameter values of our source sample as 104nH9x104 cm-3 and 60G08x102, Av= 10. These values were chosen while taking into account the effects of absorption in the [O i] 63-m line (See Section 6.1) and the contribution to [C ii] 158-m from H ii regions (Section 5).
6.1 [O i] 63-m self-absorption
The intensity of the [O i] 63m line can be suppressed through self-absorption (e.g. González-Alfonso et al., 2004). The 3P1 state, the upper level of the [O i] 63-m line, is 228 K above the ground state and its critical density is ncrit = 4.7x105 cm-3 (Tielens & Hollenbach, 1985). Because of this, at typical interstellar cloud temperatures all oxygen atoms occupy the lowest level of their ground state, with J=2. This means that [O i] 63-m emission, originating from collisional excitation in a warm medium, could be absorbed by the abundant reservoir of ground state neutral oxygen that exists within the galaxy along the line of sight. The 63-m line can also be absorbed by cold foreground material but this is less likely in the case of a face-on galaxy, where the neutral oxygen column density will be less along the line of sight than for an edge-on galaxy. For our sample of sources the majority are not edge-on galaxies, therefore we attribute most of the suppression of the [O i] 63-m line to self-absorption in the PDRs in which the emission is excited.
6.1.1 The [O i] 63-m line profile
In an attempt to investigate the effect of [O i] 63-m self-absorption on the observations we have developed a new version of the Spherical Multi-Mol code (SMMOL, Rawlings & Yates (2001)). Originally SMMOL only considered a sphere of material illuminated by the standard ISRF at the outer boundary of the sphere: we have now implemented the ability to insert a central illuminating source with an arbitrary SED. SMMOL uses an accelerated -iteration (ALI) method to solve multilevel non-LTE radiative transfer problems of gas inflow and outflow. The code computes the total radiation field and the level populations self-consistently. At each radial point, SMMOL generates the level populations, the line source functions and the emergent spectrum from the cloud surface. This can then be convolved with the appropriate telescope beam. A detailed description of the SMMOL radiative transfer model can be found in the appendix of Rawlings & Yates (2001). The coupling between the UCL_PDR code and the radiation transfer code has been performed through an interface 111See website: https://www.astro .uni-koeln.de /projects /schilke/ sites/www.astro.uni -koeln.de.projects.schilke/ files/ Viti_Cologne09.pdf that will be presented in a forthcoming paper (Bayet et al. 2010, in prep). We used the physical parameters from one of the UCL_PDR models222Model result listed in Fig 4 (bottom left panel): =5x10-17 s-1, 103 cm-3, Z/Z⊙=1, 200G0 and t=107 yrs. and we chose an arbitrary distance of 3.2 Mpc for the clouds modeled. In Fig 10 we show the SMMOL [O i] emission line profiles for a PDR with a diameter of 20 pc (left panel) and a PDR with a diameter of 5 pc (right panel). In Fig 10 the effect of self-absorption is clearly seen in the [O i]63μm line profile (solid line) while there is no trace of self-absorption in the [O i]145μm line profile (dotted line). The [O i]63μm emission line is still significantly brighter than the [O i]145μm emission line, consistent with current observations. The line profile from a single 20 pc GMC exhibits extremely strong [O i] 63-m self-absorption. Without self-absorption in the [O i] 63-m line, the 63/145 flux ratio would be 46.2. With self-absorption, the flux ratio is found to be 8.5, a reduction of 0.73 dex. The effect is smaller for the 5 pc model; the 63/145 flux ratio is reduced from 12.6 to 7.9, i.e. by 0.20 dex. The log(63/145) 0.9 flux ratios predicted by both SMMOL models are in reasonable agreement with the observed ratios in e.g. Fig 9. Although our 20 pc and 5 pc diameter SMMOL models produce similar final 63- and 145-m fluxes, their relative masses (1.0 and 1.6 M⊙, respectively) would seem to make an ensemble of the smaller clouds more plausible for matching the observed ratios.
Note that although all profiles in Fig 10 have been modeled with the same physical parameters, the difference between the two [O i]63μm emission line profiles is due to the difference between the inner and outer temperatures of the two clouds. The 20 pc GMC is approximately 100 K cooler than the 5 pc GMC at the centre. This is because the 20 pc GMC extends to Av=19 mag, while the 5 pc GMC has a visual extinction of 5 mags. These differences account for the much stronger [O i]63μm self-absorption in the left panel. The [O i]145μm line, on the other hand, is approximately the same for both GMCs.


In order to qualitatively understand the behaviour of [O i]63μm self-absorption in PDRs, we investigated its sensitivity to variations in the density and radiation field strength. We find that an order of magnitude increase in the radiation field strength causes the inner and outer temperatures to be twice as high as those in the models plotted in Fig. 10. This produces a higher flux and an increase in self-absorption in the [O i]63μm line. Increasing the density by one order of magnitude causes an increase in the optical depth of the cloud, so that the degree of [O i]63μm self-absorption is larger than in the right-hand panel of Fig 10, while the overall flux is reduced by an order of magnitude. We underline here that we are not attempting to model the actual line profiles that may be exhibited by these galaxies: in order to do so one would need to consider density gradients, multiple sources and the geometry of the galaxy. Our theoretical line profiles simply demonstrate the effect of the initial conditions on the degree of self-absorption in the [O i]63μm line.
The [O i] 63/145 flux ratios predicted by our SMMOL models shift them downwards by 0.2-0.7 dex relative to the UCL_PDR predictions, bringing them into quite good agreement with the observed ratios plotted in Figs. 9 and 10. However, allowance for the 0.2-0.7 dex reduction in the [O i] 63-m line strength caused by self-absorption would also move the UCL_PDR [C ii]/[O i]63μm model ratios in those figures to larger values. We ran SMMOL for the case of C+ and we found, as expected, that the [C ii]158μm emission line profile did not show self-absorption in any of the models. In summary, we find that 20-80 of the intensity of the [O i]63μm line can be suppressed through absorption, with the percentage depending strongly on the physical parameters of the PDR region. Comparing with the model trends shown in Fig. 9, it would seem that a combination of high radiation field strengths and allowance for [O i] 63-m self-absorption could provide the best match to the observed line ratios. [O i] line profile observations from the Herschel Space Observatory should allow a greater degree of discrimination amongst possible models.
7 Conclusions
To fit the observed [C ii] 158 m, [O i] 63 m and [O i] 145 m emission line fluxes for 28 extragalactic sources, measured from archival ISO-LWS spectra, we used a grid of 1702 PDR models from the UCL_PDR code spanning a large range of densities, radiation field strengths, metallicities and cosmic ray ionization rates. We took into account the contribution to the observed [C ii] fluxes from H ii regions, using expected [C ii]158/[N ii]122 ratios for H ii regions to correct the [C ii]158 fluxes of the 12 sources that had [N ii] 122 m detections.
We found that the best fitting PDR models had 104nH9x104 cm-3 and 60G08x102. Consistent with the conclusions of Liseau et al. (2006), we found that the persistent discrepancy between the observed and modelled line flux ratios can at least partly be attributed to self-absorption in the [O i] 63-m line. We used the SMMOL code to predict oxygen emission line profiles for several PDR models and found clearly self-absorbed [O i] 63-m profiles, with 20-80 of the intensity suppressed, depending on the physical parameters of the PDR regions. A combination of high radiation field strengths and [O i] self-absorption would appear to provide the best explanation for the observed [C ii] 158 m, [O i] 63 m and [O i] 145 m line flux ratios.
Acknowledgements
We thank the referee, Dr N. Abel, for constructive comments that helped improve the paper. MV would like to thank Dr. Estelle Bayet for her help throughout this research. Samuel Farrens is thanked for comments.
References
- Aannestad & Emery (2003) Aannestad P. A., Emery R. J., 2003, A&A, 406, 155
- Abel (2006) Abel N. P., 2006, MNRAS, 368, 1949
- Abel et al. (2005) Abel N. P., Ferland G. J., Shaw G., van Hoof P. A. M., 2005, ApJ, 161, 65
- Abel et al. (2007) Abel N. P., Sarma A. P., Troland T. H., Ferland G. J., 2007, ApJ, 662, 1024
- Asplund et al. (2005) Asplund M., Grevesse N., Sauval A. J., Allende Prieto C., Blomme R., 2005, A&A, 431, 693
- Bayet et al. (2004) Bayet E., Gerin M., Phillips T. G., Contursi A., 2004, A&A, 427, 45
- Bell et al. (2006) Bell T. A., Hartquist T. W., Viti S., Williams D. A., 2006, A&A, 459, 805
- Bell et al. (2006) Bell T. A., Roueff E., Viti S., Williams D. A., 2006, MNRAS, 371, 1865
- Bell et al. (2005) Bell T. A., Viti S., Williams D. A., Crawford I. A., Price R. J., 2005, MNRAS, 357, 961
- Bergvall et al. (2000) Bergvall N., Masegosa J., Östlin G., Cernicharo J., 2000, A&A, 359, 41
- Brauher et al. (2008) Brauher J. R., Dale D. A., Helou G., 2008, ApJS, 178, 280
- Clegg et al. (1996) Clegg P. E., Ade P. A. R., Armand C., Baluteau J.-P., Barlow M. J., Buckley M. A., Berges J.-C., 1996, A&A, 315, L38
- Colbert et al. (1999) Colbert J. W., Malkan M. A., Clegg P. E., Cox P., Fischer J., Lord S. D., Luhman M., Satyapal S., Smith H. A., Spinoglio L., Stacey G., Unger S. J., 1999, ApJ, 511, 721
- Contursi et al. (2002) Contursi A., Kaufman M. J., Helou G., Hollenbach D. J., Brauher J., Stacey G. J., Dale D. A., Malhotra S., Rubio M., Rubin R. H., Lord S. D., 2002, ApJ, 124, 751
- Crawford et al. (1985) Crawford M. K., Genzel R., Townes C. H., Watson D. M., 1985, ApJ, 291, 755
- Draine (1978) Draine B. T., 1978, ApJ, 36, 595
- Fischer et al. (1996) Fischer J., Shier L. M., Luhman M. L., Satyapal S., Smith H. A., Stacey G. J., Unger S. J., 1996, A&A, 315, L97
- González-Alfonso et al. (2004) González-Alfonso E., Smith H. A., Fischer J., Cernicharo J., 2004, ApJ, 613, 247
- Habing (1968) Habing H. J., 1968, Bull. Astron. Inst. Netherlands. , 19, 421
- Heiles (1994) Heiles C., 1994, ApJ, 436, 720
- Higdon et al. (2004) Higdon S. J. U., Devost D., Higdon J. L., Brandl B. R., Houck J. R., Hall P., 2004, The Astronomical Society of the Pacific, 116, 975
- Hollenbach & Tielens (1997) Hollenbach D. J., Tielens A. G. G. M., 1997, ARA&A, 35, 179
- Israel et al. (1995) Israel F. P., White G. J., Baas F., 1995, A&A, 302, 343
- Izotov & Thuan (1999) Izotov Y. I., Thuan T. X., 1999, ApJ, 511, 639
- Kaufman et al. (2006) Kaufman M. J., Wolfire M. G., Hollenbach D. J., 2006, ApJ, 644, 283
- Liseau et al. (2006) Liseau R., Justtanont K., Tielens A. G. G. M., 2006, A&A, 446, 561
- Luhman et al. (2003) Luhman M. L., Satyapal S., Fischer J., Wolfire M. G., Sturm E., Dudley C. C., Lutz D., Genzel R., 2003, ApJ, 594, 758
- Malhotra et al. (2001) Malhotra S., Kaufman M. J., Hollenbach D., Helou G., Rubin R. H., Brauher J., Dale D., Lu N. Y., Lord S., Stacey G., Contursi A., Hunter D. A., Dinerstein H., 2001, ApJ, 561, 766
- Mao et al. (2000) Mao R. Q., Henkel C., Schulz A., Zielinsky M., Mauersberger R., Störzer H., Wilson T. L., Gensheimer P., 2000, A&A, 358, 433
- Martín et al. (2006) Martín S., Martín-Pintado J., Mauersberger R., 2006, A&A, 450, L13
- McCall et al. (2003) McCall B. J., Huneycutt A. J., Saykally R. J., Geballe T. R., Djuric N., Dunn G. H., 2003, The Nature, 422, 500
- Meijerink et al. (2006) Meijerink R., Spaans M., Israel F. P., 2006, ApJ, 650, L103
- Negishi et al. (2001) Negishi T., Onaka T., Chan K.-W., Roellig T. L., 2001, A&A, 375, 566
- Oberst et al. (2006) Oberst T. E., Parshley S. C., Stacey G. J., Nikola T., Löhr A., Harnett J. I., Tothill N. F. H., Lane A. P., Stark A. A., 2006, ApJ, 652, L125
- Rawlings & Yates (2001) Rawlings J. M. C., Yates J. A., 2001, MNRAS, 326, 1423
- Röllig et al. (2007) Röllig M., Abel N. P., Bell T., Bensch F., Black J., Ferland G. J., Jonkheid B., Kamp I., Kaufman M. J., Le Bourlot J., Le Petit F., 2007, A&A, 467, 187
- Rubin et al. (1991) Rubin R. H., Simpson J. P., Haas M. R., Erickson E. F., 1991, ApJ, 374, 564
- Schilke et al. (1993) Schilke P., Carlstrom J. E., Keene J., Phillips T. G., 1993, ApJ, 417, L67
- Seaquist & Frayer (2000) Seaquist E. R., Frayer D. T., 2000, ApJ, 540, 765
- Sternberg & Dalgarno (1995) Sternberg A., Dalgarno A., 1995, ApJS, 99, 565
- Tielens & Hollenbach (1985) Tielens A. G. G. M., Hollenbach D., 1985, ApJ, 291, 747
- Unger et al. (2000) Unger S. J., Clegg P. E., Stacey G. J., Cox P., Fischer J., Greenhouse M., Lord S. D., Luhman M. L., Satyapal S., Smith H. A., Spinoglio L., Wolfire M., 2000, A&A, 355, 885
- Wild et al. (1992) Wild W., Harris A. I., Eckart A., Genzel R., Graf U. U., Jackson J. M., Russell A. P. G., Stutzki J., 1992, A&A, 265, 447
- Wolfire et al. (1989) Wolfire M. G., Hollenbach D., Tielens A. G. G. M., 1989, ApJ, 344, 770
- Wolfire et al. (1990) Wolfire M. G., Tielens A. G. G. M., Hollenbach D., 1990, ApJ, 358, 116
- Wright et al. (1991) Wright E. L., Mather J. C., Bennett C. L., Cheng E. S., Shafer R. A., Fixsen D. J., Eplee Jr. R. E., Isaacman R. B., Read S. M., 1991, ApJ, 381, 200