The discovery of a very cool binary system
Abstract
We report the discovery of a very cool d/sdL7+T7.5p common proper motion binary system, SDSS J1416+13AB, found by cross-matching the UKIDSS Large Area Survey Data Release 5 against the Sloan Digital Sky Survey Data Release 7. The d/sdL7 is blue in J-H and H-K and has other features suggestive of low-metallicity and/or high gravity. The T7.5p displays spectral peculiarity seen before in earlier type dwarfs discovered in UKIDSS LAS DR4, and referred to as CH4-J-early peculiarity, where the CH4-J index, based on the absorption to the red side of the -band peak, suggests an earlier spectral type than the H2O-J index, based on the blue side of the -band peak, by subtypes. We suggest that CH4-J-early peculiarity arises from low-metallicity and/or high-gravity, and speculate as to its use for classifying T dwarfs. UKIDSS and follow-up UKIRT/WFCAM photometry shows the T dwarf to have the bluest near-infrared colours yet seen for such an object with . Warm Spitzer IRAC photometry shows the T dwarf to have extremely red , which is the reddest yet seen for a substellar object. The lack of parallax measurement for the pair limits our ability to estimate parameters for the system. However, applying a conservative distance estimate of 5–15 pc suggests a projected separation in range 45–135 AU. By comparing colours of the T dwarf to spectral models we estimate that K and [M/H], with . This suggests a mass of 30 MJupiter for the T dwarf and an age of 10 Gyr for the system. The primary would then be a 75 MJupiter object with and a relatively dust-free K atmosphere. Given the unusual properties of the system we caution that these estimates are uncertain. We eagerly await parallax measurements and high-resolution imaging which will constrain the parameters further.
keywords:
surveys - stars: low-mass, brown dwarfs1 Introduction
The current generation of wide-field surveys (e.g. UKIRT Infrared Deep Sky Survey, UKIDSS; Canada-France Brown Dwarf Survey, CFBDS; Lawrence et al. 2007; Delorme et al. 2008b) is significantly expanding the sample of late type T dwarfs (e.g. Delorme et al. 2008a; Lodieu et al. 2007; Pinfield et al. 2008; Burningham et al. 2010). Recent discoveries of extremely cool T dwarfs probe new low-temperature extremes, with as low as 500K (Burningham et al. 2008; Delorme et al. 2008a; Burningham et al. 2009; Leggett et al. 2009). In addition to probing new regimes, we can expect the expanded sample to populate other hitherto unexplored regions of T dwarf parameter space. Of particular interest is the growing diversity seen in metallicity and gravity for late-T dwarfs (e.g. Leggett et al. 2010), and the potential for extending the low-metallicity subdwarf sequence to very low temperatures.
To date, the sample of ultracool subdwarfs (UCSDs) consists of just one proposed T subdwarf, 2MASS J09373487+2931409 (Burgasser et al. 2002, 2006), along with a small number of L subdwarfs (e.g. 2MASS J1626+3925 - sdL4; SDSS J1256–0224 - sdL4; 2MASS J0616–6407 - sdL5; ULAS J1350+0815 - sdL5; 2MASS J0532+8246 - sdL7; Burgasser et al. 2004; Sivarani et al. 2009; Cushing et al. 2009; Lodieu et al. 2009; Burgasser et al. 2003, respectively). Recent parallax determinations and model comparisons by Schilbach et al. (2009) suggest that of these, only the earliest type objects (2MASS J1626+39 and SDSS J1256-02) have metallicities consistent with subdwarf classification on the scheme that Gizis (1997) defined for M subdwarfs. Based on this Schilbach et al. (2009) suggest that an intermediate d/sd classification should be applied to the two coolest objects (2MASS J0532+82 and 2MASS J0937+29). It is important to remember, however, that the subdwarf classification scheme is empirically based, and metallicities are associated with specific subdwarf classes only by model comparisons. That the model comparisons for the latest type UCSDs suggest higher metallicities than seen for earlier type objects should not be a sole basis for reclassification. The higher metallicity inferred from the colours of the coldest objects may actually highlight problems with the models to which they are compared.
The spectral classification of subdwarfs should be based on observed spectral features that distinguish these objects from “normal” ultracool dwarfs (UCDs). As such, in this paper we adopt the position that the sdL objects described above are subdwarfs, since their spectra are clearly distinct from those of the bulk population of L dwarfs in a manner broadly consistent with subdwarf status. The more limited sample of T dwarfs, however, precludes such classification at this time, and we adopt the “peculiar” description for possible subdwarfs of this type (e.g. Burgasser et al. 2006; Burningham et al. 2010). However, in both cases the limited sample of “subdwarf” objects means that the current classification system may require significant revision as the true diversity of the spectra of low-metallicity UCDs becomes apparent in the era of larger, deeper surveys such as VISTA and WISE.
We report here the discovery of a nearby d/sdL7+T7.5p common proper motion binary. The rest of the paper is laid out as follows. In Section 2 we describe the identification, photometric follow-up, spectral classification and proper motion determination for the two objects. In Section 3 we demonstrate their association as a common proper motion binary pair, and we provide initial estimates for some of their properties in Section 4. Our results and conclusions are summarised in Section 5.
2 Two new ultracool dwarfs
Our searches of the UKIDSS Large Area Survey (LAS; see Lawrence et al. 2007) have been successful at identifying late-type T dwarfs (e.g. Lodieu et al. 2007; Warren et al. 2007; Pinfield et al. 2008; Burningham et al. 2008, 2009, 2010). Using the same search methodology as previously described in detail in Pinfield et al. (2008) and Burningham et al. (2010), we identified ULAS J141623.94+134836.30 (hereafter ULAS J1416+13) as a candidate late-T dwarf in Data Release 5 of the LAS with unusually blue . The subsequent photometric and spectroscopic follow-up, which resulted in its classification as a T7.5p dwarf, are described in the following sub-sections.
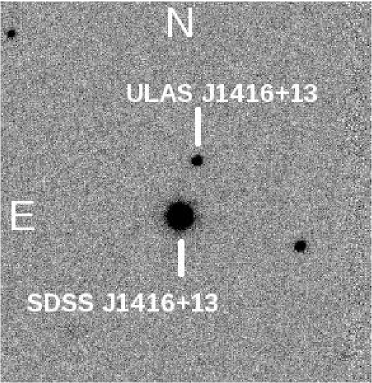
Inspection of the surrounding field in SDSS, required to establish the red nature of ULAS J1416+13, revealed the presence of a nearby, very red object at a separation of 9″. Interrogation of SDSS DR7 revealed this object, SDSS J141624.08+134826.7 (hereafter SDSS J1416+13), to have an SDSS spectrum with L dwarf spectral morphology (see also Table 1 for SDSS photometry of this object).
Since our initial identification of this L dwarf, its discovery has been published by Schmidt et al. (2009) and Bowler et al. (2009), who have classified it as a blue L5 and L6pec dwarf respectively. In the following sub-sections, we also describe our follow-up photometry of this target, and describe our analysis of this source that was carried out independently prior to the Schmidt et al. (2009) and Bowler et al. (2009) publications. Figure 1 shows a UKIDSS band finding chart for both the L and T dwarf.
2.1 Near-infrared photometry
Near-infrared follow-up photometry was obtained using the Wide Field CAMera (WFCAM; Casali et al. 2007) on UKIRT on the night of 17th June 2009, and the data were processed using the WFCAM science pipeline by the Cambridge Astronomical Surveys Unit (CASU) (Irwin et al. 2004), and archived at the WFCAM Science Archive (WSA; Hambly et al. 2008). Observations consisted of a three point jitter pattern in the and bands, and five point jitter patterns in the and bands repeated twice, all with 2x2 microstepping and individual exposures of 10 seconds resulting in total integration times of 120 seconds in and and 400 seconds in and . The resulting photometry for both our targets is given in Table 2. The WFCAM filters are on the Mauna Kea Observatories (MKO) photometric system (Tokunaga et al. 2002)
| Object | ||||||||
|---|---|---|---|---|---|---|---|---|
| SDSS J1416+13 |
| Object | |||||||
|---|---|---|---|---|---|---|---|
| ULAS J1416+13 | |||||||
| SDSS J1416+13 | |||||||
2.2 Warm-Spitzer IRAC photometry
The Spitzer General Observer program 60093 allowed us to obtain IRAC photometry of apparently very late-type T dwarfs discovered in the UKIDSS data. This Cycle 6 warm mission program provides only photometry at the shortest two wavelengths, [3.6] and [4.5]. Note that [3.6] and [4.5] are nominal filter wavelengths and, as the photometry is not colour-corrected for the dwarfs’ spectral shapes, the results cannot be translated to a flux at the nominal wavelength (e.g. Cushing et al. 2008; Reach et al. 2005).
Data were obtained for SDSS J1416+13 and ULAS J1416+13 on 23rd August 2009. The telescope was pointed mid-way between the L and T dwarf; with a separation of 9 ″ both dwarfs were near the centre of the 5.2 arcminute field of view. Individual frame times were 30 seconds, repeated three times, with a 16 position spiral dither pattern, for a total integration time of 24 minutes in each band. The post-basic-calibrated-data (pbcd) mosaics generated by the Spitzer pipeline were used to obtain aperture photometry. The photometry was derived using a 0.6-arcsecond pixel aperture radius, with separate (i.e. not annular) skies chosen to avoid the flaring due to the bright primary. The aperture correction was taken from the IRAC handbook111http://ssc.spitzer.caltech.edu/irac/dh/. The error is estimated by the variation with sky aperture, which is larger than that implied by the uncertainty images (noise pixel maps) provided by the Spitzer pipeline, and is much less than 1% for the A component in both bands, and 4% and 0.7% for the B component at [3.6] and [4.5] respectively. The description of the primary issues with early release warm IRAC data222http://ssc.spitzer.caltech.edu/irac/documents/iracwarmdatamemo.txt indicates that the only significant concern is the uncertainty in the linearity correction for SDSS J1416+13; the total uncertainty due to this correction is estimated to be 5–7% at [3.6] and 4% at [4.5] for bright sources. Otherwise the photometry for both sources is uncertain by the usual 3% due to uncertainties in the absolute calibration and pipeline processing. Table 3 gives the photometry and the total uncertainties for both dwarfs.
2.3 Near-infrared spectroscopy
We used and grisms in the InfraRed Camera and Spectrograph (IRCS; Kobayashi et al. 2000) on the Subaru telescope on Mauna Kea to obtain a R and spectra for ULAS J1416+13 on 7th May 2009 and 31st December 2009 respectively. The observations were made up of a set of eight 300s sub-exposures for the spectrum and eighteen 200s sub-exposures in an ABBA jitter pattern to facilitate effective background subtraction, with a slit width of 1 arcsec. The length of the A-B jitter was 10 arcsecs. The spectrum was extracted using standard IRAF packages. The AB pairs were subtracted using generic IRAF tools, and median stacked. The data were found to be sufficiently uniform in the spatial axis for flat-fielding to be neglected.
We used a comparison argon arc frame to obtain the dispersion solution, which was then applied to the pixel coordinates in the dispersion direction on the images. The resulting wavelength-calibrated subtracted pairs had a low-level of residual sky emission removed by fitting and subtracting this emission with a set of polynomial functions fit to each pixel row perpendicular to the dispersion direction, and considering pixel data on either side of the target spectrum only. The spectra were then extracted using a linear aperture, and cosmic rays and bad pixels removed using a sigma-clipping algorithm.
Telluric correction was achieved by dividing each extracted target spectrum by that of the F4V star HIP 72303, which was observed just after the target and at a similar airmass. Prior to division, hydrogen lines were removed from the standard star spectrum by interpolating the stellar continuum. Relative flux calibration was then achieved by multiplying through by a blackbody spectrum of the appropriate . The spectra were then normalised using the measured near-infrared photometry to place the spectra on an absolute flux scale, and rebinned by a factor of three to increase the signal-to-noise, whilst avoiding under-sampling of the spectral resolution.
2.4 Spectral types
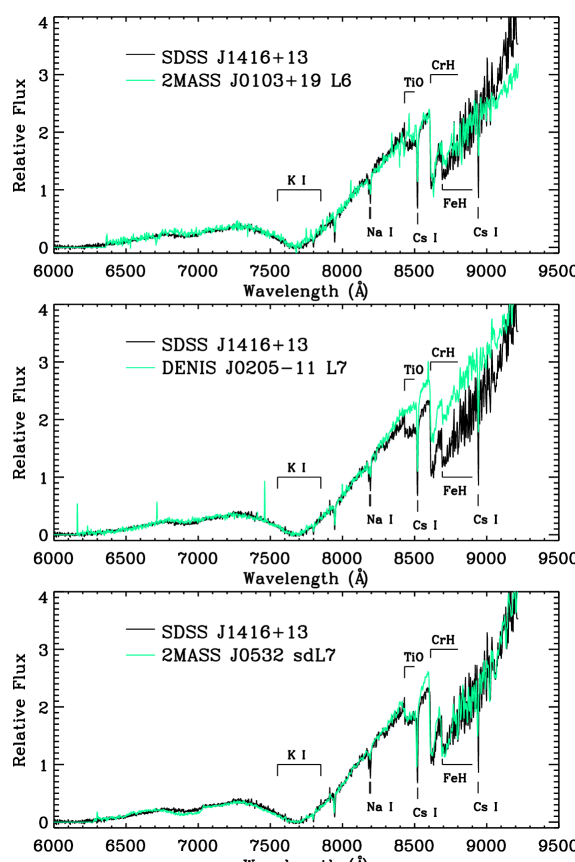
As noted in the Section 1, the discovery SDSS J1416+13 has recently been published by Schmidt et al. (2009) and Bowler et al. (2009). Schmidt et al. (2009) find an optical spectral type of L5 and an infrared type of L5–6 (using the Geballe et al. 2002, indices). Bowler et al. (2009) similarly find an optical type of L60.5 and an infrared type of L7–7.5. The template fits carried out in both papers show some discrepancies beyond 9000Å however, and here we use the SDSS spectrum of the source to produce an alternative classification as follows.
The top two panels of Figure 2 show the SDSS DR7 spectrum of SDSS J1416+13 along with the optical spectra of the L6 and L7 spectral templates 2MASS J0103+19 and DENIS J0205–11. Whilst the SDSS J1416+13 is good match over much of the range to the L6 template, they disagree significantly beyond 9000Å. On the other hand, the slope of the pseudo-continuum is very similar to that of an L7 across the entire 6000–9200Å range, although the prominent TiO, FeH and CrH features are considerably stronger in the spectrum of SDSS J1416+13. This behaviour is more typical of low-metallicity objects, where it has been speculated that that the low-metallicity atmosphere inhibits the formation of the condensate dust clouds, allowing the opacity due to alkali and hydride species to become more apparent (e.g. Burgasser et al. 2003; Reiners & Basri 2006). Hence, we do not classify this object following the system for L dwarfs defined by Kirkpatrick et al. (1999), and instead rely on comparison to other metal-poor L dwarfs.
The lower panel of Figure 2 shows the close similarity between the spectrum of SDSS J1416+13 and that of the metal-poor L dwarf 2MASS J0532+8246. Burgasser et al. (2003) demonstrated that this object not only displays features characteristic of a low-metallicity atmosphere, but also has kinematics consistent with halo membership, and classify it as sdL7. Whilst the general agreement between the spectrum of SDSS J1416+13 and the sdL7 spectrum is good across the entire range considered, there are specific areas of disagreement that should be noted. In particular the CsI and NaI absorption features are somewhat deeper than in the sdL7 template, and more suggestive of dwarf classification than that of a subdwarf. This suggests that SDSS J1416+13 may be less metal poor than 2MASS J0532+82. Given the apparent intermediate nature of SDSS J1416+13 between the L7 and sdL7 spectra, we classify it as d/sdL7 (optical). We note that Bowler et al. (2009) suggest that SDSS J1416+13 is unlikely to have significantly reduced metallicity based on the optical TiO and CaH features. Burgasser et al. (2008b) and Stephens et al. (2009) discuss various mechanisms which may lead to unusually blue L dwarfs including low metallicity, high gravity and thin condensate cloud decks. We explore the physical properties of the L dwarf further in Section 4.
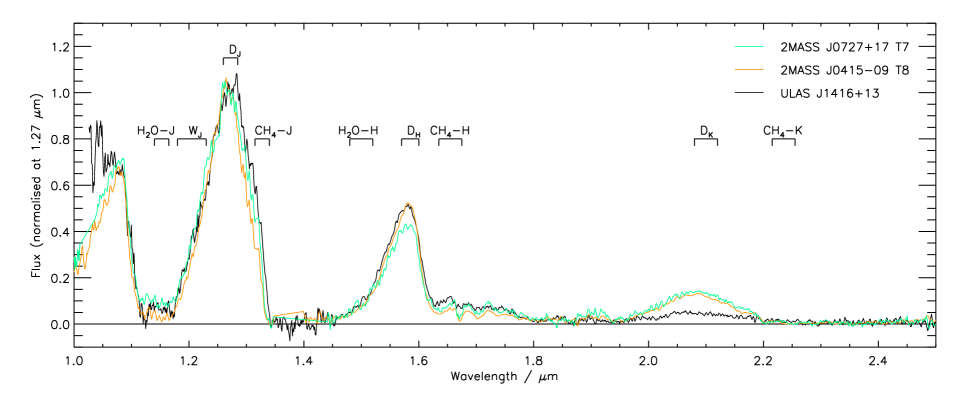
The IRCS spectrum of the T dwarf, ULAS J1416+13, is shown in Figure 3, along with spectra of the T7 and T8 spectral standards (Burgasser et al. 2006). With the exception of the poor match to both templates on the red side of the J-band peak and the heavily suppressed band peak, the spectrum appears intermediate between the two. This is reflected in the spectral typing ratios (see Table 4), and we classify this object as T7.5p. The early type suggested by the CH4-K index clearly reflects the small amount of flux in the band peak. The type of peculiarity seen here in the red side of the band peak, and reflected in the spectral typing ratios, has been described for at least three other T dwarfs in Burningham et al. (2010), and has been suggested as a possible tracer of low-metallicity and/or high-gravity. The significance of this feature is discussed in more detail in Section 4.
| Name | [3.6] | [4.5] |
|---|---|---|
| SDSS J1416+13 | ||
| ULAS J1416+13 |
| Index | Ratio | Value | Type |
|---|---|---|---|
| H2O-J | T7/8 | ||
| CH4-J | T6 | ||
| T7/8 | |||
| H2O- | T7/8 | ||
| CH4- | T7 | ||
| NH3- | … | ||
| CH4-K | T4 |
2.5 Proper motions
The photometric follow-up observations that were carried out provided a second epoch of imaging data, showing the position of the two sources of interest 1.1 years after the LAS image was measured. We used the IRAF task GEOMAP to derive spatial transformations from the WFCAM follow-up -band image into the original UKIDSS LAS -band image based on the positions of 18 reference stars. The transform allowed for linear shifts and rotation, although the rotation that was required was negligible. We then transformed the WFCAM follow-up pixel coordinates of the targets into the LAS images using GEOXYTRAN, and calculated their change in position (relative to the reference stars) between the two epochs.
The uncertainties associated with our proper motion measurement primarily come from the spatial transformations, and the accuracy with which we have been able to measure the position of the targets (by centroiding) in the image data. Centroiding uncertainties for the targets should be small, since the seeing and signal-to-noise of the sources was good in both epochs, so this latter source of uncertainty will be neglected. For the LAS image the seeing was 0.9″ in the -band, whilst for the WFCAM image it was ″. The root-mean-square (rms) scatter in the difference between the transformed positions of the reference stars and their actual measured positions was 0.24 pixels in declination and 0.18 pixels in right ascension, corresponding to 0.048 and 0.036″ in the -band LAS image. We thus estimate proper motion uncertainties of 45 mas/yr and 33 mas/yr in declination and right ascension respectively. The final, relative, proper motion measurements are mas/yr, mas/yr for SDSS J1416+13 and mas/yr, mas/yr for ULAS J1416+13.
It should be noted that the relative proper motions calculated here disagree with the absolute values found for the primary by Schmidt et al. (2009) and Bowler et al. (2009) at the 4 level. This discrepancy likely arises as a result of two factors. Firstly, in the first epoch images both targets lie within 30″ of the detector edge. As a result, the distribution of reference stars is not even about the targets. Since there is likely to considerable geometric distortion across the field of view, this poor distribution of reference stars will likely result in an unreliable absolute fit to the coordinates. Secondly, they do not take into account the parallax of the targets. The first and second epoch data were taken on 12th May 2008 and 17th June 2009 respectively, which would suggest the influence of parallax should be small. However, given that the distance for both objects may be as low as 5 pc (see Section 4), we do not rule this out as a significant effect. These concerns should not effect the reliability of these proper motions as relative values, but we caution that they include systematic effects that prevent their use in any absolute manner.
3 A wide low-mass binary
The close agreement of the proper-motions for these two objects, and their 9 ″ proximity on the sky suggests that they represent a common proper motion binary pair. To estimate the probability that the proper motions are aligned by chance, rather than because of a bona-fide association, we have considered the proper motions of objects in the SuperCosmos Sky Survey (Hambly et al. 2001) in the direction of our targets. Since we do not have a parallax for either object, we instead estimate a liberal range of distances based on their spectral types and apparent magnitudes for the purposes of placing broad limits on their shared volume. In Section 4 we refine this distance estimate based on subsequent analysis of these objects. If we apply the vs. spectral type relations of Liu et al. (2006) we find that an L7 and a T7.5 dwarf with the apparent magnitudes of our objects can be expected to lie at distances ranging from 5 pc to 25 pc. Of the SuperCosmos objects with apparent distances (based on colour-magnitude relation for field stars) similar to those of our targets, none shared a common motion to within . We thus conclude that the likelihood of a common proper motion occurring by chance in this direction is less than .
Since the statistics for the properties of the ultracool subdwarf population are not currently known, we will use the space density of “normal” L dwarfs to estimate a conservative probability that this pair are unrelated, and are found in close proximity by chance. Using our liberal distance range of 5–25 pc, and given the separation of 9″, we can thus estimate that two objects likely share a volume of 0.01 pc3. The space density for field L dwarfs was determined by Cruz et al. (2007) to be 0.0038 pc-3. The probability of finding an L dwarf within the same 0.01 pc3 as our T7.5 dwarf is thus . It is reasonable to surmise that the probability of finding two ultracool subdwarfs within this volume would be considerably smaller.
These combined arguments suggest the probability of a chance alignment in space and motion for these two objects is less than . If we apply these arguments to the total UKIDSS LAS T dwarf sample up to DR4 (Burningham et al. 2010) we find that we would need a sample of approximately 1000 times larger before we would expect to identify one chance alignment such as this. It is worth stressing that our estimate for this probability is somewhat conservative. Given the apparently unusual nature of the objects discussed here, it is likely that true probability for chance alignment is considerably lower. We thus conclude that SDSS J1416+13 and ULAS J1416+13 represent a binary pair, which we shall henceforth refer to as SDSS J1416+13AB.
4 The properties of SDSS J1416+13AB
The optical spectral classification of SDSS J1416+13A as a dwarf/subdwarf implies that we could reasonably classify the secondary as a dwarf/subdwarf also, given that most binary systems are expected to be coevally formed in the same cloud core. Figure 4 shows near-infrared colours as a function of spectral type for L and T dwarfs, with SDSS J1416+13AB indicated with red asterisks. Blue near-infrared colours for mid-to late T dwarfs have typically been interpreted as indicative of low-metallicity and/or high-gravity (e.g. Burgasser et al. 2002; Knapp et al. 2004; Liu et al. 2007), caused by band suppression by pressure sensitive collisionally induced absorption by hydrogen (CIA H2; Saumon et al. 1994). Blue colours in metal poor L dwarfs have also been interpreted in terms of band suppression by CIA H2 (e.g. Burgasser et al. 2003). The blue colour of SDSS J1416+13A, and the blue colour of SDSS J1416+13B, therefore, support the interpretation that both objects have low-metallicity and/or high-gravity, and we interpret the peculiar spectral shape of SDSS J1416+13B in this context.
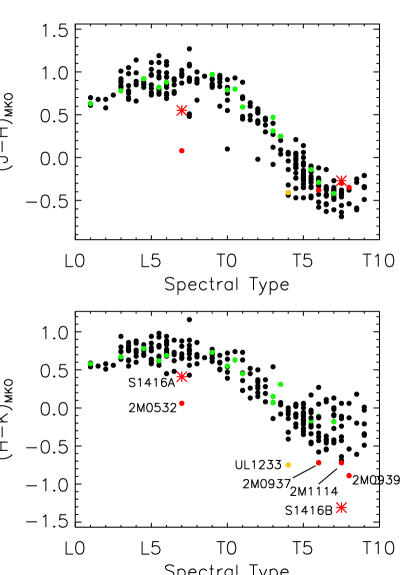
The spectral morphology in the band peak of SDSS J1416+13B is reminiscent of a number of T dwarfs recently discovered that have been classified as peculiar (Burningham et al. 2010). These also show a band peak that appears earlier in type on the red side (as indicated by the CH4-J index) compared to the blue side (as indicated by the H20-J and indices). This morphology was referred to by Burningham et al. (2010) as CH4-J-early peculiarity, and we continue this convention here. Only one of the objects already found with CH4-J-early peculiarity, ULAS J1233+1219, currently has band photometry. It also appears very blue, with (indicated by an orange filled circle in Figure 4), and is as notable an outlier in for its type as SDSS J1416+13AB. It thus seems plausible that CH4-J-early peculiarity is indicative of low-metallicity and/or high gravity.
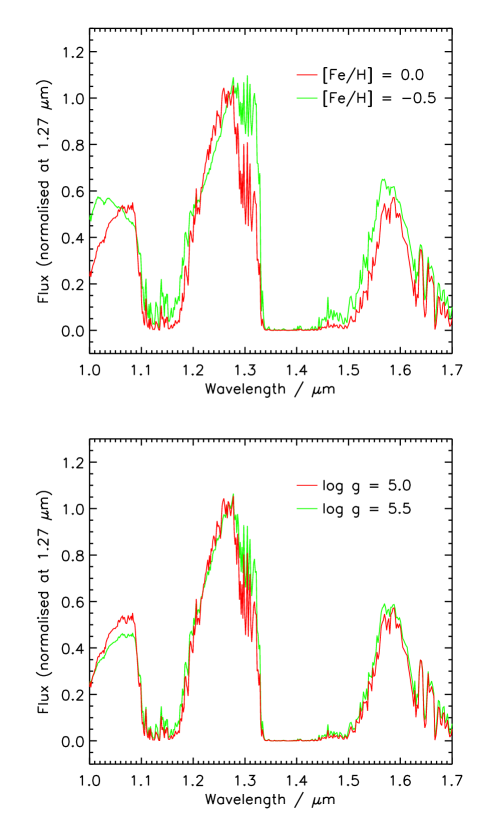
There is some theoretical basis for preferring a low-metallicity interpretation of CH4-J-early peculiarity. Figure 5 shows comparisons of Burrows et al. (2006) model spectra for , K T dwarfs with solar and [Fe/H]=-0.5 metallicity, and also for solar metallicity with and . Enhancement of the red side of the band peak is apparent in both the low-metallicity and high-gravity cases, but is most pronounced in the former. We speculate that CH4-J-early peculiarity may represent a useful tracer of low-metallicity atmospheres, although its presence in a system with fiducial metallicity and age constraints will need to be observed before a robust interpretation will be possible.
It is interesting to note that the spectral shape of SDSS J1416+13B also deviates from that of the spectral templates blueward of 1.1m, in a manner similar to that seen in Figure 5 for the low-metallicity case. The same behaviour is not predicted for the high-gravity case. A spectrum with better coverage in the band may provide a useful means of breaking the gravity-metallicity degeneracy.
The need for a more complex spectral classification scheme to take account of spectral variations that result from changes in metallicity and gravity in addition to has been highlighted by Kirkpatrick (2005). As more objects that exhibit CH4-J-early spectral peculiarity are identified, its behaviour may provide a convenient method for more detailed classification of T dwarf spectra.
The lack of a known parallax for this binary pair precludes a detailed assessment of their properties, since spectroscopic distances are not well constrained for ultracool T dwarfs. In the case of the one previously identified sdL7, 2MASS J0532+82, the determined absolute magnitude ( = 13.00) is 1-2 mags brighter than might otherwise be expected for a field dwarf of type L7 (Burgasser et al. 2008a). If we assume that SDSS J1416+13A has as was the case for for 2MASS J0532+82 we arrive at a distance estimate of 10 pc. However, SDSS J1416+13A is considerably less blue in than 2MASS J0532+82 ( vs respectively, see Figure 4) and, as previously discussed, may have rather different properties.
Assuming spectral types L7 and T7.5, however, suggests distances of 5 pc and 20 pc for the objects respectively by applying the vs spectral type relations of Liu et al. (2006). In the case of the metal poor T dwarf 2MASS J0937+29 this method would overestimate the distance by %. Using this as a correction suggests a distance for SDSS J1416+13AB of 14 pc. This would represent a significant discrepancy in the distances of the primary and secondary members of SDSS J1416+13AB, implying that the primary could be an unresolved binary. However, the band suppression in SDSS J1416+13B is greater than in the case of 2MASS J0937+29 and, as discussed below, it appears to be considerably cooler. It thus seems likely that SDSS J1416+13B is fainter still, and a distance as close as 10 pc seems plausible. A distance of pc is also in broad agreement with that estimated by Schmidt et al. (2009) and Bowler et al. (2009) for the primary. We thus conservatively estimate the distance to SDSS J1416+13AB to lie in the 5-15 pc range.
The implied projected separation of the binary pair at this range of distances is 45 – 135 AU. It is thus possible that this pair also represents a rare very low-mass wide binary system (e.g. Figure 9 in Lafrenière et al. 2008).
The longer baseline provided by our Spitzer IRAC photometry offers the opportunity to estimate parameters of the system through comparison to predictions of model spectra. The IRAC colours of SDSS J1416+13A are normal for a late-type L dwarf, although the colours of these objects show significant scatter (see Figure 6). All of the low-metallicity late-T dwarfs plotted in Figure 6 display that is at least 0.5 magnitudes redder than would otherwise be expected for a “normal” T dwarf of their subtype. However, the - [4.5] colour of SDSS J1416+13B is the reddest yet measured. In addition to apparently indicating low-metallicity atmospheres, this colour is a good indicator of (e.g. Warren et al. 2007; Stephens et al. 2009; Leggett et al. 2010) and so SDSS J1416+13B appears to be very cool.
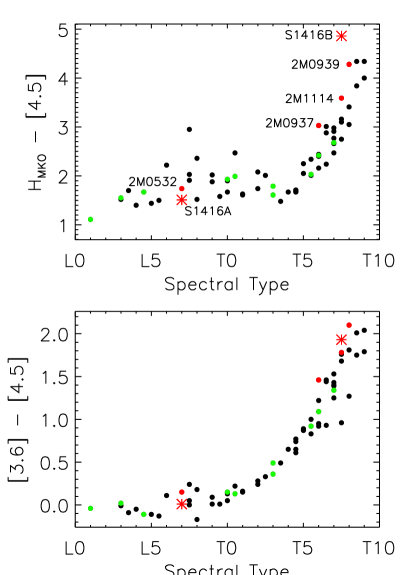
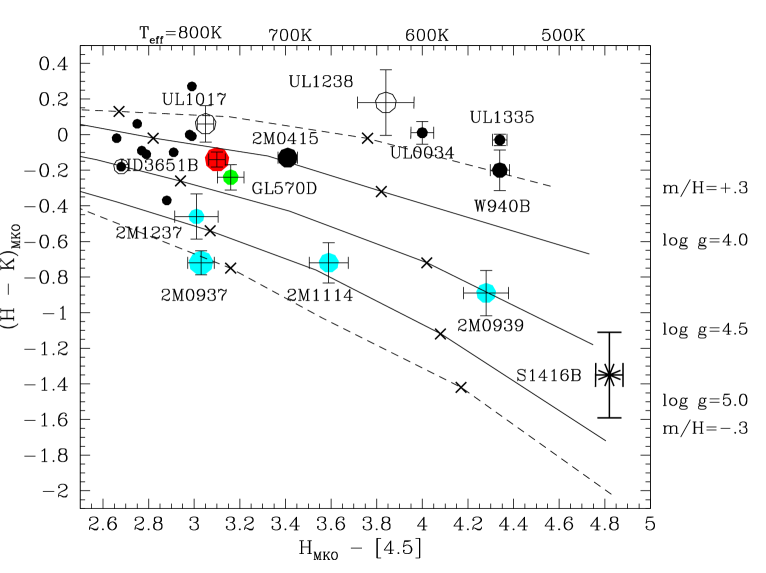
Figure 7 reproduces Figure 11 of Leggett et al. (2010) with the location of SDSS J1416+13B indicated. It can be seen that this T dwarf forms a sequence with the other known metal-poor ([m/H] -0.3) high-gravity () dwarfs: 2MASS J0937347+293142, 2MASS J12373919+6526148, 2MASS J11145133–2618235, 2MASS J09393548–2448279. The dwarfs have and 600 K respectively (Geballe et al. 2009; Liebert & Burgasser 2007; Leggett et al. 2007, 2009; Burgasser et al. 2008c). Extrapolating these values using Figure 7 and the models (Marley et al. 2002; Saumon & Marley 2008) shown in the figure, implies that SDSS J1416+13B has [m/H]–0.3, 5.0 to 5.3 and K. This indicates a mass of 30–40 for SDSS J1416+13B and an age around 10 Gyr or older for the system using the evolutionary models of Saumon & Marley (2008).
The near-infrared indices of Geballe et al. (2002) for SDSS 1416+13A suggest a near-infrared spectral type of L7-7.5 (Bowler et al. 2009). The near-infrared spectral type- relations of Stephens et al. (2009) suggest that blue L7 dwarfs have 1500 K. If the system is aged at Gyr as implied by the secondary then the evolutionary models of Saumon & Marley (2008) suggest that the primary is a 75MJupiter dwarf with . Hence the L dwarf is at the stellar/substellar boundary as also suggested by Bowler et al. (2009).
Stephens et al. (2009) have shown that the atmospheres of blue L dwarfs are less dusty than the bulk population, deriving a high value of using the Marley et al. (2002) models. These authors also find that there is an indication that dust clearing may occur at higher temperatures for higher gravity systems. The blue colours and almost dust-free atmosphere of this relatively warm 1500 K L dwarf is therefore consistent with a high gravity and relatively old age for the system.
Both Schmidt et al. (2009) and Bowler et al. (2009) have estimated for SDSS J1416+13A, finding kms-1 and kms-1 respectively333 positive towards the Galactic centre., and interpret its kinematics as indicative of thin disk membership. This is consistent with the age of 10 Gyr and slight metal-paucity that we find here (Robin et al. 2003; Haywood et al. 1997).
It is intriguing that SDSS J1416+13B appears to be 250 K and 100 K cooler than 2MASS J1114–26 2MASS J0939–24 respectively, which are of similar spectral type (T7.5 and T8). It is plausible that the near-infrared spectral type vs. relation for very late T dwarfs shows significant dependence on metallicity and gravity, with lower-metallicity dwarfs of a given subtype having lower than similar type objects of higher metallicity. The cool nature of 2MASS J0939–24 compared to other T8 dwarfs spectral type would tend to support this assertion, although interpretation of this object is complicated by its probable binarity (Burgasser et al. 2008c). If SDSS J1416+13B had significantly lower metallicity and/or higher gravity than 2MASS J1114–26 2MASS J0939–24, such an effect might account for their similar types but diverse s. However, the same model predictions seen in Figure 7 that suggest such different also suggest fairly similar metallicities and gravities for the three objects.
Finally, it should be noted that we cannot currently rule out the presence of a cooler unresolved companion to SDSS J1416+13B, which might explain its extremely red colour coupled with is T7.5p near-infrared morphology. Unfortunately, the lack of parallax and high-resolution imaging for this target prevent us from adequately exploring this issue here.
5 Summary
We have identified what appears to be the coolest binary system yet found. The association of the T7.5p component with the d/sdL7 primary allows us to now extend the high-gravity and low-metallicity sequence to the lowest observed temperatures, and we suggest that CH4-J-early peculiarity (Burningham et al. 2010) may in future prove to be a useful discriminator for this type of object. The likely close proximity of the system to the Sun should facilitate the determination of the trigonometric parallax in the near-future, which will allow a more robust determination of the properties for this exciting system.
Acknowledgements
SKL is supported by the Gemini Observatory, which is operated by AURA, on behalf of the international Gemini partnership of Argentina, Australia, Brazil, Canada, Chile, the United Kingdom, and the United States of America. EN received support from a Royal Astronomical Society small grant. NL was funded by the Ramón y Cajal fellowship number 08-303-01-02. CGT is supported by ARC grant DP0774000. This research has made use of the SIMBAD database, operated at CDS, Strasbourg, France, and has benefited from the SpeX Prism Spectral Libraries, maintained by Adam Burgasser at http://www.browndwarfs.org/spexprism.
References
- Bowler et al. (2009) Bowler B. P., Liu M. C., Dupuy T. J., 2009, ApJ in press, ArXiv 0912.3796
- Burgasser et al. (2006) Burgasser A. J., Geballe T. R., Leggett S. K., Kirkpatrick J. D., Golimowski D. A., 2006, ApJ, 637, 1067
- Burgasser et al. (2002) Burgasser A. J., Kirkpatrick J. D., Brown M. E., Reid I. N., Burrows A., Liebert J., Matthews K., Gizis J. E., Dahn C. C., Monet D. G., Cutri R. M., Skrutskie M. F., 2002, ApJ, 564, 421
- Burgasser et al. (2003) Burgasser A. J., Kirkpatrick J. D., Burrows A., Liebert J., Reid I. N., Gizis J. E., McGovern M. R., Prato L., McLean I. S., 2003, ApJ, 592, 1186
- Burgasser et al. (2008a) Burgasser A. J., Liu M. C., Ireland M. J., Cruz K. L., Dupuy T. J., 2008a, ApJ, 681, 579
- Burgasser et al. (2008b) Burgasser A. J., Looper D. L., Kirkpatrick J. D., Cruz K. L., Swift B. J., 2008b, ApJ, 674, 451
- Burgasser et al. (2004) Burgasser A. J., McElwain M. W., Kirkpatrick J. D., Cruz K. L., Tinney C. G., Reid I. N., 2004, AJ, 127, 2856
- Burgasser et al. (2008c) Burgasser A. J., Tinney C. G., Cushing M. C., Saumon D., Marley M. S., Bennett C. S., Kirkpatrick J. D., 2008c, ApJ, 689, L53
- Burningham et al. (2008) Burningham B., Pinfield D. J., Leggett S. K., Tamura M., Lucas P. W., Homeier D., Day-Jones A., Jones H. R. A., Clarke J. R. A., Ishii M., Kuzuhara M., Lodieu N., Zapatero Osorio M. R., Venemans B. P., Mortlock D. J., Barrado Y Navascués D., Martin E. L., Magazzù A., 2008, MNRAS, 391, 320
- Burningham et al. (2009) Burningham B., Pinfield D. J., Leggett S. K., Tinney C. G., Liu M. C., Homeier D., West A. A., Day-Jones A., Huelamo N., Dupuy T. J., Zhang Z., Murray D. N., Lodieu N., Barrado Y Navascués D., Folkes S., Galvez-Ortiz M. C., Jones H. R. A., Lucas P. W., Calderon M. M., Tamura M., 2009, MNRAS, 395, 1237
- Burningham et al. (2010) Burningham B., Pinfield D. J., Lucas P. W., Leggett S. K., Deacon N. R., Tinney C. G., Tamura M., Lodieu N., Zhang Z., Huelamo N., Murray D. N., Mortlock D. J., Barrado Y Navascués D., Zapatero Osorio M. R., Ishii M., 2010, MNRAS submitted
- Burrows et al. (2006) Burrows A., Sudarsky D., Hubeny I., 2006, ApJ, 640, 1063
- Casali et al. (2007) Casali M., Adamson A., Alves de Oliveira C., Almaini O., Burch K., Chuter T., Elliot J., Folger M., Foucaud S., Hambly N., Hastie M., Henry D., Hirst P., Irwin M., Ives D., Lawrence A., Laidlaw K., Lee D., Lewis J., Lunney D., McLay S., Montgomery D., Pickup A., Read M., Rees N., Robson I., Sekiguchi K., Vick A., Warren S., Woodward B., 2007, A&A, 467, 777
- Cruz et al. (2007) Cruz K. L., Reid I. N., Kirkpatrick J. D., Burgasser A. J., Liebert J., Solomon A. R., Schmidt S. J., Allen P. R., Hawley S. L., Covey K. R., 2007, AJ, 133, 439
- Cushing et al. (2009) Cushing M. C., Looper D., Burgasser A. J., Kirkpatrick J. D., Faherty J., Cruz K. L., Sweet A., Sanderson R. E., 2009, ApJ, 696, 986
- Cushing et al. (2008) Cushing M. C., Marley M. S., Saumon D., Kelly B. C., Vacca W. D., Rayner J. T., Freedman R. S., Lodders K., Roellig T. L., 2008, ApJ, 678, 1372
- Delfosse et al. (1997) Delfosse X., Tinney C. G., Forveille T., Epchtein N., Bertin E., Borsenberger J., Copet E., de Batz B., Fouque P., Kimeswenger S., Le Bertre T., Lacombe F., Rouan D., Tiphene D., 1997, A&A, 327, L25
- Delorme et al. (2008a) Delorme P., Delfosse X., Albert L., Artigau E., Forveille T., Reylé C., Allard F., Homeier D., Robin A. C., Willott C. J., Liu M. C., Dupuy T. J., 2008a, A&A, 482, 961
- Delorme et al. (2008b) Delorme P., Willott C. J., Forveille T., Delfosse X., Reylé C., Bertin E., Albert L., Artigau E., Robin A. C., Allard F., Doyon R., Hill G. J., 2008b, A&A, 484, 469
- Geballe et al. (2002) Geballe T. R., Knapp G. R., Leggett S. K., Fan X., Golimowski D. A., Anderson S., Brinkmann J., Csabai I., Gunn J. E., Hawley S. L., Hennessy G., Henry T. J., Hill G. J., Hindsley R. B., Ivezić Ž., Lupton R. H., McDaniel A., Munn J. A., Narayanan V. K., Peng E., Pier J. R., Rockosi C. M., Schneider D. P., Smith J. A., Strauss M. A., Tsvetanov Z. I., Uomoto A., York D. G., Zheng W., 2002, ApJ, 564, 466
- Geballe et al. (2009) Geballe T. R., Saumon D., Golimowski D. A., Leggett S. K., Marley M. S., Noll K. S., 2009, ApJ, 695, 844
- Gizis (1997) Gizis J. E., 1997, AJ, 113, 806
- Hambly et al. (2008) Hambly N. C., Collins R. S., Cross N. J. G., Mann R. G., Read M. A., Sutorius E. T. W., Bond I., Bryant J., Emerson J. P., Lawrence A., Rimoldini L., Stewart J. M., Williams P. M., Adamson A., Hirst P., Dye S., Warren S. J., 2008, MNRAS, 384, 637
- Hambly et al. (2001) Hambly N. C., MacGillivray H. T., Read M. A., Tritton S. B., Thomson E. B., Kelly B. D., Morgan D. H., Smith R. E., Driver S. P., Williamson J., Parker Q. A., Hawkins M. R. S., Williams P. M., Lawrence A., 2001, MNRAS, 326, 1279
- Haywood et al. (1997) Haywood M., Robin A. C., Creze M., 1997, A&A, 320, 428
- Irwin et al. (2004) Irwin M. J., Lewis J., Hodgkin S., Bunclark P., Evans D., McMahon R., Emerson J. P., Stewart M., Beard S., 2004, in Society of Photo-Optical Instrumentation Engineers (SPIE) Conference Series, Vol. 5493, Society of Photo-Optical Instrumentation Engineers (SPIE) Conference Series, P. J. Quinn & A. Bridger, ed., pp. 411–422
- Kirkpatrick (2005) Kirkpatrick J. D., 2005, ARA&A, 43, 195
- Kirkpatrick et al. (1999) Kirkpatrick J. D., Reid I. N., Liebert J., Cutri R. M., Nelson B., Beichman C. A., Dahn C. C., Monet D. G., Gizis J. E., Skrutskie M. F., 1999, ApJ, 519, 802
- Kirkpatrick et al. (2000) Kirkpatrick J. D., Reid I. N., Liebert J., Gizis J. E., Burgasser A. J., Monet D. G., Dahn C. C., Nelson B., Williams R. J., 2000, AJ, 120, 447
- Knapp et al. (2004) Knapp G. R., Leggett S. K., Fan X., Marley M. S., Geballe T. R., Golimowski D. A., Finkbeiner D., Gunn J. E., Hennawi J., Ivezić Z., Lupton R. H., Schlegel D. J., Strauss M. A., Tsvetanov Z. I., Chiu K., Hoversten E. A., Glazebrook K., Zheng W., Hendrickson M., Williams C. C., Uomoto A., Vrba F. J., Henden A. A., Luginbuhl C. B., Guetter H. H., Munn J. A., Canzian B., Schneider D. P., Brinkmann J., 2004, AJ, 127, 3553
- Kobayashi et al. (2000) Kobayashi N., Tokunaga A. T., Terada H., Goto M., Weber M., Potter R., Onaka P. M., Ching G. K., Young T. T., Fletcher K., Neil D., Robertson L., Cook D., Imanishi M., Warren D. W., 2000, in Presented at the Society of Photo-Optical Instrumentation Engineers (SPIE) Conference, Vol. 4008, Proc. SPIE Vol. 4008, p. 1056-1066, Optical and IR Telescope Instrumentation and Detectors, Masanori Iye; Alan F. Moorwood; Eds., Iye M., Moorwood A. F., eds., pp. 1056–1066
- Lafrenière et al. (2008) Lafrenière D., Jayawardhana R., Brandeker A., Ahmic M., van Kerkwijk M. H., 2008, ApJ, 683, 844
- Lawrence et al. (2007) Lawrence A., Warren S. J., Almaini O., Edge A. C., Hambly N. C., Jameson R. F., Lucas P., Casali M., Adamson A., and thirteen co-authors, 2007, MNRAS, 379, 1599
- Leggett et al. (2010) Leggett S. K., Burningham B., Saumon D., Marley M. S., Warren S. J., Smart R. L., Jones H. R. A., Lucas P. W., Pinfield D. J., Tamura M., 2010, ArXiv e-prints
- Leggett et al. (2009) Leggett S. K., Cushing M. C., Saumon D., Marley M. S., Roellig T. L., Warren S. J., Burningham B., Jones H. R. A., Kirkpatrick J. D., Lodieu N., Lucas P. W., Mainzer A. K., Martín E. L., McCaughrean M. J., Pinfield D. J., Sloan G. C., Smart R. L., Tamura M., Van Cleve J., 2009, ApJ, 695, 1517
- Leggett et al. (2007) Leggett S. K., Marley M. S., Freedman R., Saumon D., Liu M. C., Geballe T. R., Golimowski D. A., Stephens D. C., 2007, ApJ, 667, 537
- Liebert & Burgasser (2007) Liebert J., Burgasser A. J., 2007, ApJ, 655, 522
- Liu et al. (2007) Liu M. C., Leggett S. K., Chiu K., 2007, ApJ, 660, 1507
- Liu et al. (2006) Liu M. C., Leggett S. K., Golimowski D. A., Chiu K., Fan X., Geballe T. R., Schneider D. P., Brinkmann J., 2006, ApJ, 647, 1393
- Lodieu et al. (2007) Lodieu N., Pinfield D. J., Leggett S. K., Jameson R. F., Mortlock D. J., Warren S. J., Burningham B., Lucas P. W., Chiu K., Liu M. C., Venemans B. P., McMahon R. G., Allard F., Baraffe I., Y Navascués D. B., Carraro G., Casewell S. L., Chabrier G., Chappelle R. J., Clarke F., Day-Jones A. C., Deacon N. R., Dobbie P. D., Folkes S. L., Hambly N. C., Hewett P. C., Hodgkin S. T., Jones H. R. A., Kendall T. R., Magazzù A., Martín E. L., McCaughrean M. J., Nakajima T., Pavlenko Y., Tamura M., Tinney C. G., Zapatero Osorio M. R., 2007, MNRAS, 379, 1423
- Lodieu et al. (2009) Lodieu N., Zapatero Osorio M. R., Martin E. L., Solano E., Aberaturi M., 2009, ArXiv e-prints
- Marley et al. (2002) Marley M. S., Seager S., Saumon D., Lodders K., Ackerman A. S., Freedman R. S., Fan X., 2002, ApJ, 568, 335
- Pinfield et al. (2008) Pinfield D. J., Burningham B., Tamura M., Leggett S. K., Lodieu N., Lucas P. W., Mortlock D. J., Warren S. J., Homeier D., Ishii M., McMahon R. G., and 29 co-authors, 2008, MNRAS submitted
- Reach et al. (2005) Reach W. T., Megeath S. T., Cohen M., Hora J., Carey S., Surace J., Willner S. P., Barmby P., Wilson G., Glaccum W., Lowrance P., Marengo M., Fazio G. G., 2005, PASP, 117, 978
- Reiners & Basri (2006) Reiners A., Basri G., 2006, AJ, 131, 1806
- Robin et al. (2003) Robin A. C., Reylé C., Derrière S., Picaud S., 2003, A&A, 409, 523
- Saumon et al. (1994) Saumon D., Bergeron P., Lunine J. I., Hubbard W. B., Burrows A., 1994, ApJ, 424, 333
- Saumon & Marley (2008) Saumon D., Marley M. S., 2008, ApJ, 689, 1327
- Schilbach et al. (2009) Schilbach E., Röser S., Scholz R., 2009, A&A, 493, L27
- Schmidt et al. (2009) Schmidt S. J., West A. A., Burgasser A. J., Bochanski J. J., Hawley S. L., 2009, ApJ in press, ArXiv 0912.3565
- Sivarani et al. (2009) Sivarani T., Lépine S., Kembhavi A. K., Gupchup J., 2009, ApJ, 694, L140
- Stephens & Leggett (2004) Stephens D. C., Leggett S. K., 2004, PASP, 116, 9
- Stephens et al. (2009) Stephens D. C., Leggett S. K., Cushing M. C., Marley M. S., Saumon D., Geballe T. R., Golimowski D. A., Fan X., Noll K. S., 2009, ApJ, 702, 154
- Tokunaga et al. (2002) Tokunaga A. T., Simons D. A., Vacca W. D., 2002, PASP, 114, 180
- Warren et al. (2007) Warren S. J., Mortlock D. J., Leggett S. K., Pinfield D. J., Homeier D., Dye S., Jameson R. F., Lodieu N., Lucas P. W., Adamson A. J., and 14 co-authors, 2007, MNRAS, 381, 1400