A Spitzer Space Telescope far-infrared spectral atlas of compact sources in the Magellanic Clouds. II. The Small Magellanic Cloud
Abstract
We present far-infrared spectra, =52–93 m, obtained with the Spitzer Space Telescope in the Spectral Energy Distribution mode of its MIPS instrument, of a selection of luminous compact far-infrared sources in the Small Magellanic Cloud. These comprise nine Young Stellar Objects (YSOs), the compact H ii region N 81 and a similar object within N 84, and two red supergiants (RSGs). We use the spectra to constrain the presence and temperature of cool dust and the excitation conditions within the neutral and ionized gas, in the circumstellar environments and interfaces with the surrounding interstellar medium. We compare these results with those obtained in the LMC. The spectra of the sources in N 81 (of which we also show the ISO-LWS spectrum between 50–170 m) and N 84 both display strong [O i] 63-m and [O iii] -m fine-structure line emission. We attribute these lines to strong shocks and photo-ionized gas, respectively, in a “champagne flow” scenario. The nitrogen content of these two H ii regions is very low, definitely but possibly as low as . Overall, the oxygen lines and dust continuum are weaker in star-forming objects in the SMC than in the LMC. We attribute this to the lower metallicity of the SMC compared to that of the LMC. Whilst the dust mass differs in proportion to metallicity, the oxygen mass differs less; both observations can be reconciled with higher densities inside star-forming cloud cores in the SMC than in the LMC. The dust in the YSOs in the SMC is warmer (37–51 K) than in comparable objects in the LMC (32–44 K). We attribute this to the reduced shielding and reduced cooling at the low metallicity of the SMC. On the other hand, the efficiency of the photo-electric effect to heat the gas is found to be indistinguishable to that measured in the same manner in the LMC, –0.3%. This may result from higher cloud-core densities, or smaller grains, in the SMC. The dust associated with the two RSGs in our SMC sample is cool, and we argue that it is swept-up interstellar dust, or formed (or grew) within the bow-shock, rather than dust produced in these metal-poor RSGs themselves. Strong emission from crystalline water ice is detected in at least one YSO. The spectra constitute a valuable resource for the planning and interpretation of observations with the Herschel Space Observatory and the Stratospheric Observatory For Infrared Astronomy (SOFIA).
Subject headings:
circumstellar matter — stars: formation — stars: mass loss — supergiants — Magellanic Clouds — infrared: stars1. Introduction
About the cycle of gas and dust that drives galaxy evolution, much can be learnt from the interfaces between the sources of feedback and the interstellar medium (ISM), and between the ISM and the dense cores of molecular clouds wherein new generations of stars may form. These regions are characterized by the cooling ejecta from evolved stars and supernovae, and clouds heated by the radiation and shocks from hot stars, in supernova remnants and young stellar objects (YSOs) embedded in molecular clouds.
The interaction regions with the ISM lend themselves particularly well to investigation in the infrared (IR) domain, notably in the 50–100 m region; cool dust (–100 K) shines brightly at these wavelengths, and several strong atomic and ionic transitions of abundant elements (viz. [O i] at m, [O iii] at m, and [N iii] at m) provide both important diagnostics of the excitation conditions and a mechanism for cooling. These diagnostic signatures became widely accessible within the Milky Way, by virtue of the Kuiper Airborne Observatory (KAO, see Erickson et al. 1984) and the Long-Wavelength Spectrograph (LWS, Clegg et al. 1996) onboard the Infrared Space Observatory (ISO, Kessler et al. 1996).
The gas-rich dwarf companions to the Milky Way, the Large and Small Magellanic Clouds (LMC and SMC) offer a unique opportunity for a global assessment of the feedback into the ISM and the conditions for star formation, something which is much more challenging to obtain for the Milky Way due to our position within it. The LMC and SMC are nearby ( and 60 kpc, respectively: Cioni et al. 2000; Keller & Wood 2006) and already the scanning survey with the IR Astronomical Satellite (IRAS) showed discrete sources of far-IR emission in them (Schwering & Israel 1989); it was used to describe the diffuse cool dust and gas as well (Stanimirović et al. 2000). The stars, star-forming regions, and ISM are also lower in metal content than similar components of the Galactic Disc, Z⊙ and –0.2 Z⊙ (cf. discussion in Maeder, Grebel & Mermilliod 1999). This offers the possibility to assess the effect metallicity has on the dust content and on the heating and cooling processes, and to study these in environments that are more similar to those prevailing in the early Universe than the available Galactic examples (cf. Oliveira 2009).
The Spitzer Space Telescope marries superb sensitivity with exquisite imaging quality, able to detect the far-IR emission from a significant fraction of the total populations of YSOs, massive red supergiants (RSGs), et cetera. The telescope also carried a facility, the MIPS-SED, to obtain spectra at 50–100 m, and we used this to target representative samples of luminous 70-m point sources in the LMC and SMC. The LMC spectra are presented in paper I of this two-part series (van Loon et al. 2010); here we present the results of the SMC observations and a comparison with the LMC results.
2. Observations
| # | Principal name aaNames of the type “N [number]” are “LHA 115-N [number]” in full. | Alternative name | Object type bbUsed acronyms: H ii = region of ionized Hydrogen; RSG = Red Supergiant; YSO = Young Stellar Object. | RA and Dec (J2000) | References |
|---|---|---|---|---|---|
| 1 | IRAS 004297313 | YSO | 0 44 51.86 72 57 34.2 | 36,42,48,55 | |
| 2 | IRAS 004307326 | N 10, LIN 60 | YSO | 0 44 56.30 73 10 11.6 | 1,2,6,9,11,16,21,22,40,41,42,48,55,57 |
| 3 | S3MC 004647322 ccAbbreviation of S3MC J004624.46732207.30 (following the IRAS convention). | IRAS 004467339 ? | YSO | 0 46 24.46 73 22 07.3 | 4,16,27,30,42,46,47,48,55 |
| 4 | GM 103 | IRAS 004867308, [GB98] S10 | RSG | 0 50 30.62 72 51 29.9 | 17,18,19,20,39,48,49,50,55 |
| 5 | BMB-B 75 | RSG | 0 52 12.82 73 08 52.8 | 3,7,16,50 | |
| 6 | S3MC 005407321 ddAbbreviation of S3MC J005402.30732118.70 (following the IRAS convention). | YSO | 0 54 02.30 73 21 18.7 | 42,55 | |
| 7 | S3MC 005417319 eeAbbreviation of S3MC J005403.36731938.30 (following the IRAS convention). | YSO | 0 54 03.36 73 19 38.3 | 2,42,55 | |
| 8 | S3MC 010517159 ffAbbreviation of S3MC J010507.25715942.70 (following the IRAS convention). | IRAS 010357215 ? | YSO | 1 05 07.25 71 59 42.7 | 1,2,8,11,16,21,33,41,42,44,45,48,55 |
| 9 | IRAS 010397305 | DEM S 129, [MA93] 1536 | YSO | 1 05 30.22 72 49 53.8 | 9,14,36,41,42,48,50,55,57,58 |
| 10 | IRAS 010427215 | [GB98] S28 | YSO | 1 05 49.30 71 59 48.8 | 18,20,48,50,55 |
| 11 | S3MC 010707250 ggAbbreviation of S3MC J010659.66725043.10 (following the IRAS convention). | IRAS 010547307 ? | YSO | 1 06 59.66 72 50 43.1 | 2,9,41,42,55 |
| 12 | N 81 | IRAS 010777327, DEM S 138 | H ii | 1 09 12.67 73 11 38.4 | 1,2,6,9,10,11,12,13,15,16,21,22,23,24, |
| 25,26,28,29,30,31,32,34,37,38,41,43, | |||||
| 48,51,52,53,54,55 | |||||
| 13 | S3MC 011467318 hhfootnotemark: | (in N 84) | YSO / H ii | 1 14 39.38 73 18 29.3 | 2,5,16,35,41,42,55,56 |
References. — 1. Beasley et al. (1996); 2. Bica & Schmitt (1995); 3. Blanco, McCarthy & Blanco (1980); 4. Bot et al. (2007); 5. Bratsolis, Kontizas & Bellas-Velidis (2004); 6. Charmandaris, Heydari-Malayeri & Chatzopoulos (2008); 7. Cioni et al. (2003); 8. Copetti (1990); 9. Davies, Elliott & Meaburn (1976); 10. Dennefeld & Stasińska (1983); 11. de Oliveira et al. 2000; 12. Dufour & Harlow (1977); 13. Dufour, Shields & Talbot (1982); 14. Evans et al. (2004); 15. Filipović et al. (1997); 16. Filipović et al. (2002); 17. Groenewegen (2004); 18. Groenewegen & Blommaert (1998); 19. Groenewegen et al. (1995); 20. Groenewegen et al. (2000); 21. Henize (1956); 22. Henize & Westerlund (1963); 23. Heydari-Malayeri, Le Bertre & Magain (1988); 24. Heydari-Malayeri et al. (1999); 25. Heydari-Malayeri et al. (2002); 26. Heydari-Malayeri et al. (2003); 27. Hodge (1974); 28. Indebetouw, Johnson & Conti (2004); 29. Israel & Koornneef (1988); 30. Israel et al. (1993); 31. Kennicutt & Hodge (1986); 32. Koornneef & Israel (1985); 33. Kron (1956); 34. Krtička (2006); 35. Lindsay (1961); 36. Loup et al. (1997); 37. Martín-Hernández, Vermeij & van der Hulst (2005); 38. Martins et al. (2004); 39. McSaveney et al. (2007); 40. Meynadier & Heydari-Malayeri (2007); 41. Meyssonnier & Azzopardi (1993); 42. Oliveira et al. (in prep.); 43. Pagel et al. (1978); 44. Pietrzyński & Udalski (1999); 45. Pietrzyński et al. (1998); 46. Rubio, Lequeux & Boulanger (1993); 47. Rubio et al. (1993b) 48. Schwering & Israel (1989); 49. van Loon et al. (2001); 50. van Loon et al. (2008); 51. Vermeij & van der Hulst (2002); 52. Vermeij et al. (2002); 53. Wilcots (1994a); 54. Wilcots (1994b); 55. Wilke et al. (2003); 56. Wisniewski & Bjorkman (2006); 57. Wood et al. (1992); 58. Zijlstra et al. (1996).
2.1. Data collection and processing
Our dataset comprises low-resolution spectra obtained using the Spectral Energy Distribution (SED) mode of the Multiband Imaging Photometer for Spitzer (MIPS; Rieke et al. 2004) onboard the Spitzer Space Telescope (Werner et al. 2004), taken as part of the SMC-Spec program (PI: G.C. Sloan). The spectra cover –93 m, at a spectral resolving power –25 (two pixels) and a cross-dispersion angular resolution of 13–24′′ Full-Width at Half-Maximum (sampled by pixels). The slit is wide and long, but at one end of the slit only covers m as a result of a dead readout. To place the angular scales into perspective, pc at the distance of the SMC. This is characteristic of a SNR, star cluster, or molecular cloud core; it is smaller than a typical H ii region, but larger than a typical PN.
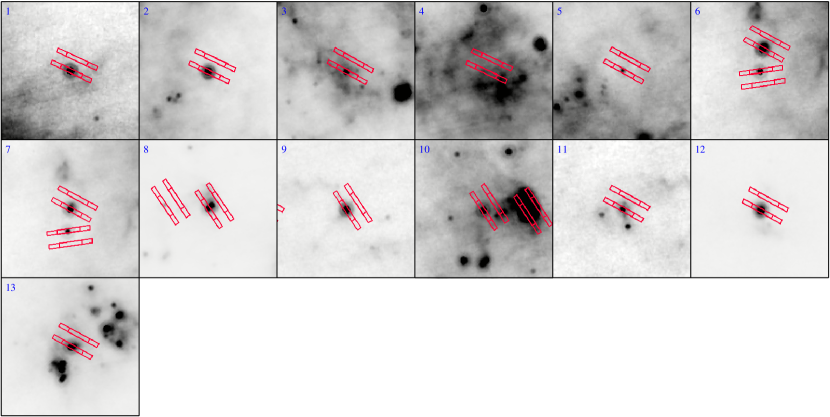
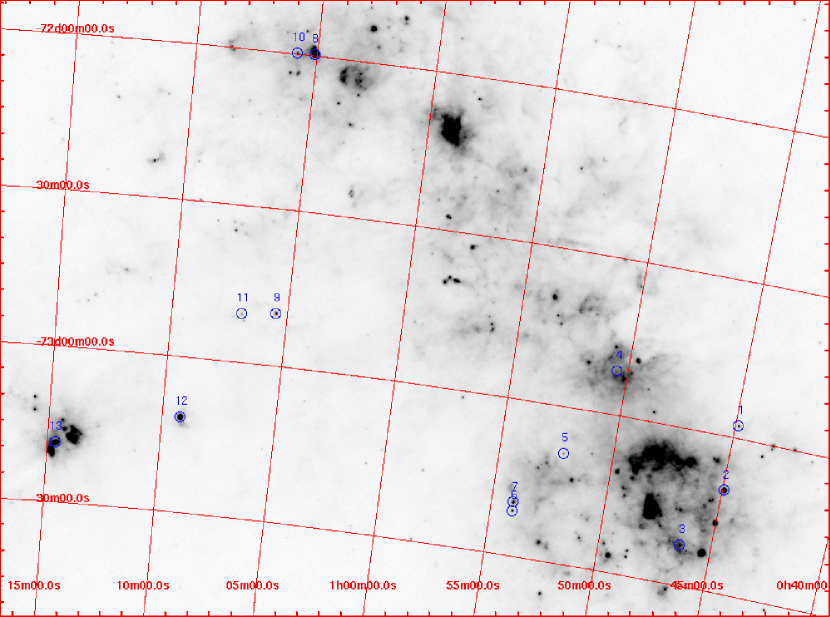
The target list, Table 1, is described in §2.2 and §3, and their distribution on the sky is displayed in Fig. 1. The background spectrum was measured at one of four possible chop positions, chosen to be free of other discrete sources of 70-m emission. This depends on the time of observation. Fig. 2 shows 70-m close-ups, extracted from the combined SAGE-SMC Spitzer Legacy Program (Gordon et al. 2010, in preparation) and S3MC Spitzer survey (Bolatto et al. 2007), with the Astronomical Observation Request (AOR) footprints overlain.
The raw data were processed with the standard pipeline version S16.1.1, and the spectra were extracted and calibrated using the dat software, v3.06 (Gordon et al. 2005). In some cases, small shifts in the centroids of well-detected, unresolved spectral lines are noticeable; these always amount to less than about a micrometer, i.e. within the spectral sampling, and no attempt was made to correct for this (cf. figure 5 and its discussion in §5.1.2). Spectra were extracted from the on-off background-subtracted frame. The extraction aperture was five pixels wide in the cross-dispersion direction, and the (remaining) background level was determined in a-few-pixel-wide apertures at either side of, and at some distance from, the extraction aperture. The extracted spectrum was corrected to an infinite aperture and converted to physical units, providing an absolute flux calibrated spectrum (cf. Lu et al. 2008).
The uncertainties in the extracted spectrum stem mostly from inaccuracies in the sky-subtraction. The statistical scatter was quantified, upon which the errorbars (e.g., as plotted in Fig. 4) are based. However, larger deviations may result from complex spatial structure of the sky emission, and this is not possible to quantify. As this is important for an overall judgment of the reliability of the spectrum, a “quality” flag was decided on the basis of a subjective assessment of the reliability of the sky subtraction and spectrum extraction. This is listed in Table 2, along with other descriptors of the MIPS-SED data. Where possible in our analysis, we have accounted for measured variations between adjacent spectral points in the computation of errorbars on derived quantities, rather than to rely solely on the errorbars derived from the statistical noise.
| # | AOR Key | Integration aaTotal on-source integration time, (s). | Quality | Extraction |
|---|---|---|---|---|
| 1 | 27535360 | 6 10 | good | on–off |
| 2 | 27535104 | 8 3 | good | on–off |
| 3 | 27532288 | 7 10 | good | on–off |
| 4 | 27536640 | 20 10 | ok | on–off |
| 5 | 27536384 | 20 10 | good | on–off |
| 6 | 27532032 | 5 10 | good | on–off |
| 7 | 27531776 | 3 10 | good | on–off |
| 8 | 27531520 | 8 3 | good | on–off |
| 9 | 27536128 | 3 10 | good | on–off |
| 10 | 27535872 | 6 10 | good | on–off |
| 11 | 27531264 | 20 10 | good | on–off |
| 12 | 27535616 | 8 3 | good | on–off |
| 13 | 27531008 | 3 10 | good | on–off |
In our analysis of the MIPS-SED data we shall also make use of associated photometry, from S3MC at 24 and 70 m with MIPS.
2.2. Target selection

The targets were selected on the basis of the following criteria: (i) point source appearance at 70 m, and (ii) a minimum flux density at 70 m of Jy. To reduce the large sample of potential targets to within a reasonable time request, a further requirement was that at the time of proposal submission there was a Spitzer IRS spectrum in the archive or planned to be taken. Due to the limitations on observing time we could not sample a wide range of object types and/or photometric properties (as we did in the LMC sample), and we have deliberately restricted ourselves to generally luminous YSOs and RSGs. They do, however, sample different regions within the SMC (see Fig. 1). Table 3 summarizes the MIPS photometric properties of the selected targets, and Fig. 3 shows them in the F vs. F/F diagram in comparison to the LMC sample.
| # | AOR Target | ||||
|---|---|---|---|---|---|
| [mJy] | [mJy] | [mJy] | [mJy] | ||
| 1 | IRAS 004297313 | 588.27 | 0.20 | 1291 | 6 |
| 2 | IRAS 004307326 | 717.69 | 0.54 | 7168 | 30 |
| 3 | S3MC 004647322 | 166.67 | 0.10 | 1191 | 12 |
| 4 | GM 103 | 100.00 | 0.07 | 121 | 8 |
| 5 | BMB-B 75 | 52.55 | 0.06 | 481 | 4 |
| 6 | S3MC 005407321 | 472.56 | 0.17 | 1502 | 6 |
| 7 | S3MC 005417319 | 812.79 | 0.27 | 2423 | 11 |
| 8 | S3MC 010517159 | 2402.03 | 0.55 | 7138 | 40 |
| 9 | IRAS 010397305 | 796.12 | 0.24 | 2353 | 6 |
| 10 | IRAS 010427215 | 569.61 | 0.14 | 1351 | 10 |
| 11 | S3MC 010707250 | 49.71 | 0.07 | 440 | 2 |
| 12 | N 81 | 1705.20 | 0.32 | 9190 | 41 |
| 13 | S3MC 011467318 | 144.06 | 0.18 | 4340 | 45 |
3. Comments on individual objects
In the remainder of this paper, we shall refer to objects from the Henize (1956) catalog as “N [number]”; the full designation would be “LHA 115-N [number]”. Sources with only an S3MC designation are abbreviated following the IRAS convention (where the last digit of the RA part derives from decimal minutes). Table 1 describes all MIPS-SED targets, with literature references checked until Summer 2009.
Some targets have been studied before, and brief summaries of their nature are given below. Essentially nothing was known previously about IRAS 004297313 (#1) and S3MC 005407321 (#6). All sources except BMB-B 75 had already been recognised as 170-m point sources in Wilke et al. (2003). The S3MC sources were first identified as candidate YSOs by one of us (J. Oliveira); all YSOs in our sample have been confirmed to be YSOs with ground-based IR observations and Spitzer IRS spectra (Oliveira et al., in prep.).
3.1. IRAS 004307326 (#2)
The IR source is seen projected upon a nebulous cluster (Bica & Schmitt 1995; de Oliveira et al. 2000), and is embedded within the compact H ii region SMC-N 10 (Henize 1956) = DEM S 11 (Davies, Elliott & Meaburn 1976); Henize & Westerlund (1963) estimated a nebular mass M⊙. It was detected as a compact radio continuum source by Filipović et al. (2002). Meynadier & Heydari-Malayeri (2007) recognised it as a very-low excitation “blob”, possibly powered by less massive stars; however, Charmandaris, Heydari-Malayeri & Chatzopoulos (2008) conclude that the mid-IR properties resemble simply a scaled-down version from more prominent H ii regions.
3.2. S3MC 004647322 (#3)
This IR object is possibly associated with the dark cloud #7 in Hodge (1974), which was also the strongest 12CO(1–0) and 13CO(1–0) detection in the ESO/SEST key programme (Israel et al. 1993), SMC-B1, which is split up into SMC-B1 2 and 3 each containing an estimated few M⊙ (Rubio, Lequeux & Boulanger 1993; Rubio et al. 1993b). The mm-continuum emission from B1 2 was much brighter and more extended than that from B1 3 (Bot et al. 2007).
3.3. GM 103 (#4)
GM 103 is identified with IRAS 004867308, near N 36 (Henize 1956). A ground-based N-band spectrum showed the 10-m silicate feature in emission (Groenewegen et al. 1995); modelling of the SED yielded a mass-loss rate of M⊙ yr-1 and a luminosity near the AGB maximum associated with the Chandrasekhar limit for the core mass. Groenewegen & Blommaert (1998) presented an optical spectrum, of late-M spectral type; apparently cooler than the M 4 type which Groenewegen has assumed in other works. McSaveney et al. (2007) presented an analysis of the pulsation properties. They confirmed the long pulsation period of d, at a large near-IR amplitude of mag, and a luminosity near the AGB maximum. From pulsation modelling they derived a (current) mass of M⊙. Van Loon et al. (2008) presented a 3–4 m spectrum, resembling that of a cool luminous star.
3.4. BMB-B 75 (#5)
An M 6-type star (Blanco, McCarthy & Blanco 1980), it has a luminosity near the AGB maximum, and shows Mira-type variability with a very long period of d (Cioni et al. 2003). A 3–4 m spectrum was presented in van Loon et al. (2008); it resembles that of a cool giant star. There is a compact radio continuum source within a few arcsec, which was only detected at 2.37 GHz (not at 1.42, 4.80 or 8.64 GHz), at a level of 8 mJy (Filipović et al. 2002).
3.5. S3MC 005417319 (#7)
This source is seen projected against the star cluster [H86] 144 (Bica & Schmitt 1995).
3.6. S3MC 010517159 (#8)
This IR source sits in the middle of the cluster OGLE-CL SMC 147 (Pietrzyński et al. 1998), which has an estimated age of Myr (Pietrzyński & Udalski 1999). There are several compact H ii regions nearby, the closest of which is #1520 in Meyssonnier & Azzopardi (1993), at . These sources form part of the much larger, loose stellar association NGC 395 (Kron 1956; Bica & Schmitt 1995) associated with N 78 (Henize 1956) = DEM S 126 (Davies et al. 1976), which contains a further two compact H ii regions (Indebetouw, Johnson & Conti 2004) and is an extended source of radio continuum emission (Filipović et al. (2002). Curiously, at , opposite to [MA93] 1520, is the background galaxy 2MFGC 779 (Mitronova et al. 2004).
3.7. IRAS 010397305 (#9)
This red IR object is a compact source of H emission, #1536 in Meyssonnier & Azzopardi (1993), identified with DEM S 129 (Davies et al. 1976), and probably an early-B type stellar object (#2027 in Evans et al. 2004). It was recognized as a YSO for its Br and Pf emission lines on top of a red continuum in the 3–4 m spectrum (van Loon et al. 2008).
3.8. IRAS 010427215 (#10)
This very red IR source (Groenewegen & Blommaert 1998) has long been considered as a candidate dust-enshrouded AGB star or RSG. Groenewegen et al. (2000) modelled the SED assuming a spectral type of M 8, but the obtained luminosity is rather low ( L⊙). This raises doubts about it being a cool, evolved star. Indeed, it was recognized as a YSO by van Loon et al. (2008), on the basis of water ice absorption and Br and Pf emission lines on a very red continuum in the 3–4 m spectrum.
3.9. S3MC 010707250 (#11)
This source can be identified with a faint, compact H emission-line object, #1607 in Meyssonnier & Azzopardi (1993), which is situated in a stellar association within the H ii region DEM S 133 (Davies et al. 1976; Bica & Schmitt 1995).
3.10. N 81 (#12)
The IR source IRAS 010777327 is associated with the rather isolated, very bright compact H ii region N 81 (Henize 1956) = DEM S 138 (Davies et al. 1976). A comprehensive HST optical imaging and spectroscopic-imaging study was performed by Heydari-Malayeri et al. (1999, 2002), who identified several O-type stars within a few arcseconds in the core of the H ii region. These stars are young, possible pre-main sequence, inferred from their low luminosity and weak stellar winds. Nonetheless, they induce a “Champagne flow” (Heydari-Malayeri et al. 1999), with a shock-compressed front in one direction (West), and an ionized tail in the opposite direction (East). This picture was confirmed with high-resolution radio continuum images, by Indebetouw, Johnson & Conti (2004) and Martín-Hernández, Vermeij & van der Hulst (2005). The latter estimated an ionized mass of M⊙, rather less than Henize & Westerlund (1963), who had estimated M⊙ from optical spectroscopy. The detection of H2 in its excited S1(1–0) transition at m (Koornneef & Israel 1985) confirmed the presence of a mild shock. CO was also detected (Israel et al. 1993), though weakly. Vermeij et al. (2002) presented ISO SWS and LWS spectra, and we compare with their measurements (see §5).
3.11. S3MC 011467318 (#13)
The nature of this source is unclear. It is seen projected against the rich star cluster NGC 460 (Kron 1956) = IRAS 011337333 (Loup et al. 1997), with a rather uncertain age estimated to be yr (Hodge 1983). The cluster has plenty of (candidate) Be stars (Wisniewski & Bjorkman 2006), yet the nearest recorded objects are away. One of these is an emission-line star, #507 in Lindsay (1961) = #1792 in Meyssonnier & Azzopardi (1993), which is a candidate Be star (Wisniewski & Bjorkman 2006). Unrelated to that source but not much further away (8–) is an extended radio continuum source (Filipović et al. 2002). The cluster is embedded in the bright H ii region N 84A (Henize 1956) = DEM S 151 (Davies et al. 1976), for which Copetti (1990) estimated an ionized mass of M⊙. Testor & Lortet (1987), pioneering CCD imaging, argued for an extended period of sequential star formation in this part of the SMC, and the presence of unevolved O stars in the N 84 region was taken as a sign of continued star formation. Weak 12CO(1–0) emission appears to be associated with it, though the bulk of emission arises from further North-West (Mizuno et al. 2001). Hodge (1974) identified a dark cloud in this region. More detailed investigations of the molecular and dust distribution in the N 83/N 84 region were conducted by Bolatto et al. (2003) and Lee et al. (2009), but S3MC 011467318 does not appear to be associated with any conspicuous feature in their maps.
4. Results

The MIPS-SED spectra of all 13 targets are presented in Fig. 4. All targets were considerably brighter than the surrounding sky emission, except GM 103 (of which nevertheless a reliable spectrum could be extracted). Table 4 summarizes properties derived from the Spitzer data.
One or two fine-structure emission lines may be seen, [O i] 3P(1–2) and [O iii] 3P(0–1), at and 88.4 m, respectively. These are discussed in §5.1. There is no convincing detection of the [N iii] 2P(1/2–3/2) transition at m, and we discuss the implication in §5.2. There is evidence for additional discrete features in the spectra of some objects, but their identification is uncertain. They are discussed in §5.4. The slope of the continuum is an indication of the dust temperature and is discussed in §5.3.
| # | AOR Target | Type aaThe spectral classification scheme is described in §4.2. | bbThe spectral slope is defined as: . | ccThe dust temperature was estimated from the spectral slope as described in §5.3.1. | ddUpper limits to the line luminosities correspond to 1- values. | ddUpper limits to the line luminosities correspond to 1- values. | eeThe far-IR luminosity was estimated based on the dust temperature as described in Paper I, assuming a distance of 60 kpc. | Notes |
|---|---|---|---|---|---|---|---|---|
| [K] | ———————— [L⊙] ———————— | |||||||
| 1 | IRAS 004297313 | F0 | 5 | |||||
| 2 | IRAS 004307326 | F0 | f | |||||
| 3 | S3MC 004647322 | C1 | 7 | f? | ||||
| 4 | GM 103 | C0 | 9 | 5 | ||||
| 5 | BMB-B 75 | C0 | 4 | |||||
| 6 | S3MC 005407321 | F0 | 3 | f? | ||||
| 7 | S3MC 005417319 | W0b | 8 | |||||
| 8 | S3MC 010517159 | W2b | 2 | |||||
| 9 | IRAS 010397305 | C0b | 5 | |||||
| 10 | IRAS 010427215 | F3b | 3 | |||||
| 11 | S3MC 010707250 | C1 | 2 | 1 | ||||
| 12 | N 81 | F2 | 5 | 7 | ||||
| 13 | S3MC 011467318 | C2b | 5 | 4 | ||||
4.1. Clarification of the nature of S3MC 011467318
The MIPS-SED spectrum of this object (Fig. 4, #13) looks very much like that of N 81 (Fig. 4, #12), so it is likely an (ultra)compact H ii region too. Although N 84 has been suggested to be a somewhat evolved molecular cloud complex, it is not unprecedented to encounter YSO-like objects near more mature massive stars, e.g., the proplyd Ori-IRS1 (van Loon & Oliveira 2003). The identification of this source in N 84 suggests that star formation is still on-going there.
4.2. Classification of the MIPS-SED spectra
A simple classification scheme based on the spectral appearance, “The Keele System”, was first introduced in Paper I. The primary spectral type is defined as follows:
-
An upper-case letter denotes the continuum slope, for a spectrum expressed in Fν as a function of : C = rising (e.g., relatively cold dust); F = flat (this includes spectra with a peak mid-way the MIPS-SED range); W = declining (e.g., relatively warm dust);
-
Following the upper-case letter, a number denotes the presence of the [O i] and [O iii] lines: 0 = no oxygen lines are present; 1 = the [O i] line is present, but the [O iii] line is not; 2 = both [O i] and [O iii] lines are present; 3 = the [O iii] line is present, but the [O i] line is not.
A secondary classification is based on additional features: a lower-case letter “b” may follow the primary type in the presence of a bump in the –80 m region.
We have classified all spectra (Table 4), erring on the side of caution with respect to the detection of spectral lines. So, for instance, an object with spectral type C0 may still display weak oxygen lines in a higher-quality spectrum.
5. Discussion
We first discuss the oxygen fine-structure emission lines (§5.1), followed by the nitrogen line (§5.2), and then the dust continuum (§5.3) and discrete features possibly due to ice, molecules, or minerals (§5.4). At the end (§5.5), we summarize the population MIPS-SED characteristics and compare with those in the LMC presented in Paper I.
5.1. Oxygen
The diagnostic value of the oxygen lines was described in detail in Paper I (cf. Tielens & Hollenbach 1985). We recall that the [O i] line at m is an important cooling line in relatively dense and neutral or weakly-ionized gas, and it is enhanced if slow shocks are present. The [O iii] line at m is a measure of the electron density in ionized gas such as that which occupies H ii regions.
The line luminosities in the SMC sources can be found in Table 4, for an assumed distance of 60 kpc. They were computed in identical fashion to those of the LMC sources in Paper I, by summing the three spectral points centered on the line (data registered at 60.81, 62.52 and 64.23 m for the [O i] line, and at 86.46, 8817 and 89.88 m for the [O iii] line) after subtracting a continuum obtained by linear interpolation between the spectral points immediately adjacent to the integration interval. The error was computed by adding in quadrature the errors in the three spectral points that were summed, and three times the error in the mean of the two continuum anchors (to account for the error in the continuum estimate at each of the three spectral points).
5.1.1 Oxygen in star-forming regions and YSOs
The oxygen lines in the objects associated with star formation are weak. In fact, on closer inspection, the only really convincing detections are in S3MC 010517159, N 81, and S3MC 011467318 (Fig. 4, #8, #12 and #13), where both the [O i] and [O iii] lines are clearly discernible. In the LMC sources associated with star formation, [O i] was more often detected; this is partly because the detection threshold (in L⊙) was about half that in the SMC observations, but most LMC sources were above the SMC threshold too.
5.1.2 Shocks and ionized gas in the compact H ii regions N 81 and S3MC 011467318 in N 84
In the case of N 81, the MIPS-SED aperture comfortably includes the entire radio source associated with this H ii region. Previous observations made by Vermeij et al. (2002) using the ISO-LWS employed a much larger aperture, with a circular diameter; there is not much more emission than captured in the MIPS-SED slit and thus the spectra are comparable. Vermeij et al. measured W m-2 and W m-2, or 414 and 829 L⊙, respectively, which is not radically different from the line fluxes we determined (Table 4).

Vermeij et al. did not publish the ISO-LWS spectrum, so we extracted the pipeline-processed spectrum from the ISO Archive. It is composed of individual segments, with large jumps in flux level from one segment to the other. We used the overlap regions to calibrate them relative to one another, and applied a global correction factor to bring the flux level in line with that in our MIPS-SED spectrum. The result is shown in Fig. 5, both at the ISO-LWS spectral resolution and convolved with a Gaussian of width 3.5 m (MIPS-SED spectral resolution). The continuum is more reliably measured in the MIPS-SED spectrum; the oxygen lines are better resolved in the ISO-LWS spectrum. The [O iii] 88-m line was recorded in two overlapping LWS segments but at rather different intensities; nevertheless the convolved line profile matches that in the MIPS-SED spectrum quite well. The [O i] 63-m line is more discrepant, but this is due to a bump in the ISO-LWS spectrum longward of the oxygen line — it could be due to water ice, but the corresponding ISO-LWS segment drops suspiciously at that side, and it was not recorded in the MIPS-SED spectrum.
The ISO-LWS spectrum of N 81 (Fig. 5) also includes the [O iii] 52-m line, and the important [C ii] 158-m cooling line. The latter is probably sampled from a larger region than that sampled by the MIPS-SED; the [O i] 63-m line is expected to dominate the cooling in the denser inner part of the cloud (see §5.5.2).
The strength of the oxygen lines of such different ionization stage indicates the coincidence of both ionized gas and shocks. This is consistent with the idea of the “champagne flow” (note that in this scenario there is a distinct spatial segregation between the shocked gas and the photo-ionized gas, but this is not resolved in our observations). The detection of the H2 S1(1–0) line at 2.121 m in N 81 (Koornneef & Israel 1985) is also indicative of a mild shock.
The source S3MC 011467318, in N 84, is virtually identical to N 81, only a little bit fainter. We thus conjecture that it is of a similar nature, i.e. a compact H ii region with a champagne flow structure. Stars must recently have formed here, and are now blowing the cloud apart through their mechanical and radiative feedback.
5.1.3 Oxygen in evolved objects
No oxygen line emission is seen in either GM 103 or BMB-B 75 — the apparently significant detection of [O iii] is an anomaly caused by the poor signal near the edge of the MIPS-SED range (these are two of the faintest targets). This is not very surprising as RSGs lack a potent excitation mechanism for these lines, and even in the LMC the [O i] line was tentatively detected only in the most luminous RSG, WOH G064 (Paper I).
5.2. Nitrogen
Evidence has been presented of a low nitrogen content in relation to the abundance of other common metals such as oxygen, if the overall metallicity is low (Rubin et al. 1988; Simpson et al. 1995; Roelfsema et al. 1998; Rudolph et al. 2006). This hinges on evidence in the Magellanic Clouds, which is rather limited. Any additional or refined measurements in the Magellanic Clouds are most welcome to solidify — or weaken — the observed trend.
In Paper I we used the best MIPS-SED spectra of LMC compact H ii regions to estimate that the nitrogen-to-oxygen ratio, and possibly as low as , which is much below the 0.1–0.4 typical in the Galactic Disc. Like in the LMC sample, no nitrogen line is detected in the SMC sample. Can we still place interesting upper limits? This depends on the strength of the reference oxygen line, preferably the [O iii] line at 88 m as the ionization potential of the lower level of this transition is similar to that of the [N iii] line at 57 m. The [O iii] is not phenomenally bright in any SMC source and we are anticipating . But the spectra of N 81 and S3MC 011467318 are very good, displaying strong [O iii] lines.
Assuming a detection level of the [N iii] line at 57 m similar to the 1- noise level near the [O i] line at 63 m, we would get [N iii]/[O iii] in N 81 and in S3MC 011467318. To place this improvement in context, previous data on N 81 obtained with ISO-LWS by Vermeij et al. (2002) yielded a limit of W m-2, or 426 L⊙, and thus (see above) [N iii]/[O iii]. Vermeij & van der Hulst (2002) estimated an electron density few cm-3. At such modest electron density we would derive (Liu et al. 2001) . However, if the true electron density is higher, the limit may be reduced to as low as . This compares favourably with the abundance estimates obtained by Dufour, Shields & Talbot (1982), , and suggests that, indeed, the nitrogen content in the metal-poor SMC is even lower than that in the LMC.
5.3. Dust continuum
As in Paper I, we define the continuum slope as follows:
| (1) |
such that in a flat spectrum and in the Rayleigh–Jeans approximation to the long-wavelength tail of a Planck curve. These values were computed from the mean values of the three spectral points centered at 55 and 85-m, respectively, and are listed in Table 4. The error was computed by propagation of the standard deviations in the two sets of three spectral points used.
5.3.1 Dust temperatures
The dust temperature characterizing the MIPS-SED range is a powerful discriminant between warm circumstellar envelopes of evolved stars and cold molecular clouds in star-forming regions. We have estimated the dust temperature by comparison with a single grey-body:
| (2) |
where is a Planck emission curve at the dust temperature , the optical depth , and –2, here assumed (cf. Goldsmith, Bergin & Lis 1997). Using the curve in figure 6 in Paper I, we converted the values into dust temperatures. The results are listed in Table 4.
The temperatures of YSOs and compact H ii regions in our SMC sample are –51 K, or K on average. This is considerably warmer than sources in the LMC (Paper I), which have –44 K.
On the basis of IRAS data, at lower spatial resolution than the Spitzer data around 70 m, Stanimirović et al. (2000) estimated K for N 81 (which they may not have resolved), but reaching K in N 88; elsewhere in the Shapley Wing they derived –27 K, and varying between –30 K in the SMC Bar. It thus appears that the diffuse ISM is cold, below 30 K, but the temperature rises above 40 K within the cores of star-forming regions. Compact sources in star-forming regions in the SMC may have more compact, hence warmer dust envelopes than such sources in the LMC, possibly as a result of diminished attenuation of the destructive effect of the interstellar radiation field in the metal-poor, dust-depleted SMC.
In contrast, the dust in the two RSGs in our SMC sample is much cooler than that in similar sources in the LMC (Paper I). In fact, the dust temperature of the RSGs in the SMC is indistinguishable from that of the YSOs. We explore this in more detail in the following subsection.
5.3.2 Cool dust around red supergiants: swept-up ISM?
The two bright RSGs in the LMC, WOH G064 and IRAS 052806910, had MIPS-SED spectra which declined even more steeply than a Rayleigh–Jeans tail of a hot black-body, indicative of dust emission but at a temperature over 100 K. The two RSGs in the SMC sample exhibit far-IR emission associated with dust of only –42 K. Such cool dust was occasionally seen in less massive evolved stars in the LMC, notably carbon stars, and the explanation put forward then was that this is swept-up interstellar dust rather than dust produced by these stars (see Paper I).
Perhaps this scenario also applies to the two RSGs in the SMC sample (cf. van Loon et al. 2008): if the far-IR emission from the warm circumstellar dust is weak — due to a low dust-to-gas ratio in the metal-poor wind — then the far-IR emission may be dominated by that from cool ISM dust (though the dust-to-gas ratio in the ISM, too, is low in the metal-poor SMC). In the case of GM 103, the sky surrounding the point source shows complex far-IR emission arising from the ISM near this star (see Figs. 1 & 2). It would not therefore come as a surprise that this star has collected ISM dust in a bow-shock as it has plowed through the relatively dense ISM in this part of the SMC. This does not appear to be the case for the other RSG, though: BMB-B 75 is in fact seen against a relatively “empty” bubble (see Figs. 1 & 2).
Alternatively, the dust may have formed — or grown (by condensation onto pre-existing grains) — within the bow-shock itself. Indeed, these slow shocks (few tens of km s-1) bear similarity to those traveling through the molecular atmospheres of dust-producing pulsating red giant stars (Bowen 1988). This would naturally explain dust near BMB-B 75 in the absence of diffuse ISM dust.
5.4. Ice, molecules, and minerals
The broad (several m) emission features seen in some of the spectra are almost certainly due to either minerals or ices. At the spectral resolution of MIPS-SED, the detection of molecules is rare, though not entirely ruled out (cf. Paper I and §5.4.2).
5.4.1 Water ice
Crystalline water ice has significant opacity in the 60–70 m region. The feature is generally broad, but the peak wavelength and profile shape can vary considerably (e.g., Malfait et al. 1999; Dijkstra et al. 2006).
The bump between –70 m in the spectrum of IRAS 004307326 is too sharp to be the peak of a single black-body, but too broad (and displaced) to be the [O i] line. We thus suggest this is a strong emission feature of crystalline water ice. This would not be surprising as this is also the object with the strongest water ice absorption at m in the Spitzer-based SMC sample observed in that way (J.M.Oliveira et al., in prep.). What is surprising is that the dust is not very cold, but perhaps this is the reason for the ice to have crystallized to the degree we witness.
S3MC 004647322 is the YSO with the coldest dust in our MIPS-SED sample. The bump around m is slightly displaced to longer wavelengths than the [O i] line seen in other objects, and it is thus possible that in this case it is due to crystalline water ice and not oxygen.
A third YSO, S3MC 005407321 exhibits an emission feature closer to 60 m, which might also be due to crystalline water ice.
5.4.2 Molecules
GM 103 displays the same sharp peak around 79 m that was also noticed in the MIPS-SED spectra of the SNR N 49 and PN or high-mass star IRAS 050476644 in the LMC (Paper I). Then, it was suggested that it may be due to a blend of the cluster of relatively strong transitions of water vapour and OH emission lines around that wavelength (cf. Lerate et al. 2006). The detection in the spectrum of GM 103 is of rather low significance. However, if the swept-up dust scenario is true (§5.3.2) then a slow (C-type) shock could be held responsible for the prolific formation of water vapour (Bergin, Neufeld & Melnick 1998).
5.4.3 Minerals
Broad emission features are sometimes seen around 75 m, most clearly in IRAS 010427215 and possibly in S3MC 010517159. These are both YSOs, just like the YSO N 159S in the LMC in which a similar bump was seen (Paper I).
Although the carrier of this feature is not yet known, it is reassuring that a similar feature appears in the SMC and LMC spectra. In Paper I we suggested that hydrous silicates provide a promising identification.
5.5. Comparison of the SMC with the LMC
5.5.1 Dust and oxygen content
There are 11 objects in our SMC sample that are associated with star-formation (YSOs and compact H ii regions). There are 22 similar objects in the LMC sample (Paper I). It thus becomes meaningful to compare these samples to identify fundamental differences between these two galaxies. If differences are found, an obvious reason for these might be the difference in metallicity between these galaxies.
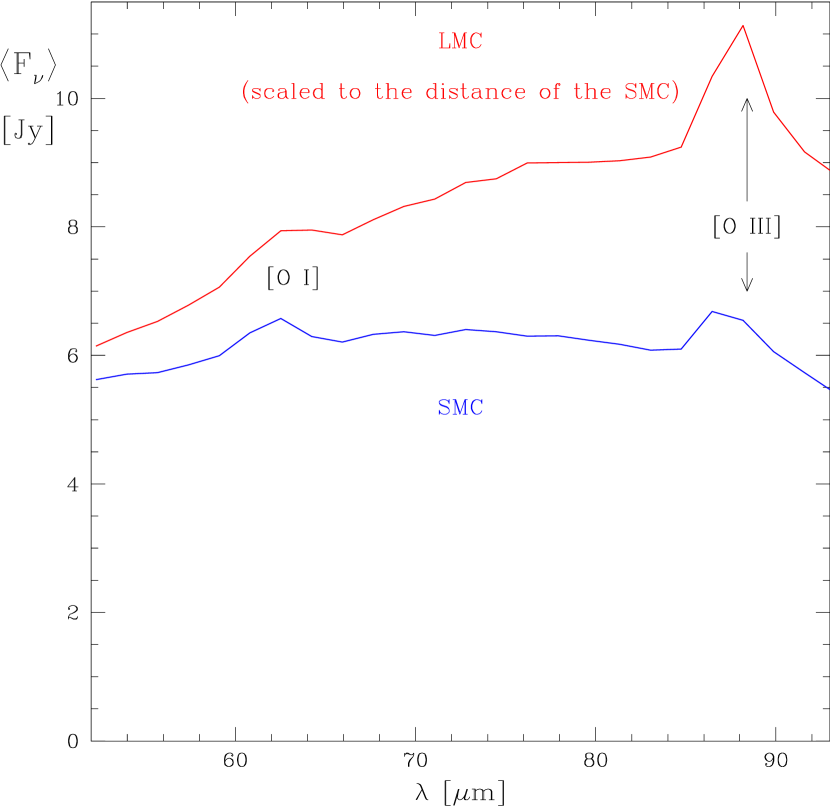
A comparison of the average MIPS-SED spectra between the SMC and LMC star-formation objects immediately reveals three conspicuous differences (Fig. 6). First, the continuum in the SMC is fainter. This could imply a lower dust content in the SMC. Second, the continuum in the SMC is flat, as opposed to the rising continuum in the LMC. This could imply that the dust is warmer in the SMC, as we quantified earlier. Third, the oxygen lines are weaker in the SMC. This could reflect a lower oxygen abundance in the SMC.
The lower dust and oxygen content is not surprising given that the metallicity of the ISM in the SMC is lower than that of the LMC. To quantify the difference in dust content, we compare the average far-IR luminosities between the 11 SMC and 22 LMC star-formation objects, where we remind the reader that we computed the far-IR luminosity due to the modified black-body emission from dust at a temperature (see Paper I for details). This luminosity is a function of the dust mass, , as well as the dust temperature:
| (3) |
Assuming, as before, a value for , we thus obtain .
The difference in dust content is very similar to the factor 2–4 difference in metallicity between the SMC and LMC, and suggests that the total dust mass of a star-forming molecular cloud core scales in proportion to its metallicity. Whilst unsurprising at first, this seems at odds with the even lower values for the dust-to-gas ratio that have been measured in the diffuse ISM of the SMC ( that in the Galaxy, Stanimirović et al. 2000), and with the smaller sizes of CO clouds in the SMC (Lequeux et al. 1994). Grain growth within clouds might enhance the dust-to-gas ratio over that typically encountered in the diffuse ISM; this was recently suggested to happen in molecular cloud cores within the metal-poor tail of the SMC (Gordon et al. 2009). To explain more efficient growth in the SMC would require the densities within molecular cloud cores in the SMC to be larger than within those in the LMC, as the growth timescale (Zhukovska & Gail 2009).
For the oxygen lines we obtain a luminosity ratio of , i.e. very similar to the ratio of far-IR luminosities (which is ) but less than expected from a simple scaling with metallicity. Higher densities in cloud cores in the SMC would explain this. Alternatively, if core-collapse supernovae from massive stars contributed relatively more (compared to intermediate-mass stars) to the chemical evolution of the SMC than they did to that of the LMC, then the oxygen abundances of the SMC and LMC may be more similar than their ratio of [Fe/H].
Hence we suggest that, for star formation to proceed in metal-poor clouds the cloud cores may require higher gas densities, in order to cool efficiently and to shield themselves sufficiently against heating by irradiation. This is in broad agreement with theoretical models, which predict that star formation requires higher densities at lower metallicities (Krumholz, McKee & Tumlinson 2009).
5.5.2 Dust temperature and the photo-electric effect

We can also compare the SMC objects with the LMC objects in the diagnostic diagrams introduced in Paper I (Fig. 7).
The difference in spectral slope is again apparent by the YSOs and compact H ii regions in the SMC exhibiting higher dust temperatures in general than their LMC counterparts (Fig. 7). The reduced dust content in the SMC causes a reduction in the ability of a molecular cloud to shield its core against the radiation from nearby (as well as embedded) hot stars. As a result, this radiation can penetrate deeper into the cloud, and warm it. The lower abundance of oxygen, carbon, and molecules and dust in the SMC reduce the ability for molecular clouds to cool. The increased heating and reduced cooling lead to a higher equilibrium temperature of the dust. The LMC–SMC transition in metallicity may thus probe a regime in which metallicity affects the thermal balance of star-forming clouds (cf. Oliveira 2009; Oliveira et al. 2009).
Although the oxygen lines are weak in the SMC stars, the [O i]/FIR ratio and [O iii]/[O i] line ratio are very similar between these two galaxies (Fig. 7). The [O iii]/[O i] line ratio is a measure of the excitation conditions in the gas. These conditions are set by a variety of processes, distinguishing between the impact from (slow, C-type) shocks and that from irradiation (cf. §5.1 and Paper I). On the one hand, the boundary condition set by the interstellar radiation field (ISRF) differs between the SMC and LMC, with the ISRF being harsher in the SMC due to the reduced photospheric opacities in the UV of metal-poor O- and B-type stars and the reduced extinction in the diffuse ISM as a result of the lower dust-to-gas ratio in the metal-poor diffuse ISM (e.g., Galliano et al. 2005). One might expect this to be reflected in a larger [O iii]/[O i] line ratio in the SMC compared to the metal-richer LMC, which is not evident in our data. On the other hand, even a small amount of dust can shield the interiors of molecular clouds completely against the UV photons from the ISRF. The absorbed heat goes into raising the dust temperature, as we indeed observe, but the consequences for the excitation of the gas might be mild. The small sample sizes limit our ability to explore this in more detail.
The [O i]/FIR ratio is a measure of the efficiency of the photo-electric effect. As stellar radiation impinges upon dust grains, electrons may be released that heat the gas (Spitzer 1948). At modest densities, cm-3, the gas is cooled mainly by radiation in the [C ii] 158-m line, but at higher densities cooling through the [O i] line dominates (Tielens & Hollenbach 1985; Weingartner & Draine 2001). The latter case is prevalent in the compact clouds we consider here; Rubin et al. (2009) found that the efficiency of the photo-electric effect as measured through the [C ii] line (in terms of the far-IR luminosity) in the LMC decreases from % in the diffuse ISM down to about half that in the 30 Doradus star-forming region. They employed a beam for their measurements; the compact clouds that we study here are much smaller than this, and a further reduction in the importance of the [C ii] line can be expected for these denser clouds (cf. §5.1.2).
The efficiency of the photo-electric effect that we measured through the [O i] line (in terms of the far-IR luminosity), –0.3%, is not all that different between the Magellanic Clouds. This needs to be explained, given the dependencies of the photo-electric effect on UV radiation field (), electron density (), gas temperature () and grain properties (composition, size, et cetera), and the overall drop in oxygen and dust abundance due to the reduced metallicity in the SMC compared to that in the LMC. Weingartner & Draine (2001) show how the efficiency varies with grain size, for different types of grains, as a function of . In a cool neutral medium, K, a mixture of carbonaceous and silicate grains of m achieve an efficiency of –0.3% for K1/2 cm3; the efficiency decreases for larger , and increases for smaller grains.
The similarity between the efficiency of the photo-electric effect in SMC and LMC clouds might imply that the stronger radiation field and higher gas temperature in the SMC (due to reduced shielding by dust) is offset by a higher electron density (possibly the result of a higher overall gas density, as alluded to in §5.5.1), to keep similar, or by a reduced grain size, to offset a larger . A higher density would be consistent with our proposed explanation for the dependence of dust and oxygen content on metallicity, whereas a smaller grain size would not.
6. Conclusions
We have presented the 52–93 m spectra of 13 compact far-IR sources in the Small Magellanic Cloud, obtained with MIPS-SED onboard the Spitzer Space Telescope. The sample comprises 9 Young Stellar Objects (YSOs), two compact Hii regions (N 81 and a source in N 84), and two red supergiants (RSGs) The spectra were classified using a simple classification scheme, introduced in Paper I. We measured the intensity of the fine-structure lines of oxygen — [O i] at 63 m and [O iii] at 88 m — as well as the slope of the dust continuum emission spectrum which we translated into a dust temperature. The most interesting results arising from this analysis may be summarized as follows:
-
We confirm the “champagne flow” scenario for the compact H ii region N 81, which shows both strong [O i] emission associated with shocks and strong [O iii] emission associated with photo-ionization. We discovered a very similar source in N 84.
-
The oxygen lines and dust continuum are generally weaker in the star-forming objects in the SMC than in the LMC sample presented in Paper I. We attribute this to the overall lower metallicity of the SMC compared to that of the LMC. Whilst the dust mass differs in proportion to metallicity, the oxygen mass differs less; both observations can be reconciled with higher densities inside star-forming cloud cores in the SMC than in the LMC.
-
The ratio of [O i] to IR (dust-processed) luminosity is used to estimate the efficiency of photo-electric heating in the interfaces between ionized gas and molecular clouds in YSOs and compact H ii regions; we find it is –0.3%, i.e. indistinguishable from that in the LMC (Paper I). This may be understood if the densities in cloud cores in the SMC are indeed higher than in the LMC.
-
We find a very low nitrogen content of both compact H ii regions: the nitrogen-to-oxygen ratio is definitely lower than 0.04, and perhaps even less than 0.01. This is lower than in the LMC, where it is lower than in the Galactic Disc.
-
The dust in the YSOs in the SMC is warmer, 37–51 K (45 K on average), than in the LMC (32–44 K). We propose that this is the combined result of the diminished dust fraction at the low metallicity of the SMC, which results in a reduced shielding against radiation, and less efficient cooling due to the lower abundance of oxygen, molecules and dust.
-
The dust in both RSGs in the SMC sample is cool, in stark contrast to the warm dust ( K) in RSGs in the LMC. We propose that this is swept-up interstellar dust rather than dust produced in the winds of these stars, a scenario we already proposed to explain far-IR emission from carbon stars in the LMC (Paper I). The dust might also have grown — or even formed — within the wind–ISM interaction zône. The presence of a bow-shock might also explain the possible detection of water vapour and/or OH emission in the spectrum of one of the RSGs, GM 103. The low metallicity of the SMC is likely to blame for the lack of detection of warmer circumstellar dust around the RSGs.
-
Broad emission features are seen in a few objects; these seem to correspond to similar features seen in the LMC sample (Paper I). They are interpreted as due to solid state material, likely minerals and possibly hydrous silicates.
-
We detect strong emission from crystalline water ice in one YSO in our SMC sample, IRAS 004307326, in which Oliveira et al. (in prep.) already discovered very strong water ice absorption at 3 m. Crystalline water ice may also be visible in one or two other YSOs. Possibly, the warmer dust causes processing of the ice.
References
- Beasley et al. (1996) Beasley, A. J., Ellingsen, S. P., Claussen, M. J., & Wilcots, E. 1996, ApJ, 459, 600
- Bergin, Neufeld & (1998) Bergin, E. A., Neufeld, D. A., & Melnick, G. J. 1998, ApJ, 499, 777
- Bica & Schmitt (1995) Bica, E. L. D., & Schmitt, H. R. 1995, ApJS, 101, 41
- Blanco, McCarthy & Blanco (1980) Blanco, V. M., McCarthy, M. F., & Blanco, B. M. 1980, ApJ, 242, 938
- Bolatto et al. (2003) Bolatto, A. D., Leroy, A. K., Israel, F. P., & Jackson, J. M. 2003, ApJ, 595, 167
- Bolatto et al. (2007) Bolatto, A. D., et al. 2007, ApJ, 655, 212
- Bot et al. (2007) Bot, C., Boulanger, F., Rubio, M., & Rantakyro, F. 2007, A&A, 471, 103
- Bowen (1988) Bowen, G. H. 1988, ApJ, 329, 299
- Bratsolis, Kontizas & Bellas-Velidis (2004) Bratsolis, E., Kontizas, M., & Bellas-Velidis, I. 2004, A&A, 423, 919
- Charmandaris, Heydari-Malayeri & Chatzopoulos (2008) Charmandaris, V., Heydari-Malayeri, M., & Chatzopoulos, E. 2008, A&A, 487, 567
- Cioni et al. (2000) Cioni, M.-R. L., van der Marel, R. P., Loup, C., & Habing, H. J. 2000, A&A, 359, 601
- Cioni et al. (2003) Cioni, M.-R.L., et al. 2003, A&A, 406, 51
- Clegg et al. (1996) Clegg, P. E., et al. 1996, A&A, 315, L38
- Copetti (1990) Copetti, M. V. F. 1990, A&A, 229, 533
- Davies, Elliott & Meaburn (1976) Davies, R. D., Elliott, K. H., & Meaburn, J. 1976, MmRAS, 81, 89
- Dennefeld & Stasińska (1983) Dennefeld, M., & Stasińska, G. 1983, A&A, 118, 234
- de Oliveira et al. (2000) de Oliveira, M. R., Dutra, C. M., Bica, E. L. D., & Dottori, H. 2000, A&AS, 146, 57
- Dijkstra et al. (2006) Dijkstra, C., Dominik, C., Bouwman, J., & de Koter, A. 2006, A&A, 449, 1101
- Dufour & Harlow (1977) Dufour, R. J., & Harlow, W. V. 1977, ApJ, 216, 706
- Dufour, Shields & Talbot (1982) Dufour, R. J., Shields, G. A., & Talbot, R. J. 1982, ApJ, 252, 461
- Erickson et al. (1984) Erickson, E. F., et al. 1984, in: Airborne Astronomy Symposium, p.313
- Evans et al. (2004) Evans, C. J., Howarth, I. D., Irwin, M. J., Burnley, A. W., & Harries, T. J. 2004, MNRAS, 353, 601
- Filipović et al. (1997) Filipović, M. D., Jones, P. A., White, G. L., Haynes, R. F., Klein, U., & Wielebinski, R. 1997, A&AS, 121, 321
- Filipović et al. (2002) Filipović, M. D., Bohlsen, T., Reid, W., Staveley-Smith, L., Jones, P. A., Nohejl, K., & Goldstein, G. 2002, MNRAS, 335, 1085
- Galliano et al. (2005) Galliano, F., Madden, S. C., Jones, A. P., Wilson, C. D., & Bernard, J.-P. 2005, A&A, 434, 867
- Goldsmith et al. (1997) Goldsmith, P., Bergin, E. A., & Lis, D. C. 1997, ApJ, 491, 615
- Gordon et al. (2005) Gordon, K. D., et al. 2005, PASP, 117, 503
- Gordon et al. (2009) Gordon, K. D., et al. 2009, ApJ, 690, L76
- Groenewegen (2004) Groenewegen, M. A. T. 2004, A&A, 425, 595
- Groenewegen & Blommaert (1998) Groenewegen, M. A. T., & Blommaert, J. A. D. L. 1998, A&A, 332, 25
- Groenewegen et al. (1995) Groenewegen, M. A. T., Smith, C. H., Wood, P. R., Omont, A., & Fujiyoshi, T. 1995, ApJ, 449, L119
- Groenewegen et al. (2000) Groenewegen, M. A. T., Blommaert, J. A. D. L., Cioni, M.-R.L., Okumura, K., Habing, H. J., Trams, N. R., & van Loon, J. Th. 2000, MemSAI, 71, 639
- Henize (1956) Henize, K. G. 1956, ApJS, 2, 315
- Henize & Westerlund (1963) Henize, K. G., & Westerlund, B. E. 1963, ApJ, 137, 747
- Heydari-Malayeri, Le Bertre & Magain (1988) Heydari-Malayeri, M., Le Bertre, T., & Magain, P. 1988, A&A, 195, 230
- Heydari-Malayeri et al. (1999) Heydari-Malayeri, M., Rosa, M. R., Zinnecker, H., Deharveng, L., & Charmandaris, V. 2002, A&A, 344, 848
- Heydari-Malayeri et al. (2002) Heydari-Malayeri, M., Rosa, M. R., Schaerer, D., Martins, F., & Charmandaris, V. 2002, A&A, 381, 951
- Heydari-Malayeri et al. (2003) Heydari-Malayeri, M., Meynadier, F., Charmandaris, V., Deharveng, L., Le Bertre, T., Rosa, M. R., & Schaerer, D. 2003, A&A, 411, 427
- Hodge (1974) Hodge, P. W. 1974, PASP, 86, 263
- Hodge (1983) Hodge, P. W. 1983, ApJ, 264, 470
- Indebetouw, Johnson & Conti (2004) Indebetouw, R., Johnson, K. E., & Conti, P. S. 2004, AJ, 128, 2206
- Israel & Koornneef (1988) Israel, F. P., & Koornneef, J. 1988, A&A, 190, 21
- Israel et al. (1993) Israel, F. P., et al. 1993, A&A, 276, 25
- Keller & Wood (2006) Keller, S. C., & Wood, P. R. 2006, ApJ, 642, 834
- Kennicutt & Hodge (1986) Kennicutt, R. C., Jr., & Hodge, P. W. 1986, ApJ, 306, 130
- Kessler et al. (1996) Kessler, M. F., et al. 1996, A&A, 315, L27
- Koornneef & Israel (1985) Koornneef, J., & Israel, F. P. 1985, ApJ, 291, 156
- Kron (1956) Kron, G. E. 1956, PASP, 68, 125
- Krtička (2006) Krtička, J. 2006, MNRAS, 367, 1282
- Krumholz, McKee & Tumlinson (2009) Krumholz, M. R., McKee, C. F., & Tumlinson, J. 2009, ApJ, 699, 850
- Lee et al. (2009) Lee, M.-Y., et al. 2009, AJ, 138, 1101
- Lerate et al. (2006) Lerate, M. R., et al. 2006, MNRAS, 370, 597
- Lequeux et al. (1994) Lequeux, J., Le Bourlot, J., Pineau des Forêts, G., Roueff, E., Boulanger, F., & Rubio, M. 1994, A&A, 292, 371
- Lindsay (1961) Lindsay, E. M. 1961, AJ, 66, 169
- Liu et al. (2001) Liu, X.-W., et al. 2001, MNRAS, 323, 343
- Lloyd, Lerate & Grundy (2003) Lloyd, C., Lerate, M. R., & Grundy, T. W. 2003, The LWS LO1 Pipeline, ISO Technical Note 34 (ESA)
- Loup et al. (1997) Loup, C., Zijlstra, A. A., Waters, L. B. F. M., & Groenewegen, M. A. T. 1997, A&AS, 125, 419
- Lu et al. (2008) Lu, N., et al. 2008, PASP, 120, 328
- Maeder, Grebel & Mermilliod (1999) Maeder, A., Grebel, E. K., & Mermilliod, J.-C. 1999, A&A, 346, 459
- Malfait et al. (1999) Malfait, K., Waelkens, C., Bouwman, J., de Koter, A., & Waters, L. B. F. M. 1999, A&A, 345, 181
- Martín-Hernández, Vermeij & van der Hulst (2005) Martín-Hernández, N. L., Vermeij, R., & van der Hulst, J. M. 2005, A&A, 433, 205
- Martins et al. (2004) Martin, F., Schaerer, D., Hillier, J. D., & Heydari-Malayeri, M. 2004, A&A, 420, 1087
- McSaveney et al. (2007) McSaveney, J. A., Wood, P. R., Scholz, M., Lattanzio, J. C., & Hinkle, K. H. 2007, MNRAS, 378, 1089
- Meynadier & Heydari-Malayeri (2007) Meynadier, F., & Heydari-Malayeri, M. 2007, A&A, 461, 565
- Meyssonnier & Azzopardi (1993) Meyssonnier, N., & Azzopardi, M. 1993, A&AS, 102, 451
- Mitronova et al. (2004) Mirtonova, S. N., Karachentsev, I. D., Karachentseva, V. E., Jarrett, T. H., & Kudrya, Y. N. 2004, BSAO, 57, 5
- Mizuno et al. (2001) Mizuno, N., Rubio, M., Mizuno, A., Yamaguchi, R., Onishi, T., & Fukui, Y. 2001, PASJ, 53, L45
- Oliveira (2009) Oliveira, J. M. 2009, in: The Magellanic System: Stars, Gas, and Galaxies, eds. J. Th. van Loon & J. M. Oliveira, IAUS, 256, 191
- Oliveira et al. (2009) Oliveira, J. M., et al. 2009, ApJ, 707, 1269
- Pagel et al. (1978) Pagel, B. E. J., Edmunds, M. G., Fosbury, R. A. E., & Webster, B. L. 1978, MNRAS, 184, 569
- Pietrzyński & Udalski (1999) Pietrzyński, G., & Udalski, A. 1999, AcA, 49, 157
- Pietrzyński et al. (1998) Pietrzyński, G., Udalski, A., Kubiak, M., Szymański, M., Woźniak, P., & ebruń, K. 1998, AcA, 48, 175
- Rieke et al. (2004) Rieke, G. H., et al. 2004, ApJS, 154, 25
- Roelfsema et al. (1998) Roelfsema, P. R., Cox, P., Kessler, M. F., & Baluteau, J.-P. 1998, in: Star Formation with the Infrared Space Observatory, eds. J. Yun & R. Liseau, ASPC, 132, 76
- Rubin et al. (1988) Rubin, R. H., Simpson, J. P., Erickson, E. F., & Haas, M. R. 1988, ApJ, 327, 377
- Rubin et al. (2009) Rubin, D., et al. 2009, A&A, 494, 647
- Rubio, Lequeux & Boulanger (1993) Rubio, M., Lequeux, J., & Boulanger, F. 1993a, A&A, 271, 9
- Rubio et al. (1993) Rubio, M., et al. 1993b, A&A, 271, 1
- Rudolph et al. (2006) Rudolph, A. L., Fich, M., Bell, G. R., Norsen, T., Simpson, J. P., Haas, M. R., & Erickson, E. F. 2006, ApJS, 162, 346
- Simpson et al. (1995) Simpson, J. P., Colgan, S. W. J., Rubin, R. H., Erickson, E. F., & Haas, M. R. 1995, ApJ, 444, 721
- Schwering & Israel (1989) Schwering, P. B. W., & Israel, F. P. 1989, A&AS, 79, 79
- Shapley (1940) Shapley, H. 1940, Harvard College Obs. Bull., 914, 8
- Stanimirović et al. (2000) Stanimirović, S., Staveley-Smith, L., van der Hulst, J. M., Bontekoe, Tj. R., Kester, D. J. M., & Jones, P. A. 2000, MNRAS, 315, 791
- Testor & Lortet (1987) Testor, G., & Lortet, M.-C. 1987, A&A, 178, 25
- Tielens & Hollenbach (1985) Tielens, A. G. G. M., & Hollenbach, D. 1985, ApJ, 291, 722
- van Loon & Oliveira (2003) van Loon, J. Th., & Oliveira, J. M. 2003, A&A, 405, L33
- van Loon et al. (2001) van Loon, J. Th., Zijlstra, A. A., Bujarrabal, V., & Nyman, L.-Å. 2001, A&A, 368, 950
- van Loon et al. (2008) van Loon, J. Th., Cohen, M., Oliveira, J. M., Matsuura, M., McDonald, I., Sloan, G. C., Wood, P. R., & Zijlstra, A. A. 2008, A&A, 487, 1055
- van Loon et al. (2010) van Loon, J. Th., et al. 2010, AJ, 139, 68 (Paper I)
- Vermeij & van der Hulst (2002) Vermeij, R., & van der Hulst, J. M. 2002, A&A, 391, 1081
- Vermeij et al. (2002) Vermeij, R., Damour, F., van der Hulst, J. M., & Baluteau, J.-P. 2002, A&A, 390, 649
- Weingartner & Draine (2001) Weingartner, J. C., & Draine, B. T. 2001, ApJS, 134, 263
- Werner et al. (2004) Werner, M. W., et al. 2004, ApJS, 154, 1
- Wilcots (1994a) Wilcots, E. M. 1994a, AJ, 107, 1338
- Wilcots (1994b) Wilcots, E. M. 1994b, AJ, 108, 1674
- Wilke et al. (2003) Wilke, K., Stickel, M., Haas, M., Herbstmeier, U., Klaas, U., & Lemke, D. 2003, A&A, 401, 873
- Wisniewski & Bjorkman (2006) Wisniewski, J. P., & Bjorkman, K. S. 2006, ApJ, 652, 458
- Wood et al. (1992) Wood, P. R., Whiteoak, J. B., Hughes, S. M. G., Bessell, M. S., Gardner, F. F., & Hyland, A. R. 1992, ApJ, 397, 552
- Zhukovska & Gail (2009) Zhukovska, S., & Gail, H.-P. 2009, in: The Evolving ISM in the Milky Way and Nearby Galaxies, The Fourth Spitzer Science Center Conference, eds. K. Sheth, A. Noriega-Crespo, J. Ingalls & R. Paladini, on-line proceedings at http://ssc.spitzer.caltech.edu/mtgs/ismevol/, 71
- Zijlstra et al. (2006) Zijlstra, A. A., Loup, C., Waters, L. B. F. M., Whitelock, P. A., van Loon, J. Th., & Guglielmo, F. 1996, MNRAS, 279, 32