EC 114812303 - A Peculiar Subdwarf OB Star Revisited
Abstract
EC 114812303 is a peculiar, hot, high-gravity pre-white dwarf. Previous optical spectroscopy revealed that it is a sdOB star with = 41 790 K, = 5.84, and He/H = 0.014 by number. We present an on-going spectral analysis by means of non-LTE model-atmosphere techniques based on high-resolution, high-S/N optical (VLT-UVES) and ultraviolet (FUSE, IUE) observations.
We are able to reproduce the optical and UV observations simultaneously with a chemically homogeneous NLTE model atmosphere with a significantly higher effective temperature and lower He abundance ( = 55 000 K, = 5.8, and He / H = 0.0025 by number). While C, N, and O appear less than 0.15 times solar, the iron-group abundance is strongly enhanced by at least a factor of ten.
Keywords Stars: individual: EC 114812303 - Stars: abundances - Stars: atmospheres - Stars: chemically peculiar - subdwarfs
1 Introduction
Subdwarfs of spectral type B and OB (sdB and sdOB stars, respectively) represent an extension of Horizontal Branch B (HBB) stars towards higher effective temperatures. The sdB stars are found in the range 25 000 – 30 000 K. The sdOB stars are hotter, up to 40 000 K and more, and they differ spectroscopically from the sdBs by the appearance of lines of ionized helium, e.g. the most prominent He ii Å line. The spectral analysis of sdOB stars is, thus, more reliable because may be precisely determined from the He i / Heii ionization equilibrium.
Metal-abundance determinations in Extended Horizontal Branch (EHB) stars are of particular interest, not only because they might provide insight into their evolutionary history, but also because they may shed light on the question of pulsational instability in these stars. Several sdB stars define a new instability strip in the Hertzsprung-Russell Diagram (HRD) (see, e.g. the review by O’Donoghue et al., 1999), that was predicted from pulsational models by Charpinet et al. (1996). A high iron abundance in subphotospheric layers is required for pulsation driving.
In an analysis of a large number of EHB stars, Edelmann (2003) detected that two sdOBs and one sdB are very peculiar. From optical spectra he found extreme overabundances for many iron-group elements, up to 30 000 times solar, and it is thought that the origin is radiative levitation of these elements.
2 Discovery and first spectral analysis
EC 114812303 was discovered in the Edinburgh-Cape Blue Object Survey (, Kilkenny et al., 1997). A faint companion was detected at a distance of 66, too far away to have an influence on the evolution of EC 114812303.
A first spectral analysis was performed by Stys et al. (2000). Based on optical ( Å, resolution 3.5 Å, Aug 15, 1995, 1.9m telescope at SAAO) and ultraviolet ( Å, resolution 7 Å (SWP 48111) and 0.1 Å (SWP 48112), Jul 14, 1993, IUE111International Ultraviolet Explorer) observations, they used LTE (Local Thermodynamic Equilibrium) model atmospheres (provided by Detlev Koester and Pierre Bergeron) that considered opacities of H and He only. They tried many model assumptions, homogeneously mixed, chemically stratified, “spot” models, DA + DB binary models, and weak-wind models to achieve the best fit to the H Balmer lines H to H with a homogeneous, single-star model. They determined = 41 790 K, = 5.84, and He / H = 0.014 by number. With these parameters, no satisfactory fit to the IUE data was possible. Quite unexpectedly, the observed spectrum is not as steep as it is expected for such a hot subdwarf, but instead it is rather flat. Stys et al. (2000) speculated on several possible explanations (composite binary spectrum, spot model), and concluded that EC 114812303 resembles the DAB white dwarf GD 323. We suggest that extreme line blanketing by strongly overabundant iron-group elements may be the true reason for the peculiar UV-flux shape of EC 114812303.
3 Preliminary analysis
For our analysis, we used much better observations (resolution 0.1 Å) in the optical wavelength range (3300 Å 7000 Å) which are provided in the framework of the ESO222European Southern Observatory Supernovae Ia Progenitor surveY (SPY, Napiwotzki et al., 2001) with the VLT333Very Large Telescope. We used TMAP444http://astro.uni-tuebingen.de/rauch/TMAP.html, the Tübingen NLTE Model-Atmosphere Package (Rauch & Deetjen, 2003; Werner et al., 2003) for the calculation of plane-parallel model atmospheres in hydrostatic and radiative equilibrium. We have to note here, that the consideration of H i line-broadening in the calculation of spectral energy distributions (SEDs) has changed in TMAP. First, Repolust et al. (2005) found an error in the H i line-broadening tables (for high members of the spectral series only) by Lemke (1997) that had been used before by TMAP. These were substituted by a Holtsmark approximation. Second, Tremblay & Bergeron (2009) presented new, parameter-free Stark line-broadening tables for H i including non-ideal effects. These replace Lemke’s data for the lowest ten members of the Lyman and Balmer series.
In a first step, we use the H and He lines to check for the result of Stys et al. (2000). We get significantly different results (Tab. 1). This is because, based on the new observations, we can precisely evaluate the He i / He ii ionization equilibrium and then measure the H / He abundance ratio.
| Stys et al. (2000) | our work | |
|---|---|---|
| / K | 41 790 | 55 000 |
| / (cm/sec2) | 5.84 | 5.8 |
| H / He (mass) | 18 | 100 |
| He / H (number) | 0.014 | 0.0025 |
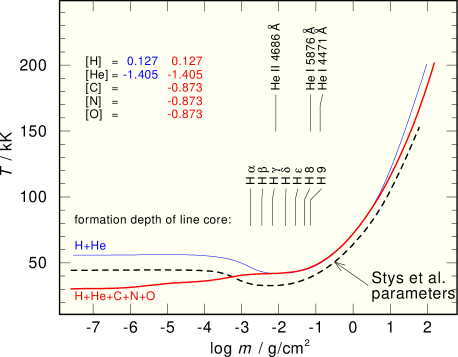
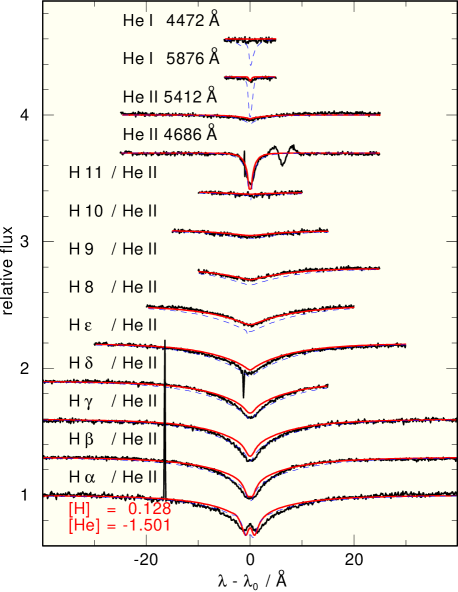
In Fig. 1, we show a comparison of spectral lines, calculated with the parameters from Tab. 1 with observations. The theoretical line profiles of the lower members of the H Balmer series strongly deviate from observations. The reason is the so-called Balmer line problem (Werner, 1996; Bergeron et al., 1993). The neglection of metal opacities in the model-atmosphere calculation yields an incorrect temperature stratification in the line-forming region. Fig. 2 shows a comparison of the temperature structure of H+He to H+He+C+N+O model atmospheres (the optical spectrum provides only upper limits for the C, N, and O abundances, we adopted these values). The effect is stronger for the lower Balmer-series members. In Fig. 2, we show also the temperature structure of a model that was calculated with the parameters of Stys et al. (2000, Tab. 1). Due to the much lower , its temperature is also much lower in the line-forming regions. This lets the fits of the Balmer lines calculated from this model appear better than the fits of our model although the Stys et al. (2000) parameters are unrealistic.
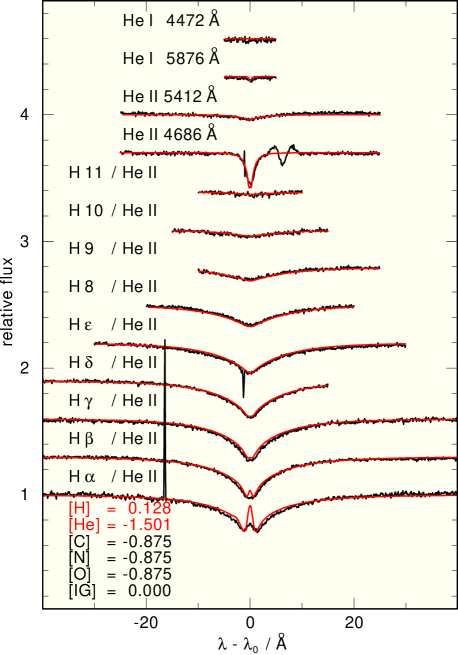
In order to demonstrate the impact of metal opacities, we include C, N, O, and the iron group (IG, here Ca – Ni) in our TMAP models. For C, N, and O, we used the upper abundance limits (see above), for IG we assume a solar mass fraction (Asplund et al., 2005)). In Fig. 3, we compare theoretical and observed line profiles of H i, He i, and He ii in the optical wavelength range. The agreement of the line wings of the lower members of the H Balmer series is much better compared to the H+He models (Fig. 2).
We can summarize, that the optical spectrum of EC 114812303 can be reproduced by a chemically not stratified NLTE model atmosphere with = K, = , and H / He = dex (by mass) when metal additional opacities are considered. Since the optical spectrum does not provide further information about metal opacities, we will continue with an analysis of the UV spectrum of EC 114812303 in the following section.
4 UV: observations and spectral analysis
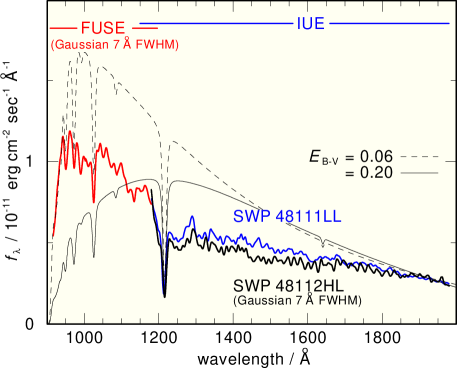
In addition to the IUE observations that were already used by Stys et al. (2000), we use FUSE555Far Ultraviolet Spectroscopic Explorer observations (May 21, 2001, obs id B0540901). They were performed in four groups (exposure times sec) that were separated by about one FUSE orbital period ( 6000 sec). The total exposure time is 8300 sec. The S/N ratio is per pixel at a resolution of Å. We cannot detect any systematic flux variation in these four groups. Thus, there is no direct hint for a companion star.
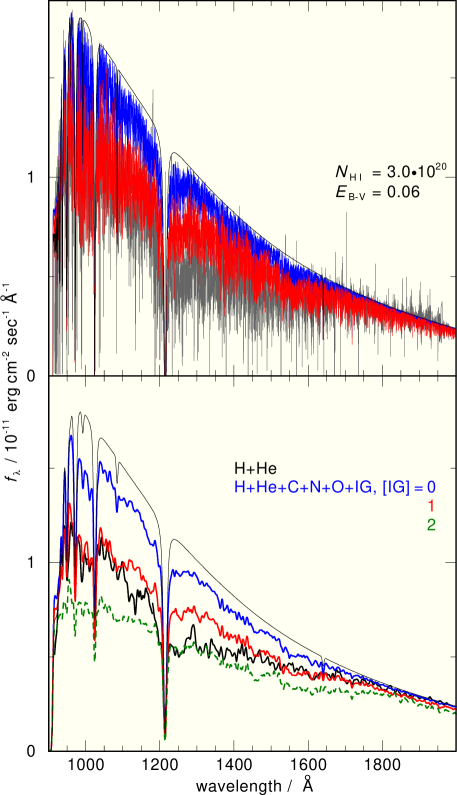
The UV observations are shown in Fig. 4. Their flux levels match well. The comparison to TMAP SEDs shows clearly, that reddening cannot be the only reason that the UV flux appears much flatter than predicted by a H+He model.
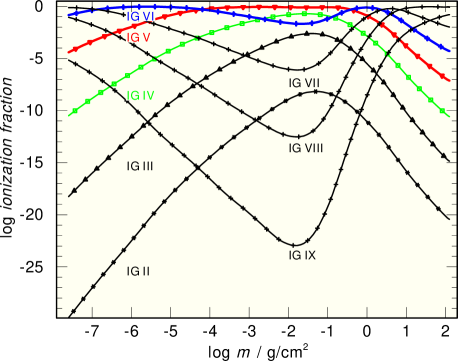
At the higher derived by us, radiative levitation could be very efficient. This supports our idea that line blanketing of overabundant iron-group elements is responsible for the flat UV flux. We calculated model atmospheres with different iron-group abundances ([IG] = 0, 1, 2). For these calculations, the complete iron group is represented by a generic model atom which was created by our IrOnIc code (Rauch & Deetjen, 2003). Fig. 5 shows the ionization fractions of the generic iron-group element (IG). IG iv to IG vi are the dominant ionization stages in the line-forming region in the relevant parameter range. In our calculations, we consider IG ii - ix.
Our main data source for iron-group elements are Kurucz’ data files (Kurucz, 1997). For line transitions, these are available as so-called “POS” lists, that include lines with laboratory measured “good” wavelengths, and “LIN” lists, that include theoretically calculated wavelengths in addition. TMAP uses the LIN lists for model-atmosphere calculations in order to have a reliable total opacity. For a comparison with observations, in general POS line lists are applied. For our comparison of the observed UV flux of EC 114812303, however, we have to use LIN lists because due to the much lower number of lines in the POS lists (e.g. for Fe vi is the number ratio LIN : POS =475 750 : 1100) results in an unrealistically high flux level.
In Fig. 6, we compare theoretical SEDs calculated with different iron-group abundances with observations. At a ten times solar abundance, the agreement with observations is good except for . In this wavelength interval, the theoretically predicted flux is still about 20 % higher than observed. Two possible reasons may be that the individual iron-group elements are differently enhanced by radiative levitation and that there are still not enough lines considered.
One of the main challenges for the spectral analysis of EC 114812303 is how to include all the lines in the TMAP calculations, i.e. where to get all the data from. Kurucz’ data files were recently extended (Kurucz, 2009) but mainly for the lowest ionization stages. The only exception is Fe where new data files are available up to Fe vi. For Fe v, e.g., the number of LIN lines increased from 1 000 385 to 7 785 320. We calculated a new model with the extended LIN lists. Although many more lines are considered on an even more refined frequency grid, the differences are within a few percent only (Fig. 7).
Changes in the individual abundances of the iron-group elements result in stronger changes in the UV flux. We performed a test calculation and increased the Ni abundance in the abundance solar pattern of our generic IG model atom by a factor of ten (Fig. 8). The flux is reduced in sections of the UV spectrum where Ni lines dominate.
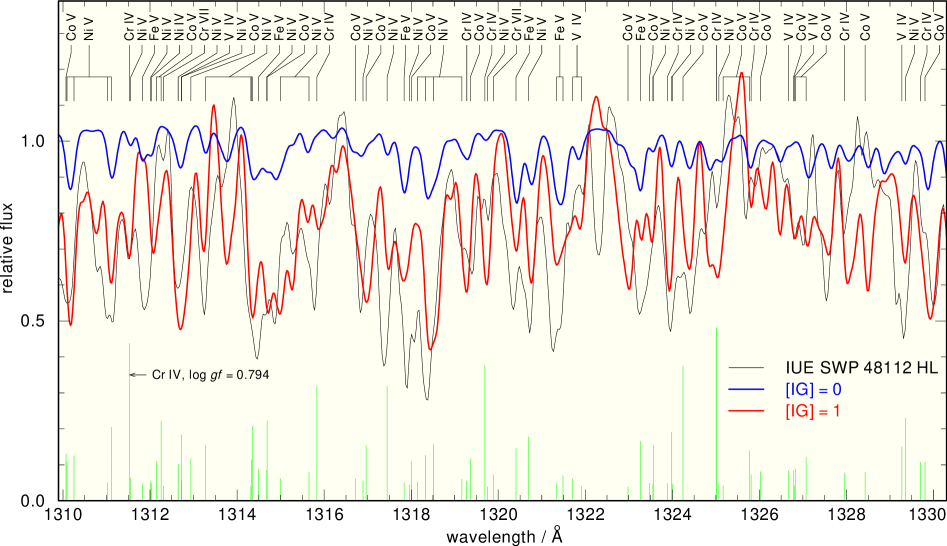
We conclude that fine tuning of all iron-group elements is necessary in order to achieve a better agreement with observations. This is corroborated by a comparison of two of our model SEDs, calculated with [IG] = 0 and [IG] = 1 and the LIN line lists with the high-resolution IUE observation (Fig. 9). The higher IG abundances yield a much better agreement with observations. A close look shows that individual lines can be identified, e.g. Co V Å, which agree well with observations and will allow a precise abundance determination. On the other hand, some strong features appear in the synthetic SEDs but they are not marked, e.g. around 1328 Å. These are found only in the LIN line lists and their true wavelength positions may be far off.
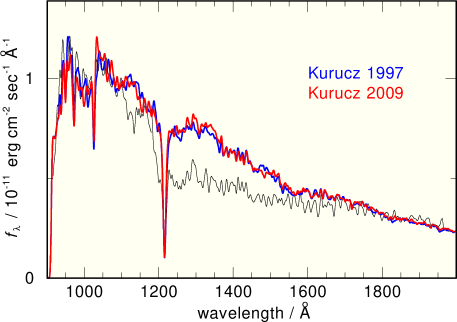
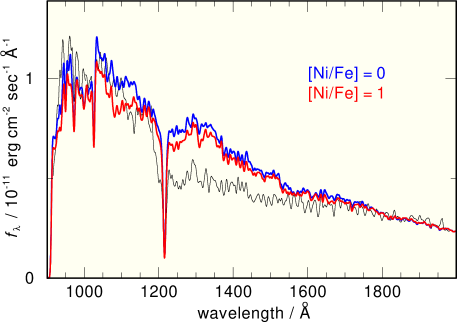
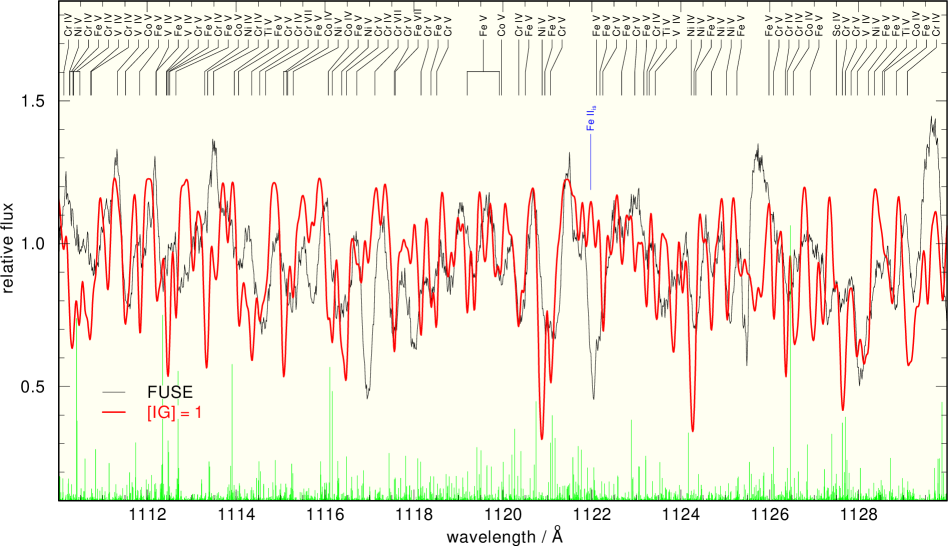
Fig. 10 compares a theoretical [IG] = 1 SED with the FUSE observation. Note the excessively large difference in the numbers of POS and LIN lines that are marked at the top and bottom, respectively. As well as in Fig. 9, we see an indication that fine tuning of iron-group abundances is necessary. Some prominent absorption features, e.g. at Å and Å, appear not reproduced by our model. These might either stem from the iron group but then, they are not in the LIN lists or their wavelengths are uncertain and they appear at a wrong wavelength, or they are of interstellar origin (in case of Å, Fe ii is a good candidate for an identification). Rauch et al. (2007) did show that a simultaneous fit of both, stellar spectrum as well as interstellar line spectrum, allows to identify isolated, unblended stellar lines and to improve both, the ISM model as well as the photospheric model. In the further course of our EC 114812303 analysis, we will include the interstellar lines in our modeling.
5 Results and conclusions
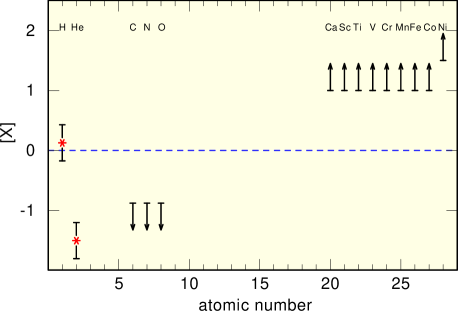
The optical and UV observation of EC 114812303 are reproduced by our TMAP models with = K, = , [H] = 0.127, [He] = 1.405, [C] 0.875, [N] 0.875, [O] 0.875, and [IG] 1. C, N, and O abundances are upper limits only, determined from the optical spectrum. Our calculations show that Ni is probably as abundant as Fe. The error in the H and He abundances is about 0.3 dex.
Our suggestion is that the photospheric abundances of EC 114812303 (Fig. 11) display the interplay of gravitational settling and radiative levitation. The latter is responsible for the strong iron-group over-abundance.
EC 114812303 and other sdOB and sdB stars with such a high iron-group abundance (UVO 051208, PG 0909+276, and UVO 1758+36, Edelmann, 2003) should be subjects to detailed diffusion calculations.
There are still deviations between the synthetic spectrum and observations (Fig. 6, ). Most likely, these are due to our assumption of a solar abundance pattern within our representation of Ca – Ni by one generic model atom. A detailed spectral analysis with individual model atoms for all iron-group elements is still on-going. Within the framework of this analysis, a precise determination of the reddening (including infrared measurements like e.g. 2MASS) and the interstellar line absorption will be performed.
The extension of Kurucz’s data files is highly desirable because we are strongly hampered in the spectral analysis of hot stars by the lack of reliable atomic data of the expected high ionization stages. This is a challenge for the near future.
Acknowledgements T.R. is supported by the German Aerospace Center (DLR) under grant 05 OR 0806. J.W.K. is supported by the FUSE project, funded by NASA contract NAS532985. This research has made use of the SIMBAD Astronomical Database, operated at CDS, Strasbourg, France.
References
- Asplund et al. (2005)) Asplund, M., Grevesse, N., & Sauval, A. J. 2005, in: Cosmic Abundances as Records of Stellar Evolution and Nucleosynthesis, eds. T. G. Barnes III, F. N. Bash, The ASP Conference Series Vol. 336, p. 25
- Bergeron et al. (1993) Bergeron, P., Wesemael, F., Lamontagne, R., & Chayer, P. 1993, Astrophys. J. 407, L85
- Charpinet et al. (1996) Charpinet, P., Fontaine, G., Brassard, P., & Dorman, B. 1996, Astrophys. J. 471, L103
- Edelmann (2003) Edelmann, H. 2003, PhD thesis, University Erlangen-Nürnberg
- Fitzpatrick (1999) Fitzpatrick, E. L. 1999, Publ. Astron. Soc. Pac. 111, 63
- Kilkenny et al. (1997) Kilkenny, D., O’Donoghue, D., Koen, C., Stobie, R. S., & Chen, A. 1997, Mon. Not. R. Astron. Soc. 287, 867
- Kurucz (1997) Kurucz, R. L. 1997, IAU Symp., No. 189, p. 217
- Kurucz (2009) Kurucz, R. L. 2009, in: Recent Directions in Astrophysical Quantitative Spectroscopy and Radiation Hydrodynamics, eds. I. Hubeny, J. M. Stone, K. MacGregor, & K. Werner, AIP Conference Proc., 1171, 43
- Lemke (1997) Lemke, M. 1997, Astron. Astrophys. Suppl. Ser. 122, 285
- McCook & Sion (1999) McCook, G. P., & Sion, E. M. 1999, Astrophys. J. Suppl. Ser. 121, 1
- Napiwotzki et al. (2001) Napiwotzki, R., Christlieb, N., Drechsel, H., et al. 2001, AN, 322, 411
- O’Donoghue et al. (1999) O’Donoghue, D., Koen, C., Kilkenny, D., & Stobie, R. S. 1999, in: White Dwarfs, eds. J.-E. Solheim & E.G. Meitas, ASP Conf. Series, 169, 149
- Rauch & Deetjen (2003) Rauch, T., & Deetjen, J. L. 2003, in: Stellar Atmosphere Modeling, eds. I. Hubeny, D. Mihalas, & K. Werner, The ASP Conference Series Vol. 288 (San Francisco ASP), p. 103
- Rauch et al. (2007) Rauch, T., Ziegler, M., Werner, et al. 2007, Astron. Astrophys. 470, 317
- Repolust et al. (2005) Repolust, T., Puls, J., Hanson, M. M., Kudritzki, R.-P., & Mokiem, M. R. 2005, Astron. Astrophys. 440, 261
- Stys et al. (2000) Stys, D., Slevinsk, R., Sion, E. M., et al. 2000, Publ. Astron. Soc. Pac. 112, 354
- Tremblay & Bergeron (2009) Tremblay, P.-E., & Bergeron, P. 2009, Astrophys. J. 696, 1755
- Werner (1996) Werner, K 1996, Astrophys. J. 457, L39
- Werner et al. (2003) Werner, K., Dreizler, S., Deetjen, J. L., et al. 2003, in: Stellar Atmosphere Modeling, eds. I. Hubeny, D. Mihalas, & K. Werner, The ASP Conference Series Vol. 288 (San Francisco ASP), p. 31