Max-Planck-Institut für Kernphysik, PO Box 103980, 69029 Heidelberg, Germany
11email: peter.eger@physik.uni-erlangen.de
Chandra detection of diffuse X-ray emission from the globular cluster Terzan 5
Abstract
Aims. Terzan 5, a globular cluster (GC) prominent in mass and population of compact objects, is searched for diffuse X-ray emission, as proposed by several models.
Methods. We analyzed the data of an archival Chandra observation of Terzan 5 to search for extended diffuse X-ray emission outside the half-mass radius of the GC. We removed detected point sources from the data to extract spectra from diffuse regions around Terzan 5. The Galactic background emission was modeled by a 2-temperature thermal component, which is typical for Galactic diffuse emission.
Results. We detected significant diffuse excess emission above the particle background level from the whole field-of-view. The surface brightness appears to be peaked at the GC center and decreases smoothly outwards. After the subtraction of particle and Galactic background, the excess spectrum of the diffuse emission between the half-mass radius and 3’ can be described by a power-law model with photon index = 0.90.5 and a surface flux of Fx = (1.170.16) erg cm-2 s-1 sr-1 in the 1–7 keV band. We estimated the contribution from unresolved point sources to the observed excess to be negligible. The observations suggest that a purely thermal origin of the emission is less likely than a non-thermal scenario. However, from simple modeling we cannot identify a clearly preferred scenario.
Key Words.:
globular clusters: individual: Terzan 5 - Radiation mechanisms: non-thermal - Acceleration of particles - X-rays: ISM1 Introduction
Terzan 5 (stellar luminosity Lstar=1.5105L⊙, 1996AJ....112.1487H) is the Galactic globular cluster (GC) with the largest population of known millisecond pulsars (33 MSPs, 2008IAUS..246..291R). Furthermore, a high production rate for low-mass X-ray binaries (LMXBs) is expected in the extremely dense core of Terzan 5 (2005ASPC..328..231I). The GC is located at a distance of 5.5 kpc (2007A&A...470.1043O) or 8.7 kpc (2002ApJ...571..818C), only 1.7 deg above the Galactic plane (R.A.: 17h48m040, Dec.: -24∘46’45”). Its core (rc) and half-mass radii (rh) are 0.18’ and 0.83’, respectively (1996AJ....112.1487H).
GCs are expected to contain intracluster gas originating from the mass loss of evolved stars. Since GCs move through the Galactic halo medium with typical velocities of 200 km s-1, bow shocks should form in front of them in the direction of their proper motion (1995ApJ...451..200K). These shocks have the ability to both accelerate particles and heat the gas behind them. In this scenario, electrons accelerated at the bow shock could produce diffuse non-thermal X-ray emission because of either inverse Compton (IC) scattering on ambient photon fields (1995ApJ...451..200K) or non-thermal bremsstrahlung resulting from the deflection of the electrons by inter-stellar medium (ISM) nuclei (2007PASJ...59..727O, henceforth Ok07). Also, diffuse thermal X-ray emission can be emitted from shock-heated material trailing behind the moving GC. For a detailed discussion of the bow-shock scenario, see Ok07.
The first unresolved diffuse X-ray emission from GCs (47 Tuc, Cen, and M 22) was reported by 1982ApJ...254L..11H using the Einstein observatory, which was later confirmed by 1995ApJ...451..200K with ROSAT. Recently, using Chandra data, Ok07 detected significant diffuse X-ray emission from the GCs 47 Tuc, NGC 6752, M 5, and Cen. They find that the diffuse source at the position of Cen is likely to be a background cluster of galaxies. A similar extra-Galactic nature is proposed for 47 Tuc by 2009arXiv0906.3583Y. The remaining potentially GC-associated diffuse X-ray emission, from M 5 and NGC 6752, could arise from different scenarios. The emission in M 5 features an arclike morphology and exhibits a thermal spectrum (kT0.1 keV), possibly from shock-heated gas. The clumpy structure seen near NGC 6752 presents a hard non-thermal spectrum ( 2) and a radio counterpart, maybe from non-thermal bremsstrahlung emission by shock-accelerated electrons hitting nearby gas clouds.
Non-thermal emission in the X-ray band may also be associated with compact objects, either directly, as detected from isolated low-mass X-ray binary systems (see for instance 2005ApJ...618..883W, for such a candidate system in Terzan 5), or as secondary emission from the population of high-energy particles they would generate. This was modeled for millisecond pulsars by 2008AIPC.1085..277V for the synchrotron radiation mechanism. The second case may translate into larger physical scales, due to the diffusion of the energetic particles away from their source. The populations of compact objects in Terzan 5 may provide an opportunity to test these scenarios. Apparent, extended X-ray emission from the direction of GCs might also arise from a population of faint unresolved point-like sources below the detection limit of the observing instrument.
In this work we analyzed an archival Chandra observation to search for a diffuse emission component above the Galactic background associated with Terzan 5. We characterized the X-ray signal using spatially resolved spectral analyses, after a careful study of the diffuse Galactic background, and briefly discuss different scenarios for the emission.
2 X-ray analysis and results
2.1 Observation and data preparation
To search for extended diffuse X-ray emission from Terzan 5, we analyzed the Advanced CCD Imaging Spectrometer (ACIS, 2003SPIE.4851...28G) data of an archival 40 ks Chandra (2002PASP..114....1W) observation (ObsID 3798), which was originally performed to characterize the faint X-ray point-source population of this GC (2006ApJ...651.1098H, henceforth H06). Only the ACIS-S3 chip was switched on, so we were only able to search for diffuse X-ray emission at angular distances 4’ from the cluster core. A comprehensive study of diffuse X-ray emission seen from a number of Galactic GCs was performed by Ok07. However, these authors excluded Terzan 5 from their work because the only available Chandra dataset at that time suffered from serious pile-up effects because of a bright binary outburst in the field-of-view (FoV). In this paper we analyzed data from a newer observation where such an event did not occur.
For the X-ray analysis we used the CIAO software version 4.1, supported by tools from the FTOOLS package and XSPEC version 12.5.0 for spectral modeling (1996ASPC..101...17A). The event1 data were reprocessed with the latest position and energy calibration (CTI correction, v4.1.3) using bad pixel files generated by acis_run_hotpix. The good-time-interval (GTI) file supplied by the standard processing, which was used by H06, screens out a 4.0 ks interval of strong background flaring at the end of the observation. To remove an additional time period of 4.3 ks with a slightly increased background level, we used the light curve in the 0.5–7.0 keV energy band after the core region of the cluster and additional bright sources were removed from the data. A screening threshold of 1.0 cts/s yielded a net exposure of 31.0 ks. We chose these stricter criteria with respect to H06 because understanding the background is crucial for analyzing faint extended sources.
2.2 Extraction regions
To detect and remove point-like X-ray sources from the event-list, we ran wavdetect on the GTI-screened dataset in three energy bands (0.5–2.0 keV, 2.0–7.0 keV and 0.5–7.0 keV). H06 used pwdetect for the detection within rh and wavdetect for outer regions. In this paper we only analyzed areas outside rh, so results should be comparable. We estimated a point-source detection limit of 2 erg cm-2 s-1 in the 0.5–7.0 keV band. For the most part our results are compatible with the sources listed by H06, Table 2. However, the shorter exposure time compared to the analysis of H06 led to a higher point-source detection threshold. Therefore we did not detect the faintest seven sources from H06 that we introduced manually into our source list. Sources were removed from the dataset using the 3 radius of the point spread function. Additionally, all events within rh were disregarded.
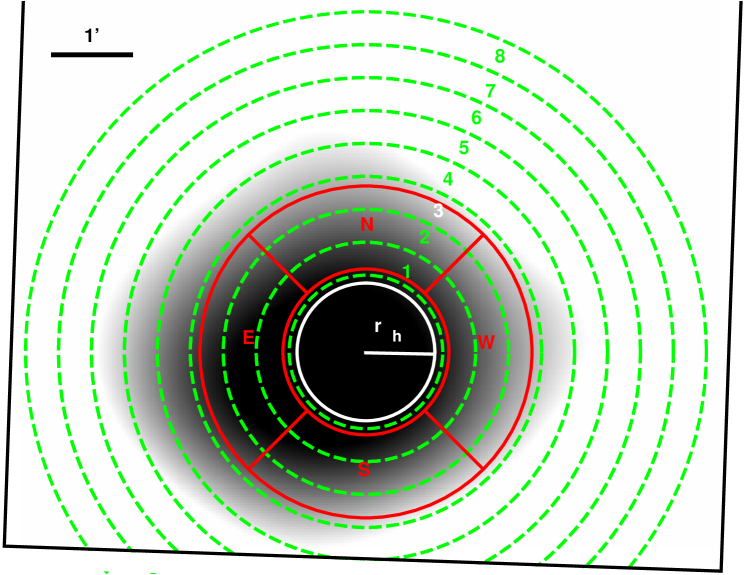
To measure the level of diffuse X-ray emission around Terzan 5, we extracted spectra from eight concentric annular regions centered on the cluster core with radii from 1.1’ to 3.9’ (Fig. 1). Each ring has a width of 0.4’. We chose rings with equal width over rings with constant area to have comparable statistical quality in the spectra since the surface brightness decreases with distance from the GC. For the spectral analysis, we chose the 1–7 keV energy band. Widening the band in either direction lead to lower signal-to-noise ratios. At lower energies an increased contribution to the signal from soft thermal Galactic diffuse emission is expected. At energies above 7–8 keV the charged particle induced background component increases significantly for instruments onboard Chandra. The mean effective area and energy response for each spectrum was calculated by weighting the contribution from each pixel by its flux using a detector map in the same energy band. To subtract the particle induced non-X-ray background (NXB), we used a background dataset provided by the calibration database, where the detector was operated in stowed position. The background spectrum for each ring was extracted from the respective region in this background dataset. To account for the time dependence of the NXB, we scaled the background by the ratio of the source and background count rates in the 9–12 keV energy band for each spectrum (as described by 2003ApJ...583...70M).
To produce an image of diffuse X-ray emission above the particle background from the direction of Terzan 5, we extracted counts in the 1–7 keV energy band and refilled the excluded source regions and the region inside rh with dmfilth using the photon distributions from rings around the excluded areas. We subtracted the particle background using the respective image from the stowed dataset after correction for the different exposures. The resulting image was corrected for relative exposure and adaptively smoothed with asmooth. We required a minimum significance of 3 for the kernel size of the smoothing algorithm. The resulting smoothing radii were a few arcminutes, so that no details smaller than that scale can be seen in the smoothed image. Figure 1 shows the resulting image together with all extraction regions that we used in this work.
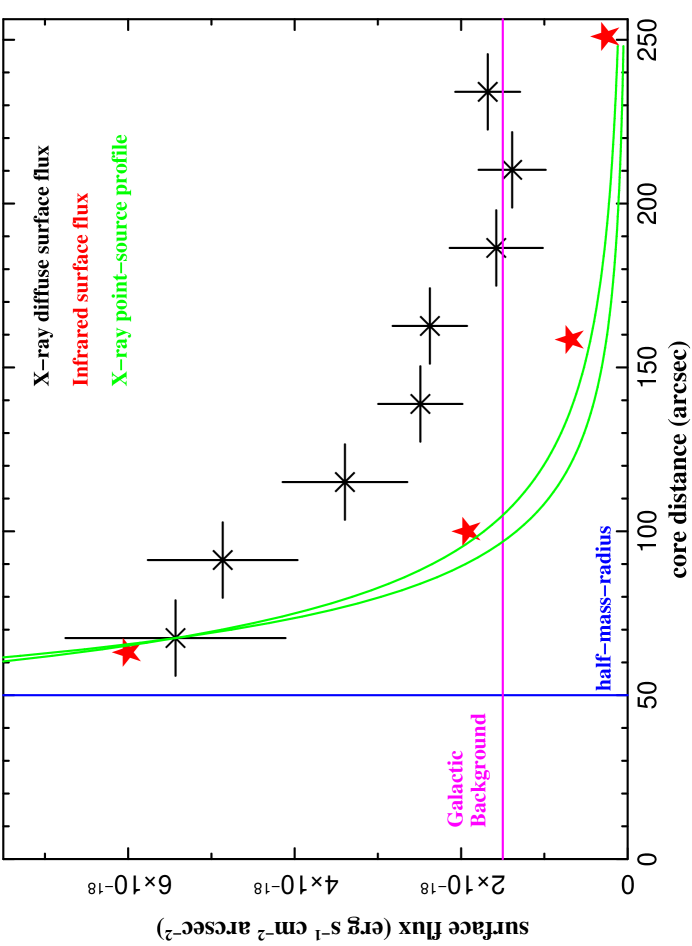
Even though a significant contribution from thermal Galactic diffuse emission is expected, the spectra from the single rings were fit well enough by an absorbed power-law model for a preliminary flux estimate. The resulting fit parameters are given in Table 1. We found significant diffuse excess emission above the particle background in all rings and derived the surface brightness for each region by dividing the model flux by the effective extraction area, which is the geometric ring area inside the FoV minus excluded regions and bad pixels. Due to limited statistics, we fixed the column density at a default value of NH = 1 cm-2. Therefore, we list the observed surface fluxes in Table 1, as opposed to the intrinsic fluxes we provide for all other spectra. The diffuse surface flux shows a clear radial dependence (Fig. 2), which indicates that a significant part of the excess is connected to the cluster. At distances greater than 170” from the GC core, the observed surface flux seems to reach a base level of Fx,surf 1.5 erg cm-2 s-1arcsec-2 (1–7 keV). In the following section we derive the unabsorbed surface flux for the outer region by applying a more realistic physical model.
2.3 Galactic diffuse background
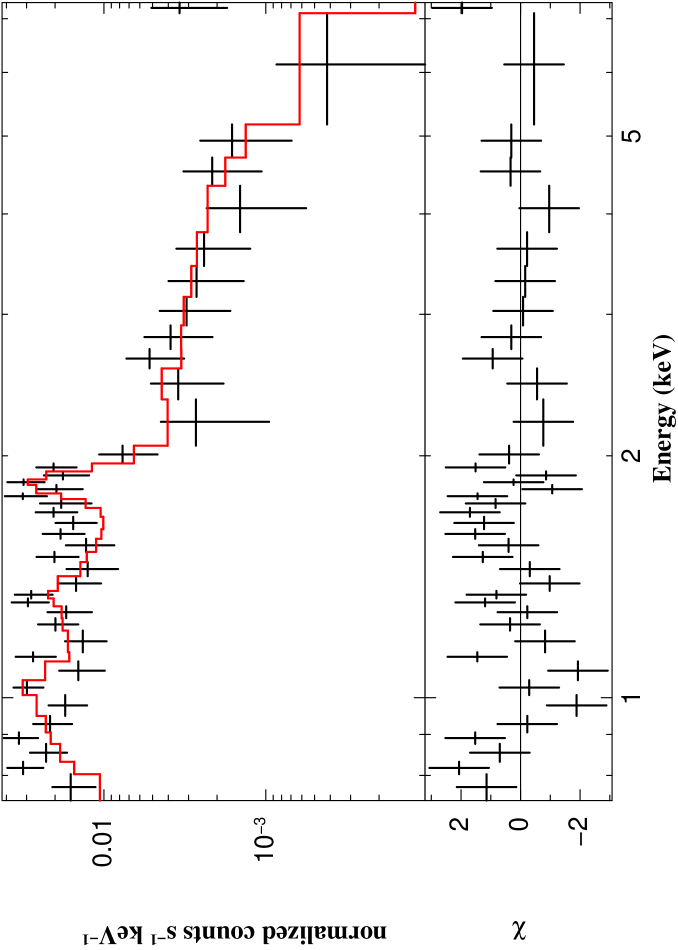
Terzan 5 is close to the Galactic plane where diffuse Galactic emission becomes an important component. However, the Chandra blank-sky datasets are composed of observations towards high Galactic latitudes, which would underestimate the sky background in our case. To test whether the spectrum observed from the outer three rings is compatible with thermal Galactic diffuse emission, we used a more physically reasonable model. Similar to 1997ApJ...491..638K and 2005ApJ...635..214E, who modeled the diffuse Galactic ridge emission as observed with ASCA and Chandra, respectively, we describe the Galactic diffuse component using a two-temperature (2-T) non-equilibrium ionization model (NEI) (1984Ap&SS..98..367M). To improve the statistical quality, we combined the outer three (175–246”) rings into a single spectrum. The spectrum was adaptively binned to a minimum of 20 excess counts per bin. As background we again used the spectrum extracted from the same region in the NXB dataset. We fitted a 2-T NEI model to the outer spectrum, freezing most of the parameters to the best-fit values from Table 8 in 2005ApJ...635..214E. We left the surface brightnesses of the two components and the NH free to vary to account for the difference in flux and column density between the region around Terzan 5 and the area observed by 2005ApJ...635..214E. In addition, we allowed the Si-abundance of the soft component as a free fit-parameter, because the low-ionized Si line at 1.8 keV (1997ApJ...491..638K; 2005ApJ...635..214E) was otherwise underestimated.
The spectrum of the outer region together with the model fit is shown in Fig. 3 (Top). To be able to compare our results to the analysis of 2005ApJ...635..214E, we chose an energy range of 0.7–10 keV in this specific case. The best-fit values are given in Table 1 (Outer region). The total intrinsic surface flux of the two components is a factor of three lower than the value for the Galactic region observed by 2005ApJ...635..214E. This relation is in good agreement with the ratio between the column densities for both regions, which is 4 (1990ARAA...28..215D). Assuming that the Galactic column density seen from a certain direction is directly related to the expected flux from a diffuse Galactic component, we conclude that at least 3/4 of the total excess above particle background observed from the outer region comes from Galactic diffuse emission.
| Region | Distance range(1) | Angular range(2) | Excess counts(3) | NEI: Fx,surf(4) | NEI: kT(5) | PL: Fx,surf(6) | PL: | (d.o.f.) |
| (arcsec) | (deg) | ( erg cm-2 s-1 sr-1) | (keV) | ( erg cm-2 s-1 sr-1) | ||||
| Ring 1 | 55–79 | 0–360 | 195.226.5 | – | – | 1.010.25 | 1.80.4 | –/1.3(15) |
| Ring 2 | 79–103 | 0–360 | 278.631.1 | – | – | 0.910.17 | 2.10.5 | –/0.7(26) |
| Ring 3 | 103–126 | 0–360 | 274.833.3 | – | – | 0.640.14 | 2.20.6 | –/1.2(27) |
| Ring 4 | 126–150 | 0–360 | 259.934.2 | – | – | 0.470.09 | 3.00.8 | –/0.9(24) |
| Ring 5 | 150–174 | 0–360 | 276.735.3 | – | – | 0.440.08 | 2.90.7 | –/1.4(26) |
| Ring 6 | 174–198 | 0–360 | 192.734.7 | – | – | 0.300.10 | 2.80.8 | –/0.9(19) |
| Ring 7 | 198–222 | 0–360 | 227.536.2 | – | – | 0.260.08 | 3.61.2 | –/1.2(22) |
| Ring 8 | 222–246 | 0–360 | 240.337.5 | – | – | 0.310.07 | 3.51.2 | –/1.0(23) |
| Inner | 55–174 | 0–360 | 1273.5115.8 | 1.340.14 (soft) | 0.59 (soft) | 1.170.16 | 0.90.5 | 1.1(52)/ |
| 0–360 | 5.360.80 (hard) | 5.0 (hard) | – | – | 1.3(50) | |||
| Outer | 175–246 | 0–360 | 825.362.5 | 0.580.19 (soft) | 0.59 (soft) | – | – | 1.2(36)/– |
| 0–360 | 2.10.7 (hard) | 5.0 (hard) | – | – | ||||
| North | 60–120 | 45–135 | 191.026.4 | – | – | 1.440.63 | 1.51.0 | –/1.0(45) |
| East | 60–120 | 135–225 | 176.126.7 | – | – | 2.100.70 | 0.60.7 | –/0.9(44) |
| South | 60–120 | 225–315 | 230.127.0 | – | – | 2.460.72 | 0.80.7 | –/0.8(47) |
| West | 60–120 | 315–45 | 165.227.1 | – | – | 2.100.75 | 1.71.1 | –/1.0(45) |
(1)Inner and outer radii of the region. (2)Angular range of the region. (3)Excess counts after background subtraction. (4)Intrinsic 0.7–10.0 keV surface flux of the two thermal components. (5)Temperatures of the two thermal components. (6)Surface flux (1–7 keV) resulting from an absorbed power-law fit. (7)Spectral index resulting from an absorbed power-law fit.
2.4 Diffuse excess emission connected to Terzan 5
In this section we focus on the diffuse emission observed from the inner five rings (55–175”). In addition to the radial dependence of the diffuse excess emission, Fig. 2 shows the infrared surface brightness profile (1995AJ....109..218T) and the X-ray point-source distribution (King-profile from 2006ApJ...651.1098H). Both profiles are scaled to match the first diffuse X-ray data point, using an exponential fit in the case of the infrared data.
To investigate the nature of the diffuse excess emission observed from the inner region in more detail and to improve the statistical quality, we extracted the combined spectrum from the inner five rings (55–175”). As a first step we fitted the same 2-T NEI model to the NXB subtracted inner spectrum, binned to a minimum of 20 excess counts per bin, as was done for the outer region in the previous section. The resulting surface fluxes of the two components are listed in Table 1 (Inner region). Following the same argument as in the previous section, we estimate that in this case only 1/3 of the total observed emission is of diffuse Galactic origin. Together with the surface brightness showing a clear radial dependence with respect to the core of Terzan 5, we conclude that a significant part of the observed flux is connected to the GC.
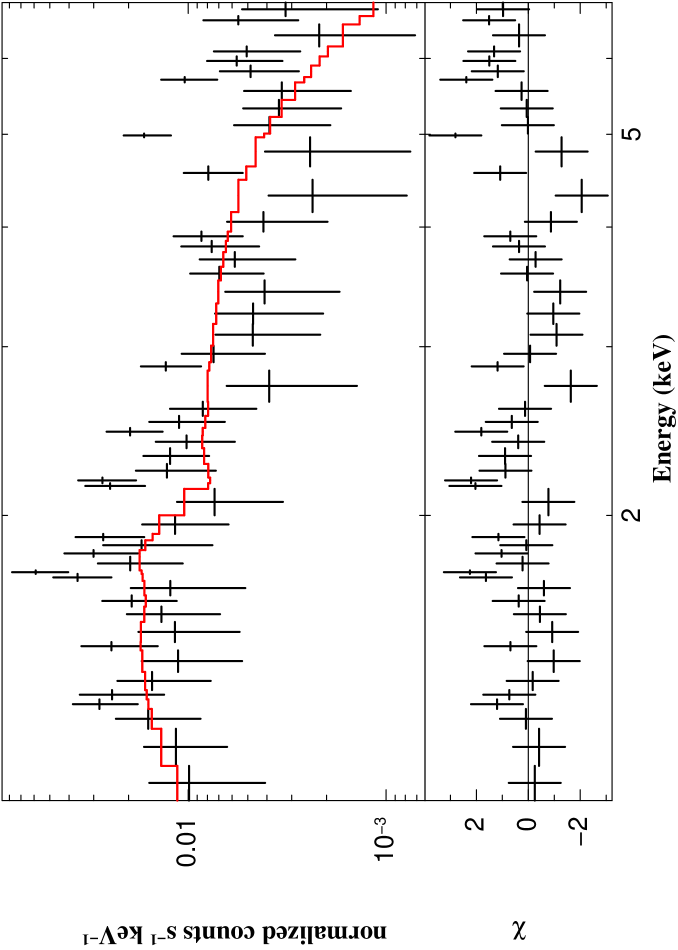
As an estimate for the Galactic diffuse background component, we subtracted the outer (175–246”, see previous section) from the inner spectrum. Figure 3 (Bottom) shows the resulting excess spectrum from the inner region, binned to a minimum of 20 excess counts per bin, together with an absorbed power-law model fit. The spectral parameters are collected in Table 1 (Inner region). Fitting a thermal plasma (MEKAL, = 1.4(50)) or a thermal bremsstrahlung model (BREMSS, = 1.4(50)) to the spectrum gave temperatures kT17 keV and kT25 keV, respectively. The most prominent feature of the Galactic thermal emission observed from the outer region is an emission line, centered on 1.8 keV. Introducing a Gaussian line at that energy or an additional thermal component to the excess spectrum from the inner annulus does not significantly improve the fit ( = 1.2). Therefore, we conclude that the spectrum from the outer region describes the Galactic diffuse background component sufficiently. The total unabsorbed diffuse excess flux in the 1–7 keV band measured from the inner region above the Galactic background is FX = (5.50.8) erg cm-2 s-1. Assuming a distance of 5.5 kpc the intrinsic luminosity is LX = (2.00.3) erg s-1.
We found no indication of a variation in the spectral index with increasing radius, when subdividing the inner region into two or more sub-regions. Furthermore, there is no evidence of a directional variation in the index and flux. Table 1 (north, east, south, and west regions) illustrates the result for directional dependence of spectra extracted from pie-shaped regions towards the north, east, south and west with respect to the cluster center (Fig. 1). Their inner and outer radii are 60” and 120”, respectively. The latter value was chosen such that the southern region is not truncated by the FoV. As background we again used the spectrum from the outer annulus. A similar result was achieved when the regions were rotated by 45 degrees.
3 Origin of the diffuse emission
The present results indicate GC-centered diffuse hard X-ray excess emission above Galactic background, which extends significantly beyond rh. In this section we briefly discuss standard thermal and non-thermal emission scenarios, leaving out more exotic possibilities, as described by, e.g., 2005A&A...444L..33D. Throughout this section we use a distance to Terzan 5 of 5.5 kpc. The larger distance estimate (8.7 kpc) would increase the energy requirements for the models by a factor of 2.5.
3.1 Contribution from unresolved point sources
The luminosity of unresolved point sources inside rh has been estimated by 2006ApJ...651.1098H to 8 erg s-1. They furthermore determined the spatial surface distribution of X-ray sources in Terzan 5 to with q=1.43. From this distribution we expect to find in the 1–3 arcmin annulus only 9% of the luminosity of unresolved point sources within rh. The expected 7 erg s-1 is much lower than the measured emission (2.00.3) erg s-1, so we conclude that the contribution from unresolved point sources is negligible.
3.2 Synchrotron radiation
One possibility for producing non-thermal emission by relativistic electrons is synchrotron radiation emission (SR), which would radiate at a frequency = sin MHz, where B is the strength of the magnetic field, the Lorentz factor of the electrons, and the pitch angle between the magnetic field and the electron velocity (Ok07). Following Ok07, electrons with an energy of 1014 eV would be needed to produce SR emission in typical Galactic magnetic fields of a few G in the keV regime. The population of MSPs in the center of Terzan 5 was suggested as a continuous source of such highly-energetic electrons (2007MNRAS.377..920B; 2009ApJ...696L..52V). These particles propagate to the observed extension of the diffuse emission of 3’ (4.8 pc) on a timescale of tdiff= years, assuming Bohm diffusion (VJ08). The cooling of electrons with energies of eV in GCs is dominated by SR emission with typical cooling times of t3 years (VJ08). Assuming an injection spectrum with index -1, SR cooling, which depends linearly on the energy of the electrons, should change the index to -2. Since no such steepening of the spectrum is observed at the 2 level, tdiff tcool is required, which would limit the magnetic field to 1 G or it would indicate a faster diffusion of electrons. In this scenario, the population of highly energetic electrons has to radiate the observed X-ray luminosity (2 erg s-1) on a timescale of tcool, so would require a total energy in these electrons of 1.8 10 erg. Associated IC radiation in the TeV energy range should be detectable in spatial coincidence in the case of low magnetic fields few G, providing a test for this scenario (VJ08).
3.3 Inverse Compton emission
Non-thermal X-ray emission in GCs can also be produced by IC up-scattering of star-light photons by mildly relativistic electrons (1995ApJ...451..200K). The bow shock of the GC could provide these electrons (Ok07). The power of IC radiation emitted by a single electron is given by , where is the Thomson cross section, is the speed of light, the energy of the electrons, and the density of the target photon field (1995ApJ...451..200K). Therefore the intensity of IC emission is directly related to the energy density of the target photon field. GCs exhibit a very high stellar density in their core region, which decreases rapidly in their outskirts, resulting in a centrally peaked photon field as indicated with the distribution of the infrared surface brightness in Fig. 2. The diffuse X-ray emission presented in this paper exhibits a surface brightness profile that is roughly similar to this proxy of the density of the photon field, consistent with IC emission. The energy density of the stellar photon field scaling with /(4r2c) is about 40 eV/cm3 and 5 eV/cm3, at distances of 1’ and 3’, respectively, from the center of the GC. For the quantitative estimate of the total energy in electrons we adopt the model of 1995ApJ...451..200K giving 5 1049 (/ 40 eV cm-3) erg. In this scenario the X-ray emission should be accompanied by potentially detectable SR emission in the radio band.
3.4 Non-thermal bremsstrahlung
One additional emission process of non-thermal X-rays is non-thermal bremsstrahlung, which is produced when energetic electrons are deflected by protons and nuclei. In this scenario the flux of the emission should follow the distribution of target material. The Galactic density profile of ISM perpendicular to the Galactic plane at the relevant galactocentric distances of 1–3 kpc was constrained as a single Gaussian with a full width at half maximum of less than 200 pc and virtually no gas above 400 pc (1984ApJ...283...90L). At a distance of 5.5 kpc, Terzan 5 would be at an offset above the disk of 160 pc and thus in an ambient gas density of a few times 0.1 cm-3. The total energy in non-thermal electrons required for the emission of 2 erg s-1 of diffuse X-ray emission would be about 91049(nH/0.1 cm-3) erg if an electron energy of 20 keV is assumed (Ok07). In contrast to the asymmetric morphology detected by Ok07 for GCs in a bow-shock scenario, we did not find evidence of a non-uniform shape of the excess emission from Terzan 5. This scenario could be tested by the presence of target material in the environment of the GC. Target material in the form of molecular clouds could be probed by carefully examining molecular emission lines that are shifted by the relative Galactic rotation velocity at the physical location of Terzan 5.
3.5 Thermal contribution
The very high fitted temperature ( 15 keV) of the diffuse X-ray emission would suggest a non-thermal origin. However, at least a thermal contribution to the total excess cannot be excluded at this point. If thermal bremsstrahlung is presumed as the emission mechanism, the temperature of the plasma can be estimated from the X-ray luminosity, the volume of the emission region, and the density of the plasma (1995ApJ...451..200K). With the radius of the emission region set to 5 pc (which corresponds to 188” at a distance of 5.5 kpc), this leads to
Assuming that the observed emission is entirely thermal, i.e., = , provides an upper bound for the temperature of the plasma. It appears that this upper bound strongly depends on the plasma density. For a typical density at the GC position of 0.1 cm-3 (see Sect. 3.4), the upper bound on the temperature is about K ( 1 keV). Only for densities lower than 0.05 cm-3 can the temperature exceed 15 keV.
To heat plasma to such high temperatures, strong shocks would be indispensable. The remnants of catastrophic events may release such strong shocks (see, e.g., 2007A&A...475..883A for a remnant of a supernova Ia and 2005A&A...444L..33D for remnants of compact binary mergers). It was proposed that Terzan 5 may host the required mergers; e.g., 2002ApJ...571..830S for white dwarf mergers and 2006NatPh...2..116G for neutron star – neutron star mergers. However, even supernova remnants may have difficulty producing such high temperatures, because even the hot, thermal plasma in the young remnant of the type Ia supernova remnant SN 1006 reaches a temperature of about 2 keV (e.g. 2007A&A...475..883A), significantly cooler than the temperature found for the thermal fit to the diffuse emission in Terzan 5.
If the diffuse X-ray emission is indeed thermal, it could also originate in principle from a background galaxy cluster that by chance coincides with the core of Terzan 5. Since galaxy clusters with temperatures 10 keV are very rare (e.g. 2002ApJ...567..716R), such a correlation appears rather unlikely.
From the available data, a contribution from thermal emission processes to the measured flux cannot be ruled out, but it is not likely to represent the dominant fraction.
4 Conclusions
We discovered diffuse hard X-ray emission from the GC Terzan 5 with a photon index of about 1 and a peak flux density profile centered on the cluster core. The hard photon index makes a purely thermal emission scenario unlikely. Energetics would favor an SR scenario as the origin of the emission and would challenge simple IC and non-thermal Bremsstrahlung models generated by electrons accelerated by the bow shock of the GC. However, no simple model is clearly preferred to explain the observed emission, as expected from the limited statistics provided by the available X-ray dataset. Additional X-ray observations, detailed multi-wavelength informations, as well as refined modeling are needed to accurately interpret the unique properties of the diffuse X-ray radiation in Terzan 5.