Is Dust Forming on the Red Giant Branch in 47 Tuc?
Abstract
Using Spitzer IRAC observations from the SAGE-SMC Legacy program and archived Spitzer IRAC data, we investigate dust production in 47 Tuc, a nearby massive Galactic globular cluster. A previous study detected infrared excess, indicative of circumstellar dust, in a large population of stars in 47 Tuc, spanning the entire Red Giant Branch (RGB). We show that those results suffered from effects caused by stellar blending and imaging artifacts and that it is likely that no stars below 1 mag from the tip of the RGB are producing dust. The only stars that appear to harbor dust are variable stars, which are also the coolest and most luminous stars in the cluster.
Subject headings:
circumstellar matter — globular clusters: individual (47 Tuc) — infrared: stars — stars: AGB and post-AGB — stars: mass-loss — stars: winds, outflows1. INTRODUCTION
Stellar mass loss is critical to the late stages of stellar evolution. Mass loss in Red Giant Branch (RGB) stars determines cluster Horizontal Branch (HB) morphology (e.g., Rood, 1973; Catelan, 2000) and the pulsational properties of RR Lyrae variables (e.g., Christy, 1966; Caloi & D’Antona, 2008). Strong mass loss on the Asymptotic Giant Branch (AGB) can exceed the nuclear consumption rate, determining the timescale of subsequent evolution (e.g., van Loon et al., 1999; Boyer et al., 2009b). AGB winds are enriched due to a convective process that brings processed material to the stellar surface (the third dredge-up; e.g., Renzini & Voli, 1981), making AGB stars a major source of galaxy enrichment (Gehrz, 1989). In the low-mass stars of old globular clusters (GCs; ), more mass is lost on the RGB than the AGB (cf. McDonald et al., 2009).
Mass loss can arise from acoustic and/or electro-magnetic chromospheric activity (Hartmann & MacGregor, 1980; Hartmann & Avrett, 1984; van Loon et al., 2010), or from pulsationally-enhanced, dust-driven winds (e.g., Bowen, 1988; van Loon et al., 2008). Radial pulsations levitate material to radii where the stellar atmosphere is cool, and pulsational shocks provide the density required for dust condensation. Radiation pressure on the grains and dust-gas momentum coupling drive the wind. However, it is uncertain whether the dust is the driving mechanism or is simply formed as a byproduct of the wind (van Loon et al., 2005; Ferrarotti & Gail, 2006; Höfner & Andersen, 2007; Höfner, 2008).
With the launch of the Spitzer Space Telescope (Werner et al., 2004), circumstellar dust has become easily detectable, leading to a more complete picture of dust-driven mass loss: (1) dust forms only at or above the tip of the RGB (TRGB) (e.g., Boyer et al., 2008, 2009a); (2) dust formation is not inhibited at low metallicity (e.g., Boyer et al., 2006, 2009b; Sloan et al., 2009); and (3) dust formation appears episodic, possibly tied to the pulsation cycle (e.g., Origlia et al., 2002; McDonald et al., 2009). The first of these points has been more controversial. Kalirai et al. (2007) speculate that strong mass loss in RGB stars might explain the presence of He white dwarfs in NGC 6791, although van Loon et al. (2008) find that, along with an absence of dust, the RGB and HB luminosity function is not depleted. Origlia et al. (2007) find 93 stars with infrared (IR) excess as faint as the HB in 47 Tuc, and Boyer et al. (2006) find 12 such sources in M15 (see their Fig. 3b). The presence of dusty stars so far down the RGB is surprising given low luminosities, warm photospheres, and a lack of pulsation. Indeed, more recent Spitzer observations show very few dusty stars in NGC 362 (Boyer et al., 2009a) and Cen (Boyer et al., 2008; McDonald et al., 2009).
This letter examines dust production in 47 Tuc, which is among the most massive ( mag111The Harris (1996) catalog was updated in 2003: http://www.physics.mcmaster.ca/harris/mwgc.dat; Harris, 1996), metal-rich (; Thompson et al., 2009) and nearby GCs (; Ferraro et al., 1999). We present new Spitzer observations along with a re-analysis of the Origlia et al. (2007) data. We discuss how stellar blending affects the low-resolution 8 µm photometry and find that there is little, if any, dust below the TRGB in 47 Tuc.
2. Data and Analysis
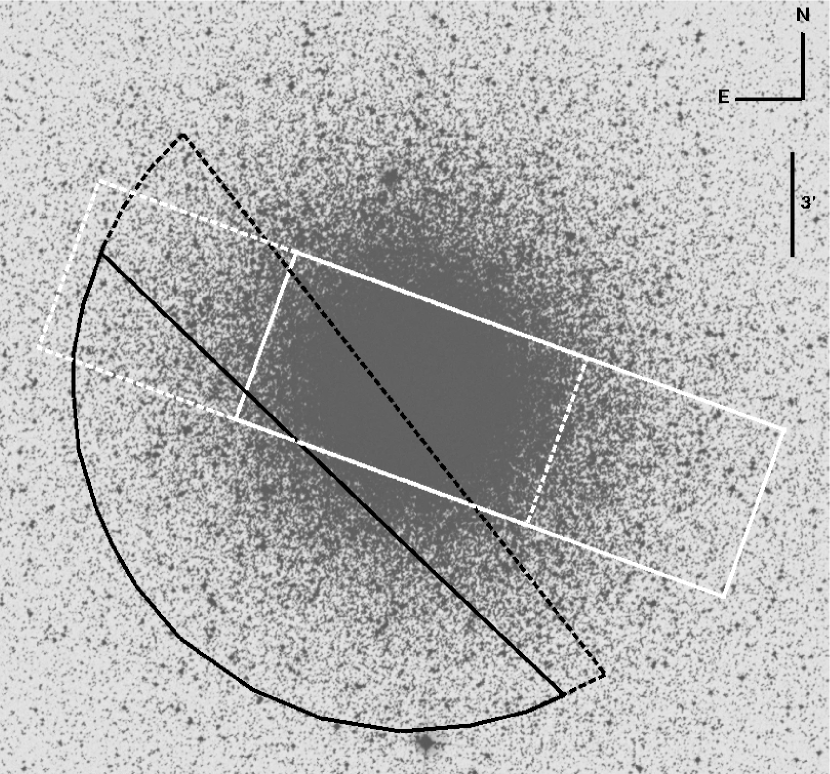
The small separation (2°) between 47 Tuc and the Small Magellanic Cloud (SMC) resulted in serendipitous Spitzer observations of the south-eastern half of 47 Tuc (Fig. 1) as part of the Spitzer Surveying the Agents of Galaxy Evolution Legacy program (SAGE-SMC). The SAGE-SMC observations consist of two epochs, separated by three months, of Infrared Array Camera (IRAC) maps at 3.6, 4.5, 5.8, and 8 µm. Here, we use photometry obtained by combining both epochs. Exposure times are short enough (12 s) to ensure that bright sources remain unsaturated, but long enough to obtain sufficient sensitivity for reasonably complete photometry to beyond the HB (cf. Boyer et al., 2009a). Angular resolution with IRAC ranges from 1.7″ at 3.6 µm to 1.9″ at 8 µm. The SAGE-SMC MIPS observations (24 – 160 µm) did not cover 47 Tuc. For details regarding data acquisition and reduction for SAGE-SMC, see K.D.Gordon et al. (2010, in preparation).
47 Tuc was also observed with IRAC as part of PID20298 (P.I. R.Rood). We obtained these data from the Spitzer archive and reduced them independently (hereafter referred to as the Rood data). The Rood field-of-view at each IRAC wavelength reaches a cluster radius of 10′, with an overlapping area of 5′ 9′ centered on 47 Tuc (Fig. 1). Two depths were achieved: 12 s pix-1 and 936 s pix-1, hereafter described as the shallow and deep data, respectively. Observation details are described in Origlia et al. (2007). Here, these data were processed with pipeline S18.7.0. The Basic Calibrated Data were reduced and mosaicked with the MOPEX reduction package (Makovoz & Marleau, 2005) after applying an array distortion correction. We implemented the MOPEX overlap routine to match backgrounds between overlapping areas of the images and the MOPEX mosaicker for outlier elimination, image interpolation, and co-addition. The final mosaics have pixel sizes of 0.86″ pix-1.
3. Photometry
K.D.Gordon et al. (2010, in preparation) contains details about SAGE-SMC point-source photometry.
Point-source extraction () was performed on the Rood data with the DAOphot II package (Stetson, 1987), with point-spread functions (PSFs) derived from 10 isolated stars in each mosaic. Extended sources and outliers broader or narrower than the PSF were rejected based on sharpness/roundness cut-offs. The final fluxes are color-corrected using a 5000 K blackbody (Spitzer Science Center, 2006), an appropriate temperature for a typical RGB star. This correction differs by 1% from that for a 2000 K blackbody. A pixel-phase-dependent correction (Reach et al., 2005) was applied to the 3.6 µm photometry. Photometric errors include standard DAOphot errors and the IRAC absolute calibration errors (Reach et al., 2005). Magnitudes relative to Lyr (Vega) are derived using the zero magnitudes from the Spitzer IRAC data handbook (Spitzer Science Center, 2006). False star tests including both the core and outskirts of the cluster indicate the photometry is 85% complete at the HB in both the deep and shallow mosaics at all four IRAC wavelengths. Bolometric corrections were determined using 2MASS - and -band photometry (Skrutskie et al., 2006), the transformation from Montegriffo et al. (1998), and the reddening () and distance modulus () used in Origlia et al. (2007).
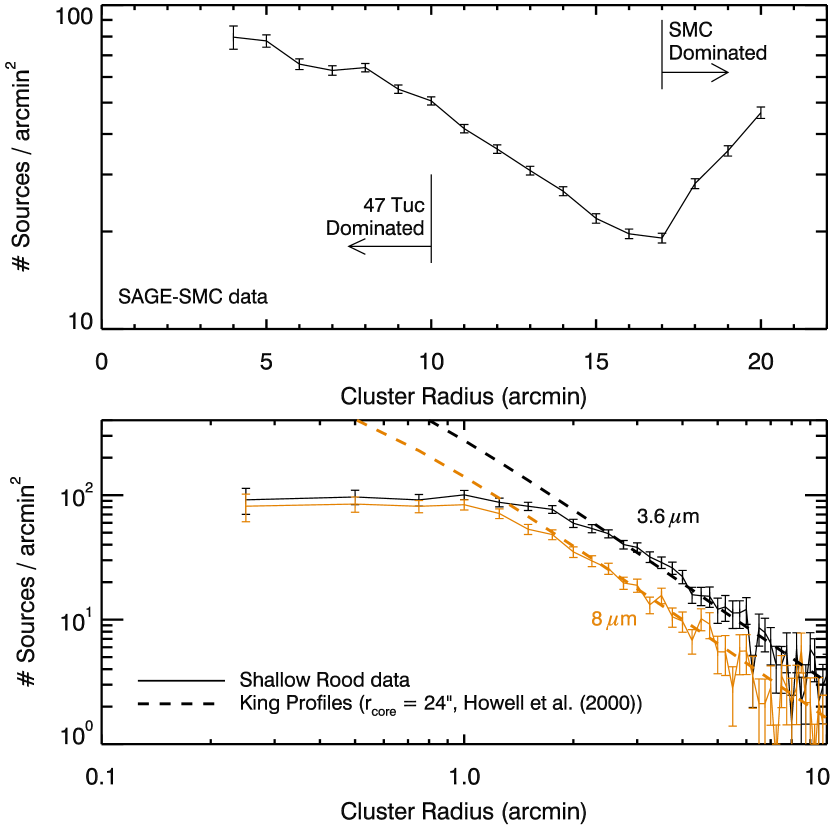
The shallow Rood data are confusion limited at (Fig. 2). Our analysis suggests that the 3.6 µm data deviate from a King profile at (; Howell et al., 2000), while the 8 µm data deviate near 1.8′. Assuming the Origlia et al. (2007) analysis is limited by the 8 µm data (since they use high-quality -band data instead of 3.6 µm), we might expect to have found up to 25% fewer sources in the inner 2′ than were detected in their analysis due to greater incompleteness at 3.6 µm compared to 8 µm.
The SAGE-SMC 3.6 and 8 µm mosaics cover the south-eastern side of the cluster with . We include only sources within 10′ to match the Rood coverage (Fig. 1) and limit contamination from the SMC, which begins to dominate the source density at 15′ (Fig. 2).
4. Discussion
4.1. Dust Excess
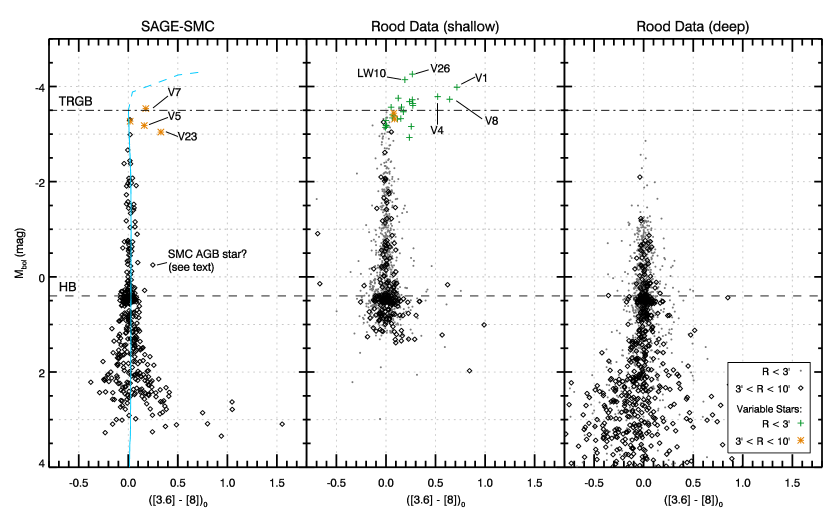
The CMDs in Figure 3 include SAGE-SMC and Rood data. RGB star bolometric magnitudes peak in the near-IR, and warm circumstellar dust is detectable as photometric excess at 8 µm. The envelopes we attempt to detect are optically thin at IR wavelengths (those that are not would stand out); attenuation of starlight can thus be neglected, whilst dust emission is insignificant at 3.6 µm. Hence it does not matter whether the color is used, as in Origlia et al. (2007), or the color. Indeed, in the re-reduced Rood data, all stars with red colors on the upper half of the RGB (where photometric scatter is small) also have red colors. We also note that the mean color for 47 Tuc is a mere 0.08 mag, insignificant compared to the range in dust excess () suggested by Origlia et al. (2007). We prefer to use the color because it does not mix different origins of data, and we can confidently apply the stellar blending test described in Section 4.4.
4.2. SAGE-SMC CMD
The SAGE-SMC CMD is presented in Figure 3. The blue line represents an isochrone from Marigo et al. (2008) with the appropriate age (11.3 Gyr) and metallicity () for 47 Tuc from Thompson et al. (2009); the solid and dashed lines represent the RGB and AGB, respectively. The isochrone indicates that the TRGB is located at , agreeing with the luminosity marking the onset of dust production in 47 Tuc (; Lebzelter et al., 2006).
Aside from 3 variable stars within 0.5 mag of the TRGB (Lebzelter & Wood, 2005), only one source 1 mag brighter than the HB is red, with mag (R.A., decl., J2000). This source is not identified as variable by either Weldrake et al. (2004) or Lebzelter & Wood (2005), but its 3.6 µm magnitude varies by 0.14 mag between the two SAGE epochs. This source is isolated, and is not affected by stellar blending or other imaging artifacts, so the IR excess is likely real. However, the source is in the outskirts of the cluster, in the direction of the SMC, and may not belong to 47 Tuc. If at the distance of the SMC, its absolute 3.6 µm magnitude is mag, which is mag brighter than the TRGB and consistent with a typical AGB star (Bolatto et al., 2007). Thus we conclude that significant IR excess in 47 Tuc is limited to mag from the TRGB in the SAGE-SMC data, similar to what is seen in Cen, NGC 6791, and NGC 362 (Boyer et al., 2008; van Loon et al., 2008; Boyer et al., 2009a).
4.3. Spitzer Archive CMDs
Photometry extracted from the Rood data is noticeably noisier than the SAGE-SMC photometry (Fig. 3, middle, right panels). This could partially be due to differences in data acquisition and reduction, but it appears the scatter is caused mainly by inclusion of the inner 3′ of the cluster (light gray dots in Fig. 3), where crowding is an issue. The deeper photometry suffers from saturation at 3.6 µm already more than a magnitude below the TRGB. For clarity, saturated sources are excluded from the CMD in Figure 3.
We see immediately that the new photometry has resulted far fewer IR-excessive sources than found by Origlia et al. (2007). That study found IR-excessive stars () distributed evenly along the entire RGB, while we see only a handful of red sources only near the upper RGB, or in increasing number and redness towards magnitudes fainter than 2 mag below the TRGB. In the shallow data (), we find 24 sources with IR excess ( mag) and mag, four times fewer than found by Origlia et al. (2007) in the same area of their CMD. This is consistent with an AKARI analysis of 47 Tuc presented by Ita et al. (2007), where it can be seen in their Fig. 2 that most dusty stars reside near the TRGB.
Thirteen of these 24 red stars are variable stars identified by Lebzelter & Wood (2005). The brightest variables, V26 and LW10, may be AGB stars, whilst the others trace the RGB. Curiously, both show no excess in µm spectra (van Loon et al., 2006), but do show moderate excess in the Rood data ( mag), which were taken one month prior to the spectral observations. The difference could be due to episodic dust production during the pulsation cycle. The variables V1 and V8 are the reddest stars in the shallow Rood data, agreeing with the dust excess seen in their mid-IR spectra (Ramdani & Jorissen, 2001; Origlia et al., 2002; Lebzelter et al., 2006; van Loon et al., 2006).
When excluding dusty variable stars, we find only 11 sources with IR excess in the shallow Rood data, all but one more than 2 mag fainter than the TRGB. These sources all fall within 3′ of the cluster center, suggesting that stellar crowding may be leading to inflated fluxes, as measured in the lower resolution 8 µm images.
In the deep data, we find 11 other sources with excess . However, excluding the inner 2′ of the cluster as done in Origlia et al. (2007) leaves only one source with IR excess.
4.4. Stellar Blending and Imaging Artifacts at 8 µm
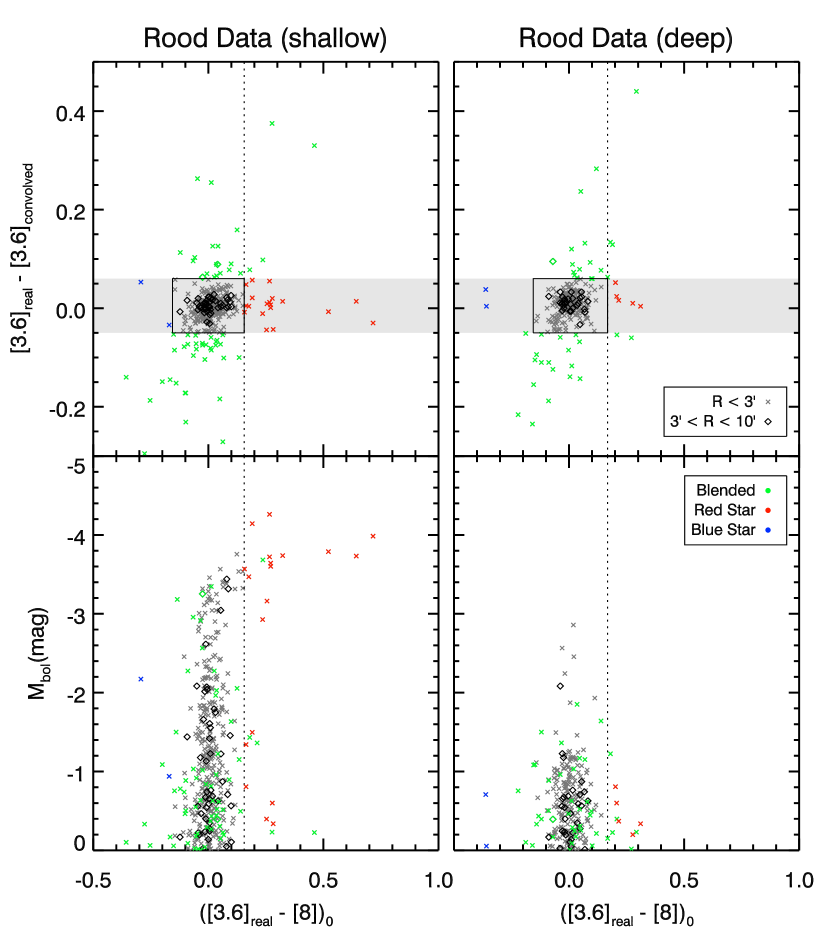
A re-analysis of the photometry has revealed only 24 red sources, missing 74% of the 93 red sources from Origlia et al. (2007). This discrepancy cannot be entirely due to the 25% incompleteness of the 3.6 µm data described in Section 3 since that would require red sources to be preferentially undetected compared to non-red sources. That scenario is unlikely since the red sources are evenly distributed in the cluster and since optically thin circumstellar dust emission is minimal at 3.6 µm. To investigate whether the 24 red sources are truly harboring circumstellar dust, we have performed a stellar blending test, similar to that done for Cen in Boyer et al. (2008). We convolved the 3.6 µm image with the 8 µm PSF and extracted point-source fluxes from the resulting low-resolution 3.6 µm image using the same procedure described in Section 3. In the ideal scenario, where all stars are isolated, should always be near zero. Any sources that show mag are affected by stellar blending, which inflates the convolved 3.6 µm flux. Stars that are truly red should have mag and mag. Figure 4 shows the results of this test.
In the crowded environment of a GC, blending can be complicated. The test described above may also result in blue colors, caused by stellar confusion within compact groups of stars. With many overlapping PSFs, it is no surprise that flux measurements can be uncertain. We choose a conservative cut-off of mag to define stars with affected photometry.
The boxes in Figure 4 show the mean 3 excess in the x-direction and the cut-off for blended sources in the y-direction. The shaded regions to the left and right of these boxes show the approximate locus of truly red or blue IR colors. Stars above or below the shaded region are suffering from blending and/or source confusion. Stars shown to have real red or blue colors are marked in red and blue, respectively, and sources affected by blending and/or confusion are marked in green. The locations of these stars on the CMDs are shown in the lower panels. In the shallow data, the horizontal plume of stars at the TRGB is striking and very well distinguished from the vertical dispersion, which is a result of stellar blending and source confusion. Note that in the shallow data, only one red star with mag is blended: variable LW8.
Of the 11 sources in the shallow data (identified in Section 4.3) brighter than the HB and not identified as variable stars, we find a total of 6 unblended, red sources below the TRGB, all with mag. In the deep data, we find 5 such sources. Tellingly, none of these sources are red in both the shallow and deep data.
Closer inspection of the shallow 8 µm mosaic shows that all 6 of the faint, red, unblended stars fall directly on image artifacts caused by internal optical scattering inside the detector array (known as banding; Spitzer Science Center, 2006), causing an artificial increase in their 8 µm fluxes. Therefore, there are no truly red sources below the TRGB in the shallow data. Of the 5 faint, red, unblended stars in the deep data, 2 are affected by banding, and 2 lie immediately adjacent to a saturated star, which may affect both their 3.6 and 8 µm fluxes. In the deep data, we therefore find only one potentially dusty source below the TRGB. Again, we note that this source is not red in the shallow data, indicating that the IR excess is not real. Therefore, there are no truly dusty sources fainter than 0.5 mag from the TRGB, consistent with the SAGE-SMC data.
4.5. Implications for Mass Loss and Dust Production
To be consistent with the analysis from Origlia et al. (2007), we would have detected up to 70 dusty sources, even after considering incompleteness in the 3.6 µm data compared to their -band data. However, through close inspection of stellar blending and imaging artifacts in SAGE-SMC data and the re-reduced Origlia et al. (2007) data, we find that the number of truly dusty stars in 47 Tuc below about a magnitude fainter than the TRGB is consistent with zero. We therefore find that the mass loss law derived by Origlia et al. (2007) over-predicts mass loss along the RGB – estimating nearly two orders of magnitude more mass loss among the faintest RGB stars than Reimers’ law (Reimers, 1975) and attributing 25% of the total mass loss to stars fainter than mag. With no dusty mass loss along the RGB, these faint RGB stars together contribute closer to 1% of the total cluster mass loss (based on Reimers’ law). We do see a large number of red sources at or above the TRGB (Fig. 3), as expected if the stellar structure only becomes favorable to dust production if the star is either close to the occurrence of core helium ignition (i.e., near the TRGB), or is experiencing helium-shell flashes (i.e., on the thermally pulsing AGB).
Very little, if any, dust is forming below the TRGB, but that is not to say that no mass is lost on the RGB. Indeed, the morphology of the HB requires that mass is lost on the RGB. Chromospherically-driven winds are indicated in several RGB stars by asymmetries and coreshifts in chromospheric spectral lines, with mass-loss rates up to (e.g., Mauas et al., 2006; McDonald & van Loon, 2007; Dupree et al., 2009), which is almost exactly what is required to explain the HB morphology.
In addition to only residing near the TRGB, the majority of the stars showing evidence for circumstellar dust are also variable. This supports the idea that dust production coincides with pulsationally-enhanced stellar winds.
References
- Bolatto et al. (2007) Bolatto, A. D., et al. 2007, ApJ, 655, 212
- Bowen (1988) Bowen, G. H. 1988, ApJ, 329, 299
- Boyer et al. (2009a) Boyer, M. L., et al. 2009a, ApJ, 705, 746
- Boyer et al. (2008) Boyer, M. L., McDonald, I., van Loon, J. Th., Woodward, C. E., Gehrz, R. D., Evans, A., Dupree, A. K. 2008, AJ, 135,1395
- Boyer et al. (2009b) Boyer, M. L., Skillman, E. D., van Loon, J. Th., Gehrz, R. D., & Woodward, C. E. 2009b, ApJ, 697, 1993
- Boyer et al. (2006) Boyer, M. L., Woodward, C. E., van Loon, J. Th., Gordon, K. D., Evans, A., Gehrz, R. D., Helton, L. A., & Polomski, E. F. 2006, AJ, 132, 1415
- Caloi & D’Antona (2008) Caloi, V., & D’Antona, F. 2008, ApJ, 673, 847
- Catelan (2000) Catelan, M. 2000, ApJ, 531, 826
- Cioni et al. (2000) Cioni, M.-R. L., van der Marel, R. P., Loup, C., & Habing, H. J. 2000, A&A, 359, 601
- Christy (1966) Christy, R. F. 1966, ApJ, 144, 108
- Dupree et al. (2009) Dupree, A. K., Smith, G. H., & Strader, J. 2009, AJ, 138, 1485
- Ferraro et al. (1999) Ferraro, F. R., Messineo, M., Fusi Pecci, F., de Palo, M. A., Straniero, O., Chieffi, A., & Limongi, M. 1999, AJ, 118, 1738
- Ferrarotti & Gail (2006) Ferrarotti, A. S., & Gail, H.-P. 2006, A&A, 447, 553
- Gehrz (1989) Gehrz, R. D. 1989, in Interstellar Dust, ed. L. J. Allamandola, & A. G. G. M. Tielens. IAUS 135 (Dordrecht: Kluwer Academic), 445
- Harris (1996) Harris, W. E. 1996, AJ, 112, 1487
- Hartmann & Avrett (1984) Hartmann, L., & Avrett, E. H. 1984, ApJ, 284, 238
- Hartmann & MacGregor (1980) Hartmann, L., & MacGregor, K. B. 1980, ApJ, 242, 260
- Höfner & Andersen (2007) Höfner, S., & Andersen, A. C. 2007, A&A, 465, L39
- Höfner (2008) Höfner, S. 2008, A&A, 491, L1
- Howell et al. (2000) Howell, J. H.,Guhathakurta, P., & Gilliland, R. L. 2000, PASP, 112, 1200
- Ita et al. (2007) Ita, Y., et al. 2007, PASJ, 59, 437
- Kalirai et al. (2007) Kalirai, J. S., Bergeron, P., Hansen, B. M. S., Kelson, D. D., Reitzel, D. B., Rich, R. M., & Richer, H. B. 2007, ApJ, 671, 748
- Lebzelter et al. (2006) Lebzelter, T., Posch, T., Hinkle, K., Wood, P. R., & Bouwman, J. 2006, ApJ, 653, L145
- Lebzelter & Wood (2005) Lebzelter, T., & Wood, P. R. 2005, A&A, 441, 1117
- Makovoz & Marleau (2005) Makovoz, D., & Marleau, F. R. 2005, PASP, 117, 1113
- Mauas et al. (2006) Mauas, P. J. D., Cacciari, C., & Pasquini, L. 2006, A&A, 454, 609
- Marigo et al. (2008) Marigo, P., Girardi, L., Bressan, A., Groenewegen, M. A. T., Silva, L., & Granato, G. L. 2008, A&A, 482, 883
- McDonald & van Loon (2007) McDonald, I., & van Loon, J. Th. 2007, A&A, 476, 1261
- McDonald et al. (2009) McDonald, I., van Loon, J. Th., Decin, L., Boyer, M. L., Woodward, C. E., Gehrz, R. D., Evans, A., & Dupree, A. K. 2009, MNRAS, 394, 831
- Montegriffo et al. (1998) Montegriffo, P., Ferraro, F. R., Origlia, L., & Fusi Pecci, F. 1998, MNRAS, 297, 872
- Origlia et al. (2002) Origlia, L., Ferraro, F. R., Fusi Pecci, F., & Rood, R. T. 2002, ApJ, 571, 458
- Origlia et al. (2007) Origlia, L., Rood, R. T., Fabbri, S., Ferraro, F. R., Fusi Pecci, F., & Rich, R. M. 2007, ApJ, 667, L85
- Ramdani & Jorissen (2001) Ramdani, A., & Jorissen, A. 2001, A&A, 372, 85
- Reach et al. (2005) Reach, W. T., et al. 2005, PASP, 117, 978
- Reimers (1975) Reimers, D. 1975, Memoires of the Societe Royale des Sciences de Liege, 8, 369
- Renzini & Voli (1981) Renzini, A., & Voli, M. 1981, A&A, 94, 175
- Rood (1973) Rood, R. T. 1973, ApJ, 184, 815
- Skrutskie et al. (2006) Skrutskie, M. F., et al. 2006, AJ, 131, 1163
- Sloan et al. (2009) Sloan, G. C., et al. 2009, Science, 323, 353
- Spitzer Science Center (2006) Spitzer Science Center. 2006, Infrared Array Camera Data Handbook (Pasadena: SSC)
- Stetson (1987) Stetson, P. B. 1987, PASP, 99, 191
- Thompson et al. (2009) Thompson, I. B., Kaluzny, J., Rucinski, S. M., Krzeminski, W., Pych, W., Dotter, A., & Burley, G. S. 2009, arXiv:0910.4262
- van Loon et al. (2010) van Loon, J. Th., et al. 2010, AJ, 139, 68
- van Loon et al. (2008) van Loon, J. Th., Boyer, M. L., & McDonald, I. 2008, ApJ, 680, L49
- van Loon et al. (2005) van Loon, J. Th., Cioni, M.-R. L., Zijlstra, A. A., & Loup, C. 2005, A&A, 438, 273
- van Loon et al. (2008) van Loon, J. Th., Cohen, M., Oliveira, J. M., Matsuura, M., McDonald, I., Sloan, G. C., Wood, P. R., & Zijlstra, A. A. 2008, A&A, 487, 1055
- van Loon et al. (1999) van Loon, J. Th., Groenewegen, M. A. T., de Koter, A., Trams, N. R., Waters, L. B. F. M., Zijlstra, A. A., Whitelock, P. A., & Loup, C. 1999, A&A, 351, 559
- van Loon et al. (2006) van Loon, J. Th., McDonald, I., Oliveira, J. M., Evans, A., Boyer, M. L., Gehrz, R. D., Polomski, E., & Woodward, C. E. 2006, A&A, 450, 339
- Weldrake et al. (2004) Weldrake, D. T. F., Sackett, P. D., Bridges, T. J., & Freeman, K. C. 2004, AJ, 128, 736
- Werner et al. (2004) Werner, M. W., et al. 2004, ApJS, 154, 1