Low-Latitude Coronal Holes at the Minimum of the 23rd Solar Cycle
Abstract
Low and mid-latitude coronal holes (CHs) observed on the Sun during the current solar activity minimum (from September 21, 2006, Carrington rotation (CR) 2048, until June 26, 2009 (CR 2084)) were analyzed using SOHO/EIT and STEREO-A SECCHI EUVI data. From both the observations and Potential Field Source Surface (PFSS) modeling, we find that the area occupied by CHs inside a belt of 40∘ around the solar equator is larger in the current 2007 solar minimum relative to the similar phase of the previous 1996 solar minimum. The enhanced CH area is related to a recurrent appearance of five persistent CHs, which survived during 7-27 solar rotations. Three of the CHs are of positive magnetic polarity and two are negative. The most long-lived CH was being formed during 2 days and existed for 27 rotations. This CH was associated with fast solar wind at 1 AU of approximately 620 km s-1. The 3D MHD modeling for this time period shows an open field structure above this CH. We conclude that the global magnetic field of the Sun possessed a multi-pole structure during this time period. Calculation of the harmonic power spectrum of the solar magnetic field demonstrates a greater prevalence of multi-pole components over the dipole component in the 2007 solar minimum compared to the 1996 solar minimum. The unusual large separation between the dipole and multi-pole components is due to the very low magnitude of the dipole component, which is three times lower than that in the previous 1996 solar minimum.
1 Introduction
Coronal holes (CHs), in general, may be observed anywhere on the solar disk, however their spatial distribution, frequency of occurrence and evolution are governed by the solar cycle. Three types of CHs may be distinguished (Storini et al., 2006). First, there are polar CHs, which are located at the solar poles and have a lifetime comparable to that of the solar cycle. Included in this category are CH extensions, such the “elephant trunk” CH observed in August 1996 (Zhao et al. 1999). Second type is isolated CHs, which are mostly limited to the low- and middle latitudes and are not connected to the polar CHs. Their lifetime is comparable to few Carrington rotations (CRs). The third type consists of transient CHs, which are short lived (hours or days) and their occurrence is often associated with powerful eruptions (flares) and/or filament disappearances. Polar CHs usually disappear during the maximum of a solar cycle and reappear again, already having magnetic flux of opposite polarity, thus manifesting the polar field reversal. Isolated CHs behave quite differently. They tend to be more often detected at activity maximum and disappear near activity minimum. According to Hofer & Storini (2002), during the 1986 solar minimum there were only few isolated CHs and none of them was older than 5 solar rotations. Similar findings were reported by Bilenko (2002) for the 1996 minimum. Potential Field Source Surface (PFSS) modeling of open field regions (Luhmann et al. 2002) also indicates a very low population of low- and mid-latitude CHs during the two previous (1986 and 1996) solar minima.
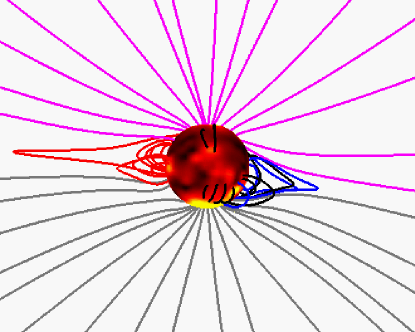
Qualitatively, the above reports are consistent with the comparison of the structure of the solar corona at the 1996 solar minimum derived from 3D MHD modeling (Mikić et al. 1996; 1999; Linker et al. 1996; 1997; 1999) and actually observed during two solar eclipses in 1995 and 1997 (Figure 1). Apparently, the lack of isolated low-latitude CHs on the solar surface resulted in the formation of a well-defined closed magnetic configuration near the solar equator (streamer belt) and the well developed dipole structure of the global magnetic field of the Sun.

The above scenario seems not to be applicable for the current extended 2007 solar minimum, when many global parameters of the heliospheric magnetic field differ significantly from what was measured in the past solar minima. Apart from the unusually low measured sun spot number, observations also show that: i) interplanetary magnetic field strength is lower when compared to a similar phase of the previous 22nd solar cycle (Lee et al. 2009); ii) the meridional flows inferred by means of surface feature tracking are slower (Hathaway 2008, Schrijver & Liu 2008); iii) photospheric polar magnetic flux is smaller (Smith & Balogh 2008; Lee et al. 2009); iv) solar wind mass flux dropped by about 20% (McComas et al. 2008); v) the tilt angle of the solar dipole throughout the current 2007 solar minimum is unusually high and vi) co-rotating interactive regions (CIRs) are abundant and geomagnetic activity is remarkably persistent and recurrent (Mason et al. 2009).
Recently, a comprehensive analysis of a part of the declining phase of the 23rd solar cycle (from January 8 to November 4, 2007) using the PFSS and Wang-Sheeley-Arge (WSA, Arge & Pizzo 2000) models and comparison with STEREO and OMNI solar wind data has been carried out by Luhmann et al. (2009) and Lee et al. (2009). The model results clearly demonstrated an excess of low- and mid-latitude CHs during the time period under study (Figure 8 in Luhmann et al. 2009) and show a reduced magnitude of solar polar magnetic field. The presence of low- and mid-latitude CHs may have affected the enhanced ecliptic solar wind speed and explain the observed anomalous distribution of the solar wind speed with a heavy tail at 500-700 km s-1.
In this paper, we take a closer look at the low-latitude CHs during the period between 2007 and 2009 by utilizing data from the Solar and Heliospheric Observatory (SOHO) Extreme ultraviolet Imaging Telescope (EIT, Delaboudiniere et al. 1995) and Solar Terrestrial Relations Observatory (STEREO) Sun Earth Connection Coronal and Heliospheric Investigation (SECCHI) EUVI (Howard et al. 2008) instruments. We investigate their recurrent properties by tracking CHs in time and we analyze the harmonic power spectrum of the solar magnetic field (Section 2). In Section 3 we analyze one of the coronal holes in more detail, including its magnetic field structure and solar wind signatures. Concluding remarks are in Section 4.
2 High Population of Low-Latitude CHs during the Minimum of Solar Cycle 23
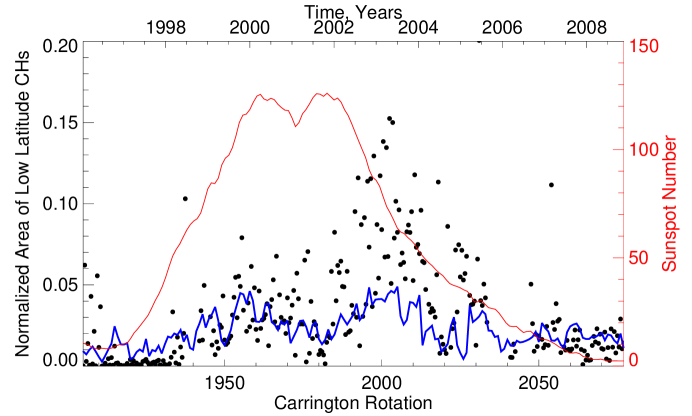
To study the occurrence frequency of low-latitude CHs on the solar disk we calculated the total area of CHs (Figure 2) observed between February 1996 (CR 1905) and December 2008 (CR 2077). The CH area was determined from SOHO/EIT Fe XV 284Å synoptic maps () for all CHs located between the latitudes of -40∘ and +40∘. This area was calculated for each half of one Carrington rotation and then normalized to the total solar surface area limited by -40∘ and +40∘ latitudes. (For details on the CH outlining technique, see Abramenko et al. 2009). Correspondingly, the normalized CH area was calculated from the PFSS model data (blue curve in Figure 2) in the manner as described in Lee et al. (2009). As it follows from the graph, both observed and model data show that, in contrast with the previous 1996 solar minimum, low-latitude CHs appear more frequently during the 2007 solar minimum and they occupy a larger portion of the solar surface.
Are these low-latitude CHs short-lived transient entities (as they usually are during a solar minimum), or is their appearance caused by structures that survived many solar rotations? We address this question by tracking the CHs in time.
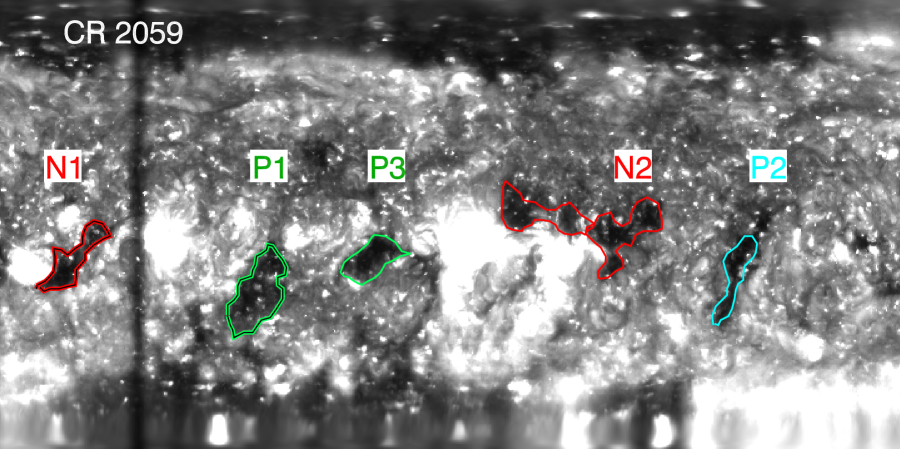
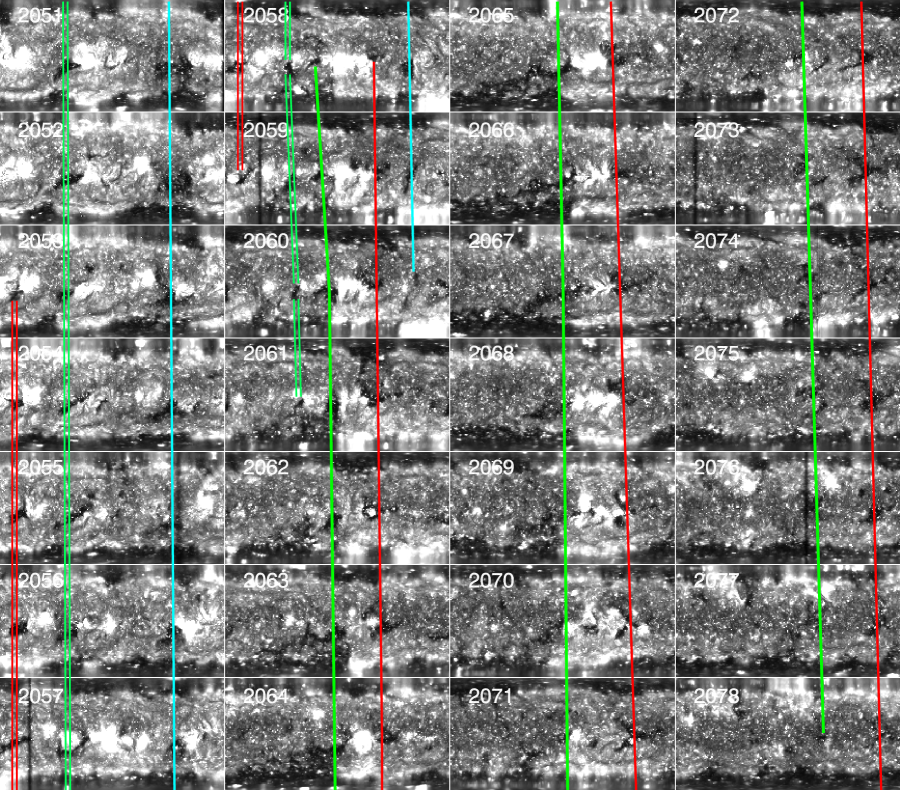
In Figure 3 we show a STEREO-A SECCHI EUVI 195Å synoptic map (background) where we outline the boundaries of five isolated low-latitude CHs. Two of them were associated with negative polarity magnetic field (N1, N2) and three were of positive polarity (P1, P2 and P3). Color lines in Figure 4 trace the CHs positions between consecutive Carrington rotations (note that the color coding in Figures 3 and 4 is the same). The positive polarity CHs were long-lived. P1 (double green line) and P2 (blue line) appeared during CRs 2049 and 2048, respectively, and both lasted for about 13 solar rotations. Meanwhile, P3 (thick green line), which appeared during CR 2058, lasted for 21 solar rotations.
The negative polarity coronal hole N1 (double red line) appeared during CR2053 and was observed for at least 7 rotations (see also Luhmann et al. 2009), while N2 (thick red line) was first detected during CR2058 (June 28, 2007) and survived until May 2009 for almost 27 solar rotations. Coronal holes P3 and N2 observed during CR 2063 have been modeled by Luhmann et al. (2009).
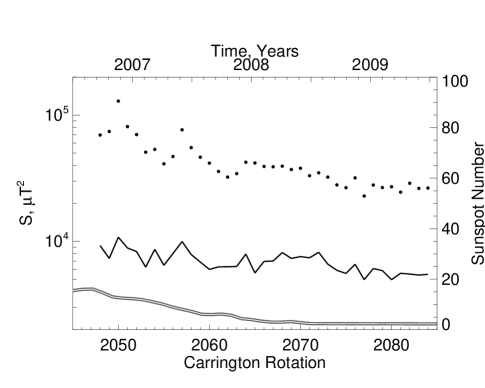
It appears that the observed excess of low-latitude CHs during the current 2007 solar minimum is, to a large extent, caused by the repeated and persistent appearance of these five CHs on the visible solar hemisphere. Quite possibly, their existence may be a manifestation of strong multi-pole moments in the harmonic spectrum of the magnetic field of the Sun, which can be written as (Altschuler et al., 1977). Here, and are harmonic coefficients determined from measurements of the line-of-sight component of the photospheric magnetic field. We used the harmonic coefficients calculated at the Wilcox Solar Observatory () for CRs 2045 – 2085 to examine the dipole and multi-pole components during the 1996 and 2007 minima (Figure 5). From these plots, the difference between the dipole and multi-pole components is larger during the 2007 solar minimum as compared to the similar phase of the 1996 solar minimum and it may be chiefly attributed to weakening of the dipole component during the 2007 solar minimum. In particular, when comparing data for CRs 1900 – 1909 and CRs 2048-2057 (similar solar cycle phase), one can see that the dipole component decreased nearly threefold, whereas the sum of all multi-poles decreased only by about 30%. It is also interesting that there is a slight decline in both dipole and multi-pole components during the 2007 solar minimum, which was not the case for the preceding 1996 solar minimum.

3 Genesis of the Equatorial Corona Hole N2
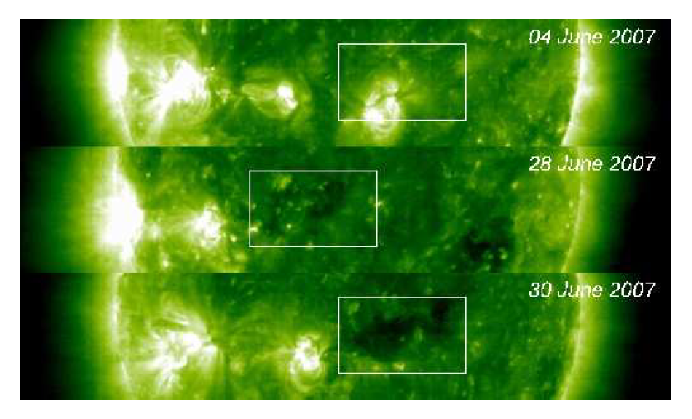
We analyzed the most persistent coronal hole, N2, in more details. In Figure 6 we illustrate appearance of N2 by showing three EIT 195Å images taken on June 04, 28 and 30 of 2007. The over-plotted boxes encircle the same area on the Sun. Comparison of the June 04 (top) and June 30 (bottom) images (they are one CR apart) shows that small active region (AR) NOAA 10958, completely decayed over one solar rotation and that a vast area immediately north-east of the AR became occupied by a CH (indicated by the box in the bottom panel). The June 28 EIT 195Å image (middle) shows that only two days earlier the CH was not present or, at least, it was in a very early stage of development.
As we mentioned earlier, this CH was observed (having slightly different shapes) for 27 solar rotations. The time difference between consecutive culminations of the center of gravity of the CH was on average 26.9 0.7 days. The latitude of the center of gravity varied between -10∘ and 8∘, which indicates on its near equatorial location. (Note that the coordinates of the center of gravity were determined by averaging the corresponding coordinates of the points located along the CH boundary; a technique to outline the CH boundary is described in Abramenko et al. 2009).
To probe the structure of the negative polarity field inside N2, we utilized Advanced Composition Explorer (ACE) Solar Wind Electron, Proton, and Alpha Monitor (SWEPAM) measurements of the solar wind speed, , in geocentric solar ecliptic (GSE) coordinate system. We determined the speed of the fast stream, associated with the CH, by accepting that the time interval between the stream arrival time at 1 AU and the injection time (the CH culmination moment) multiplied by a given , measured by ACE instrument, produces a distance of 1 AU (for more details see Abramenko et al. 2009). This was performed for 17 solar rotations (CRs 2059 - 2075) during which N2 has been observed. Since no other solar activity was detected during the period under study, our approach allowed us every time to reliably detect a well-pronounced signature of the CH in the solar wind speed time profile. The magnitude of the CH-associated solar wind speed varied between 560 and 670 km s-1 with the mean value of 620 40 km s-1.
We next examine whether there is evidence for the N2 CH in coronal models. A 3D MHD model of the solar corona was computed prior to the August 1, 2008 solar eclipse (see ). A synoptic magnetic field map for CRs 2071-2072 (June 25 – July 21, 2008) was constructed from MDI magnetograms and used as the boundary condition. The modeling approach is described by Lionello et al. (2009), while Rusin et al. (2009) describes a comparison of the model with observations around the time of the eclipse.
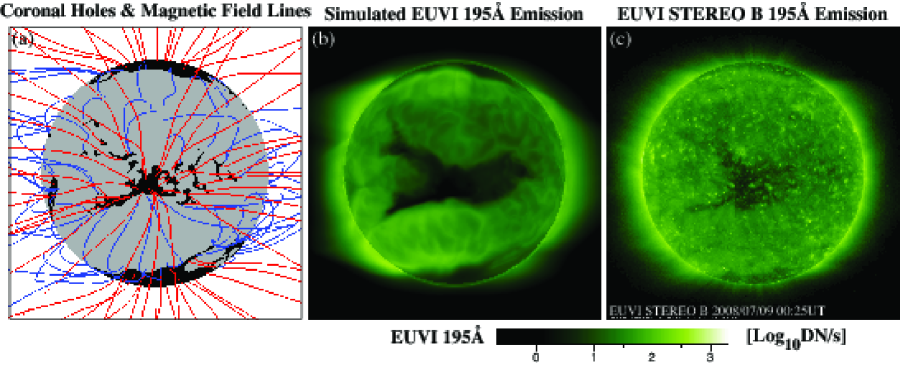
Figure 7 shows CH boundaries, magnetic field lines and emission at 195Å as derived from the MHD model and the EUVI instrument aboard the STEREO-B spacecraft on July 9, 2008. The open field regions in the model (black areas and red field lines in Figure 7(a)) agree quite well with the STEREO observations of N2 (Figure 7(c)). The simulated emission (Figure 7(b)) also agrees reasonably well with the observations, although the CH region is too dark and extensive in the model. This is because the coronal heating mechanism, assumed for the model, produced too little emission overall (see Lionello et al. (2009) for a discussing of the technique for computing simulated emission from coronal models). Nevertheless, it is clear that N2 is revealed to be a CH in the MHD model as well as the observations. The N2 was detected again prior the August 2008 eclipse in STEREO-A observations on July 14, and afterward in SOHO EIT observations on August 7. It survived for nearly another year after that. During May, 2009 the N2 began to shrink and it finally vanished one rotation later in June, almost two years after its first appearance on the solar surface.
4 Concluding Remarks, Discussion and Open Questions
We have combined observed data with magnetic field modeling to show that the global magnetic field of the Sun during this 2007 extended solar minimum was not a simple dipole. The area occupied by CHs inside a belt of 40∘ around the solar equator was found to be considerably larger during the 2007 minimum than that during the similar phase of the previous 1996 solar minimum. Our results are confirmed by the CH-modeling results recently reported by Luhmann et al. (2009).
Thus, the global magnetic field of the Sun had a multi-pole configuration, at least in the time period between September 2006 and May 2009. The harmonic power spectrum of the solar magnetic field shows a greater prevalence of higher multi-pole moments over the dipole moment relative to the previous 1996 solar minimum. The large difference between these two parameters is probably due to a very low (three times lower than that in the 1996 solar minimum) magnitude of the dipole component.
The observed diminution of the polar magnetic field also implies reduction of the dipole component relative to the rest of the multi-pole components in the solar magnetic field harmonic spectrum (Luhmann et al. 2009). This, in turn, might result in re-enforcement of the multi-pole magnetic configuration in the global solar magnetic field, which can be observed as persistent CHs along the low- and mid-latitudes on the Sun.
From September 2006 until May 2009, there were at least five long lived CHs associated with patches of open field inside the near-equatorial 40∘ zone. Three of them were of positive magnetic polarity and the other two were negative polarity CHs. They lasted from 7 to 27 solar rotations. The longest lived coronal hole, N2, formed on the solar disk during a time interval of nearly 2 days and existed for 27 rotations at solar latitudes between S10 and N08. N2 was associated with a fast solar wind stream at 1 AU of approximately 620 km s-1, which may in part be responsible for the heavy tail in the solar wind speed distribution (Luhmann et al. 2009). An MHD model of the corona that used SOHO MDI synoptic maps from June 25–July 21, 2008 for the boundary condition, predicted an open field structure and dark emission in the N2 CH region.
A possible mechanism for the formation of this global solar multi-pole is a new challenge for solar dynamo theory. How do these persistent low- and mid-latitude CHs form during a deep solar minimum? They are most likely not transient CHs because there were no coronal mass ejecta during these quiet times that could have created them. It is also very unlikely that these CHs separated from the polar CHs and migrated to the solar equatorial region during one rotation (see Section 3).
Very often a low latitude CH originally forms in association with an active region (e.g., Bohlin & Sheeley 1978; Harvey & Recely 2002; Bilenko 2004; Karachik et al. 2010). Recent analysis of CH formation (Karachik et al. 2010) showed that appearance of a CH in association with an AR is not unique. Authors discuss four cases observed during 2009 when an isolated CH appeared on the place of decaying active regions (similar to the N2 CH case). These isolated CHs might form in-situ as a result of a large-scale reconnection between the remnant fields of an decaying active region and strongly diverged global open field lines (Wang & Sheeley 2004). Then as the active region decays the CH may or may not survive – depending on the rate of AR field decay, whether there is new flux emerging in the same place (e.g. a long-lived ”nest” or ”active longitude”), or just an extremely slow decay of the AR fields, perhaps due to very little new flux emergence going on. Anyway, the isolated CHs, being very persistent during the current 2007 solar minimum, contribute significantly into the total solar magnetic field balance, equilibrium between the multipole and dipole magnetic components and, eventually, might play a role in the onset of the next solar activity cycle.
We are thankful to A. Pevtsov and G. deToma for very helpful discussions. We highly appreciate the efforts of the anonymous referee whose comments and criticism led to improvement of the manuscript. V. Abramenko and V. Yurchyshyn were supported by NSF ATM-0716512 and NASA STEREO NNX08AJ20G grants. J. Linker and Z. Mikić were supported by the LWS Strategic Capabilities program (jointly funded by NASA, AFOSR, & NSF), NASAs Heliophysics Theory Program, the NSF CISM program, and the STEREO IMPACT and SECCHI teams. Computational resources were provided by the TACC on the Ranger supercomputer and by NAS on the Columbia and Pleiades supercomputers. We thank the ACE MAG and SWEPAM instrument teams and the ACE Science Center for providing the ACE data. We acknowledge the Wilcox Solar Observatory staff for providing the harmonic coefficients. SOHO is a project of international cooperation between ESA and NASA. The SECCHI data used here were produced by an international consortium of the Naval Research Laboratory (USA), Lockheed Martin Solar and Astrophysics Lab (USA), NASA Goddard Space Flight Center (USA), Rutherford Appleton Laboratory (UK), University of Birmingham (UK), Max-Planck-Institut for Solar System Research (Germany), Centre Spatiale de Liege (Belgium), Institut d’Optique Theorique et Appliquee (France), and Institut d’Astrophysique Spatiale (France).
References
- (1) Abramenko, V. I., Yurchyshyn, V., & Watanabe, H. 2009, Solar Phys., 260, 43
- (2) Altschuler, M. D., Levine, R. H., Stix, M., & Harvey, J. 1977, Sol. Phys., 51, 345
- (3) Arge, C. N., Pizzo, V. J. 2000, JGR, 105, Issue A5, 10465
- (4) Bilenko, I.A. 2002, Astron. Astrophys., 396, 657
- (5) Bilenko, I.A. 2004, ”Multi-Wavelength Investigations of Solar Activity”, Proceedings IAU Symp. 223 (Eds. A.V.Stepanov, E.E.Benevolenskaya, A.G.Kosovichev), 373.
- (6) Bohlin, J.D., Sheeley, N.R.Ir. 1978, Solar Phys., 56,125.
- (7)
- (8) Delaboudiniere, J.-P.; Artzner, G. E.; Brunaud, J.; Gabriel, A. H.; Hochedez, J. F.; Millier, F.; Song, X. Y.; Au, B.; Dere, K. P.; Howard, R. A.; Kreplin, R.; Michels, D. J.; Moses, J. D.; Defise, J. M.; Jamar, C.; Rochus, P.; Chauvineau, J. P.; Marioge, J. P.; Catura, R. C.; Lemen, J. R.; Shing, L.; Stern, R. A.; Gurman, J. B.; Neupert, W. M.; Maucherat, A.; Clette, F.; Cugnon, P.; van Dessel, E. L., 1995, Solar Phys., 162, 291
- (9) Harvey, K., Recely, F. 2002 Solar Phys., 211, 31.
- (10) Hathaway, D. H. 2009, Space Sci. Rev., 144, 401
- (11) Hofer, M. Y., Storini, M. 2002, Solar Phys., 207, 1
- (12) Howard, R. A., Moses, J. D., Vourlidas, A., Newmark, J. S., Socker, D. G., Plunkett, S. P., et al., 2008, Space Sci. Rev., 136, 67
- (13) Karachik, N. V., Pevtsov, A.A., Abramenko, V.I. 2010, ApJ, submitted.
- (14) Lee, C. O., Luhmann, J. G., Zhao, X. P., Liu, Y., Riley, P., Arge, C.N., Russell, C. T., & de Pater, I. 2009, Sol. Phys., 256, 345
- (15) Linker, J. A., Mikic, Z., & Schnack, D. D. 1996, in ASP Conf. Ser. 95, Solar drivers of the interplanetary and terrestrial disturbances, eds. Balasubramaniam, K. S., Keil, S.L., & Smartt, R.N., 208
- (16) Linker, J. A. and Mikić, Z. 1997, Extending coronal models to Earth orbit. In Crooker, N., Joselyn, J., and Feynman, J., editors, Coronal Mass Ejections: Causes and Consequences, page 269.
- Linker et al. (1999) Linker, J. A., Mikić, Z., Biesecker, D. A., Forsyth, R. J., Gibson, S. E., Lazarus, A. J., Lecinski, A., Riley, P., Szabo, A., & Thompson, B. J. 1999, J. Geophys. Res., 104, 9809
- (18) Lionello, R., Linker, J., & Mikić, Z. 2009, ApJ, 690, 902
- (19) Luhmann, J. G., Li, Y., Arge, C. N., Gazis, P. R., & Ulrich, R. 2002, JGR (Space Physics), 107, A8, SMP 3-1
- (20) Luhmann, J. G., Lee, C. O., Li, Y., Arge, C. N., Galvin, A. B., Simunac, K., Russell, C. T., Howard, R. A., & Petrie, G. 2009, Sol. Phys., 256, 285
- (21) Mason, G.M., Desai, M.I., Mall, U., Korth, A., Bucik, R., von Rosenvinge, T.T., & Simunac, K.D. 2009, Solar Phys. 256, 393
- (22) McComas, D. J., Ebert, R. W., Elliott, H. A., Goldstein, B. E., Gosling, J. T., Schwadron, N. A., & Skoug, R. M. 2008, Geophys. Res. Lett., 35, L18103
- Mikić & Linker (1996) Mikić, Z., & Linker, J. A. 1996, in Solar Wind Eight, Proceedings of the Eighth International Solar Wind Conference, AIP Conference Proceedings 382. Woodbury, New York, ed. D. Winterhalter, J. T. Gosling, S. R. Habbal, W. S. Kurth, & M. Neugebauer, 104
- Mikić et al. (1999) Mikić, Z., Linker, J. A., Schnack, D. D., Lionello, R., & Tarditi, A. 1999, Phys. of Plasmas, 6, 2217
- (25) Rusin, V., M. Druckmuller, P. Aniol, M. Minarovjech, M. Saniga, Z. Mikić, J. A. Linker, R. Lionello, P. Riley, and V. S. Titov, 2010, Astron. & Astrophys., submitted.
- (26) Storini, M., Hofer, M.Y., & Sýkora, J. 2006, Adv. Space Res., 38, 912
- (27) Schrijver, C.J., Liu, Y. 2008, Sol. Phys. 252, 19
- (28) Smith, E. J., Balogh, A. 2008, Geophys. Res. Lett., 35, L22103
- (29) Wang, Y.-M., Sheeley, N. R., Jr. 2004, ApJ, 612, 1196
- (30) Zhao, X. P., P. H. Scherrer, and J. T. Hoeksema, 1999, J. Geophys. Res., 104, 9735