Spacing Characterization in Al-Cu Alloys Directionally Solidified Under Transient Growth Conditions
Abstract
We study spacing selection in directional solidification of Al-Cu alloys under transient growth conditions. New experimental results are presented which reveal that dendritic spacing versus solidification rate evolves in an almost step-wise fashion, consistent with previous theoretical predictions of Langer and co-workers. Phase field simulations of directional solidification with dynamical growth conditions approximating those in the experiments confirm this behavior. Changes in dendrite arm spacing is shown to be consistent with dendrite instabilities confined, initially, to sub-domains, rather than the entire system. This is due to the rapid variation in growth conditions, which prevent the system from adapting as a whole but, rather, in a succession of quasi-isolated domains.
I Introduction
Solidification microstructure is the starting point of any casting operation. Dendritic spacing and morphology established during casting often sets the scales of the downstream microstructure during manufacturing of alloys. This is particularly true in emerging technologies such as twin belt casting, where a reduced amount of thermomechanical downstream processing reduces the possibility of modifying microstructure length scales from that determined at the time of solidification.
Predicting columnar microstructure in cast alloys has been traditionally studied in the context of Bridgeman type directional solidification conditions. Most studies have focused on the problem of primary and secondary arm spacing in dendrite arrays of thin liquid films of organic alloys, directionally solidified under steady-state cooling conditions, i.e. a sample is pulled through a constant thermal gradient at a constant pulling speed. Careful experiments on steady state directional solidification reveal a reproducible correlation between spacing and pulling speed Trivedi:80 ; Kirkaldy:96 . Studies of steady state directional solidification have developed so-called geometric models to relate spacing to solidification processing parameters such as the pulling speed , thermal gradient and the alloy concentration .
In geometric theories of spacing selection the structure and mathematical form of the dendrite arms is first assumed and a subsequent consistency relation is derived for the arm spacing (also referred to as “wavelength” in the literature). The construction and assumptions that went into setting up the geometry of the dendrite array lead to at least one phenomenological parameter that is then fit to match the theory onto specific experimental spacing selection data Trivedi:83 ; Kirkaldy:97 ; Hunt:79 . While useful in helping to elucidate some aspects of spacing selection, such theories lack the fundamental element of microstructure predictability: the ability to self-consistently generate the morphology of the structure they are trying to predict anything about. It is also not clear how such theories hold up to a change of conditions away from those of the experiments they were constructed to model.
While steady state directional solidification is an important academic paradigm, it is not a realistic representation of the conditions prevalent during industrial casting, which normally occurs under rapidly changing growth conditions. Near a chill surface or, indeed, throughout the entire sample thickness in the case of very thin strips, the thermal gradient and solidification speed are neither constant nor independent of each other. Recognizing this, several research groups have attempted to extend geometrical models to include unsteady state processing conditions. For example, Garcia and co-workers Garcia:08 and Kirkaldy and co-workers Kirkaldy:97 have attempted to link the spacing of dendrite arms to the cooling rate . Once again, as with any geometric theory, phenomenological parameters are introduced to fit the model with experiments, although in this case the fits are not as good as in the steady state case.
The importance of transient thermal history processing conditions in establishing as-cast microstructures has been apparent since the theoretical work of Warren and Langer Langer:90 ; Langer:93 and the experimental studies of Losert and Huang Huang:99 ; Losert:96 on alloys of succinonitrile (SCN). Warren and Langer performed an analysis on the stability of dendritic arrays Langer:93 ; Langer:90 and showed that they remain stable to period doubling instability over a range of pulling speeds, contrary to the predictions of any geometric theory, steady state or transient. Their work suggested a band of available spacings rather than a unique selection. In turn, Huang et al Huang:99 showed that by changing the rate of the pulling speed it is possible to obtain different spacings for a given set of final growth conditions. Moreover, Losert et al Losert:96 observed that under a more gradual change in pulling speed the spacing still remained stable over a range of pulling speeds, consistent with the Warren and Lager predictions. They also noted the presence of a sharp increase in spacing which, consistent with the predictions of Warren and Langer, could be attributed to period doubling.
The results in the literature seem to point to two extremes. Under steady state conditions, i.e. , the dendrite arm spacing appears to scale as a power-law of the pulling speed , a result at least borne out qualitatively by geometrical models. On the other hand, under transient solidification conditions, dendrite spacing and structure seem to depend strongly on transient history and initial conditions, at least in the idealized setting of a linear stability analysis or for well controlled experimental SCN dendrite arrays. The lack of unified theory to explain both these regimes likely points to an incomplete picture of a fundamental physics underlying microstructure selection in solidification. It also points to the need for a robust theory and modeling formalism that predicts the evolution of dendritic morphologies and growth rate self-consistently, as function of only the input material parameters and cooling conditions, steady state or transient.
Phase field theory has emerged in recent years as promising candidate of a fundamental and self-consistent theory for modeling solidification microstructures. The first simulations to test spacing versus pulling speed in alloys date back to the work of Warren and Boettinger Boettinger:00 , who found a monotonic band of spacings versus pulling speed. The small system size used, however, precluded a quantitative comparison with experiments. Nowadays the phase field methodology has become more quantitative by “marrying” simulations of phase field models in the so-called thin interface limit Karma:01 ; Echebarria:04 with novel simulation techniques like adaptive mesh refinement Provatas:98 . A first step using phase field models to quantitatively model spacing in directional solidification was taken by Greenwood et. al Greenwood:04 in 2D and Dantzig and co-workers in 3D review:05 . These works modeled steady state directional solidification in SCN alloys and found very good agreement (in the 2D limit) with the 2D steady state spacing experiments. These studies suggested that, at least under steady state (i.e. Bridgeman growth) conditions and one type of initial condition (morphologically noisy initial interface), there could be a single crossover scaling function interpolating between the two power-law spacing regimes seen experimentally and modeled semi-empirically by geometrical models.
Despite the success of phase field modeling in predicting steady state spacing, as well as other steady state properties such as cell tip structure Sebastian:09 , the methodology has not been used systematically to explore spacing under transient solidification conditions. Indeed the ability to model cell, dendrite and seaweed structure, kinetic and surface tension anisotropy, different mobility, different thermal conditions and different initial condition makes phase field modeling an ideal theoretical test ground to explore transient spacing development and how it may relate to the steady structures.
This paper reports new experiments that study primary spacing selection in directionally solidified Al-Cu alloys cooled under transient conditions closely related to those encountered in strip casting of Al alloys. The transient thermal gradient and interface speed are measured and correlated to measured dendrite spacing. Our results are shown to be inconsistent with steady state or transient geometric theories. Instead they are more consistent with stable ranges of spacings versus front speed, connected by rapid changes in spacing at particular interface velocities. We also present new two dimensional phase field simulations that exhibit the same behavior as our experimental data. Analysis of the phase field simulations is used to shed some light on the morphological development of dendrite arms during solidification under transient conditions. In order to manage the length of this paper, a sequel paper to this one will further explore the theoretical implications of the phase fields simulations presented here, focusing in particular, on the theoretical connection between transient behavior reported in this paper to the steady state behavior previously reported.
II Experimental procedure
As-received Al-0.34wt%Cu samples were used to study solidification microstructure evolution under transient cooling conditions. The experimental set-up is shown in figure (1). It consists of a cylindrical stainless steel crucible that is water jet cooled from below to promote upward solidification. The crucible is shielded by a cylindrical alumina insulation with a thickness of about 10mm to prevent radial heat extraction. The inner, outer and bottom parts of the crucible were covered with a thin layer of sprayed boron nitride in order to reduce the heat extraction through the walls as well as providing a more uniform chilling surface at the bottom. The pressure of the spray was chosen high to prevents the formation of bubbles at the water-chilling wall interface due to the local vaporization.
The temperature is measured at different heights from the bottom with K-type nickel-chromium based sheathed thermocouples that are tightened along a plate and are inserted into the melt through the top of the crucible as shown in the figure. The diameter of the chilling surface is set to 50mm (i.e. the bottom plate) and the thickness of the chilling surface to 3.5mm. The large chilling diameter helps to reduce the influence of the thermocouples’ diameter, about 1mm, on the solidification process. A set of thermocouples were aligned in the axial (vertical) direction starting at 1mm away from the chilling surface and separated from each other by 1mm. In order to ascertain the one dimensionality of the heat flow in the vertical direction, an additional thermocouple was positioned 12mm radially from the aligned thermocouples.
The output from the thermocouples is acquired through a NI SCXI-1600 data logger and the calibration of which was set at the melting point of pure aluminum and pure zinc. Before pouring the melt into the crucible, the crucible along with the surrounding insulation and the alloy were heated in the same furnace to a temperature of 1.1 times the liquidus temperature of the alloy, to compensate for the heat loss during the experiment.
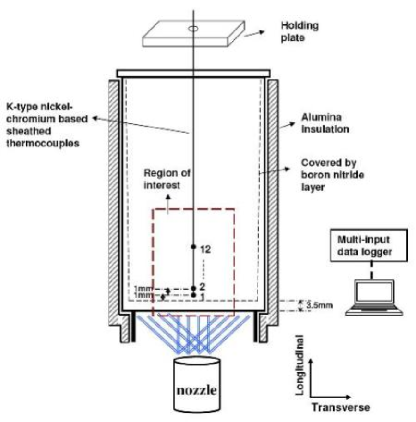
The cooling curves obtained from the thermocouples define a region of radially uniform temperature that varies essentially in the growth direction. This region is referred to as our region of interest. Outside this region, there is a temperature gradient towards the wall such that the unidirectional heat flow breaks down. Far from the bottom chilling plate, outside the region of interest, the solidification microstructure mostly consists of equixed dendrites. Within our region of interest the solidification microstructure is columnar in nature (i.e. oriented cells, dendrites or seaweed branches). We disregard any data outside our region of interest. As will be shown below, the grains examined within the region of interest are large enough in the direction transverse to the heat flow to disregard boundary effects. Only data from grains with transverse size larger than 1 are reported here. In each sample solidified, three different directionally solidified grains emanating from the chill surface were analyzed for reproducibility and to provide statistical error bars we report in our results.
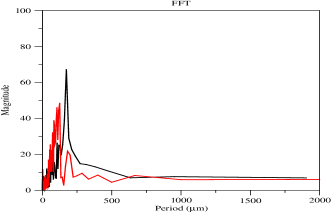
Figure (2) shows the longitudinal morphology of the dendrite microstructure cut out from a grain in one of our samples. The microstructure appears cellular in nature, while there is some evidence of seaweed-like tip-splitting throughout the image. The microstructural length scale in the direction transverse to that of the heat flow (right to left in the figure) was analyzed at different distances from the chilling surface using power spectral analysis. A typical power spectrum is shown in the bottom frame of figure (2). The x-axis of the power spectrum denotes the frequency of the corresponding wave vector. The main peak is associated to the primary spacing and is consistent with would be obtained by the ASTM line intersection method. The smaller, high frequency, peaks account for smaller wavelengths such as sidebranches, splitting tips or the discreteness of the pixels in an image. The smaller frequency peaks correspond potentially to longer-wavelength interactions between dendrites branches.
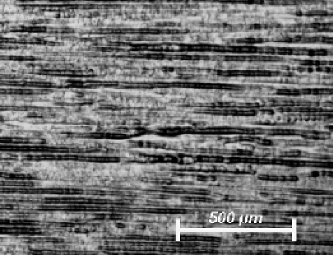
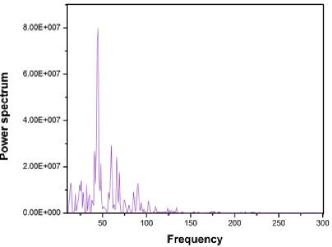
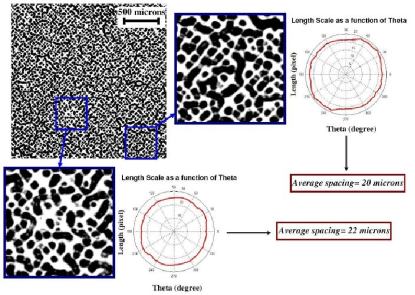
Figure (3) shows a typical image of the corresponding transverse microstructure, cut away from a grain at distance 15 from the chilling surface. The bottom frame of figure (3) shows a polar plot showing the average length scale versus angle in the data in the top frame, obtained from a digitization of the corresponding cross section in the top frame.
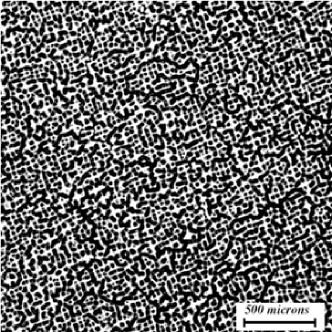
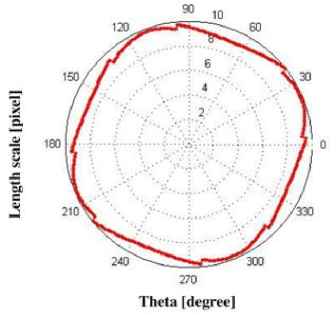
The polar plot was obtained by averaging the two-point direct correlation function from
data such as that in the top frame of figure (3) along lines of different orientation.
The polar –or “rose”– plot in figure (3) represent the mean inter-branch
spacing in the data along different orientations. Details of the procedure by which the
polar plot is constructed can be found in Kuchnio:09 .
III Phase Field Modeling
Phase field simulations modeled the Al-Cu alloy system in the dilute limit of the phase diagram, which comprises straight solidus and liquidus lines of slopes of and , respectively. The equilibrium interface concentration jump at any temperature is thus given by partition relation , where () is the molar concentration of impurities at the solid (liquid) side of the interface, and is the partition coefficient.
Simulations formally neglected the latent heat by imposing the temperature field by the form , where , a reference temperature, while and are the local thermal gradient and pulling speed, respectively. These were extracted from our experiments as discussed further below. We neglected convection in the liquid, as the transport of impurities becomes governed essentially entirely by diffusion Hongda:09 . Moreover, since diffusion of impurities in the solid is typically several orders of magnitude lower than in the liquid, diffusion in the solids is neglected.
Under the above assumptions, mass conservation across the interface takes the form , where is the solute diffusion coefficient in the liquid and is the partial derivative in the direction normal to the interface, taken on the liquid side. The temperature at the interface, which is assumed to be in local equilibrium, is given by the Gibbs-Thomson relation , where is the melting temperature of the pure material, is the Gibbs-Thomson coefficient, is the interfacial free energy, the latent heat of fusion per volume, is the interface curvature, is the normal interface velocity and is the atomic mobility at the interface.
The underlying crystalline structure that defines the anisotropy of surface tension (or interface mobility) is modeled by through a commonly used fourfold symmetry anisotropy function , where is the anisotropy strength and is the unit normal at the the interface. In two dimensions this function can be re-written as , where is the angle between the normal direction to the interface and an underlying crystalline axis (e.g in a cubic crystal).
Taking as reference the concentration on the liquid side of the interface (where is the average alloy concentration), the following standard one-sided sharp interface directional solidification kinetics are modeled:
| (1) | |||
| (2) | |||
| (3) |
where is the solutal capillarity length, the freezing range, the thermal length, and the kinetic coefficient.
The phase-field model employed to emulate Eqs. (1)-(3) is designed for quantitative simulations through the use of a thin interface analysis developed by Karma and co-workers Karma:01 ; Echebarria:04 . This analysis makes it possible to emulate a specified capillary length and kinetic coefficient to second order accuracy in the ratio of the interface width to capillary length. The details of this model have been presented and discussed at length in Refs. Karma:01 ; Echebarria:04 and thus only a brief description is included below. A general review of the phase-field method can be found in Boettinger:02 ; review:05 .
A scalar phase field parameter is employed, which takes on a constant value in each phase and varies sharply but smoothly across a diffuse interface. The phase field is used to interpolate the free energy density and mobility between the bulk phases. Its equation of motion guarantees the system evolves towards a minimum of the free energy of the system. We define a phase-field variable which takes the value in the solid (liquid). The concentration is characterized by through a generalization of the field , which represents the local supersaturation with respect to the point , measured in units of the equilibrium concentration gap at that temperature. This generalized supersaturation field is given by
| (4) |
In term of the fields , and , the phase-field model referred to above is given by
| (5) | |||||
| (6) | |||||
where is the interface position, defines the unit vector normal to the interface, is the phase-field orientation dependent relaxation time and imposes a fourfold anisotropy with strength in two dimensions. The function dictates how the diffusivity varies across the interface. The interface thickness is given by while is treated as numerical convergence parameter of the model.
The parameters , and can be shown to be inter-related through the thin interface relations developed in Refs. Karma:01 ; Echebarria:04 to map the above phase field model onto Eqs. (1)-(3) . Specifically, once a particular lambda is chosen, the thin interface relations establish a unique choice of and such as to yield the same and in simulations. The aim is to choose a rather diffuse value of in order to expedite numerical efficiency. In this work, we assume the interface kinetics coefficient , to lowest order. This ability to quantitatively model the same materials parameters and is largely due to the term containing the constant in Eq. (6). The term is called the so-called “antitrapping current”, whose function is to self-consistently counter the spurious effects of an interface thickness that is artificially enlarged for practical purposes.
The material parameters employed represent an Al-Cu alloy and are presented in table 1.
| () | |
|---|---|
| () | |
| () | |
| () | |
We solve the phase field equations using either a finite difference explicit Euler scheme on a uniform mesh, or, for simulations on larger scale, with a new finite difference adaptive mesh algorithm that utilizes a data structure developed Provatas and co-workers Provatas:98 ; Athreya:07 .
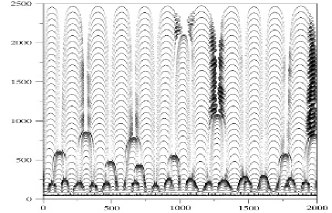
Figure (4) shows an example of a typical sequence of directionally solidified dendrite arms growth under steady state conditions, i.e. a constant thermal gradient () and puling speed (). In order to systematically study the evolution of interface structure, and, in particular, the selection of the columnar microstructure spacing, we also perform a power spectral analysis on simulated interface profiles using a Fast Fourier transform. An example of such evolution is also shown in figure (4). It is noted that the emergence of a split in the main peak of the spectrum at the earlier stage reveals the interaction between dendrites that eventually leads to cell elimination.
The phase field model was primarily used to simulate transient cooling conditions relevant to the experimental situation described in section (II). This was done by using the thermocouple data to extract the local thermal gradient across the solid-liquid interface and the effective velocity of the solidification front, which were then fitted to provide functions used to determine and . The pulling speed was modeled after a fit of the front velocity obtained from experiments which, given that the interface is initially positioned at , is systematically lower than the actual front velocity, the discrepancy decreasing as the system evolves. Further details about this are discussed in section (IV.3).
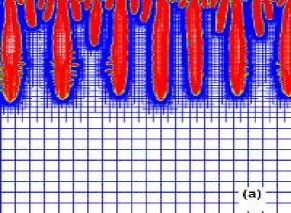
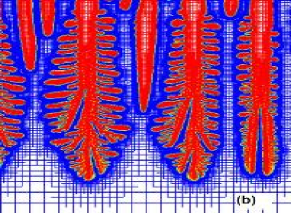
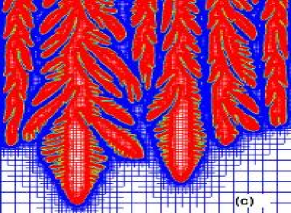
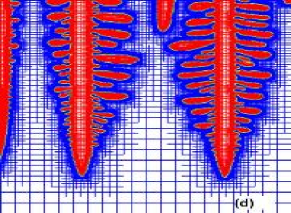
Figure (5) shows a typical spatiotemporal evolution of dendritic microstructures from our transient dynamic simulations. The morphological evolution has features in common with the experimental morphology in figure (2). Specifically, at early times, when the velocity is fastest, the morphology is cellular and then starts to exhibit a series of kinetically-induced tip-splitting instabilities, giving rise to rising columns of seaweed-like structures. At later times, when the velocity decreases, the cellular branches emerge once more. The analysis of our phase field simulations and the experimental data of section (II) is discussed below.
IV Results and Discussion
IV.1 Finite Size Effects
In order to avoid boundary effects on the dendrite arm spacing, we study arm spacing in as large a single grain as possible. The simulations, on the other hand, are more time consuming for larger systems. To estimate a convinient grain (or system) size to use experimentally and theoretically in our spacing selection analysis, we studied the dependence of dendrite spacing on the system size in phase field simulations with constant control parameters. Figure (6) shows the final steady state spacing as a function of transverse system size (i.e. grain size) for four different puling speeds. In all cases we started with a morphologically noisy interface.
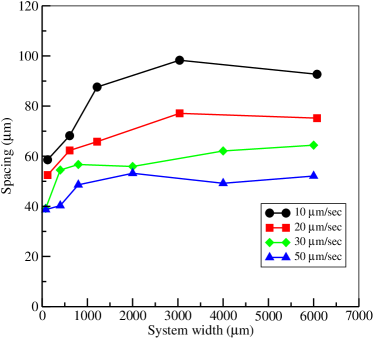
These results indicate boundary effects become negligible at systems (grain sizes) larger than about , even for the smallest rate of solidification, which leads to the largest spacing. The solidification rates studied experimentally and theoretically in the transient solidification analysis below are higher than those studied here, making finite size effects even more negligible in systems of or larger.
IV.2 Dendrite spacing evolution: experiments
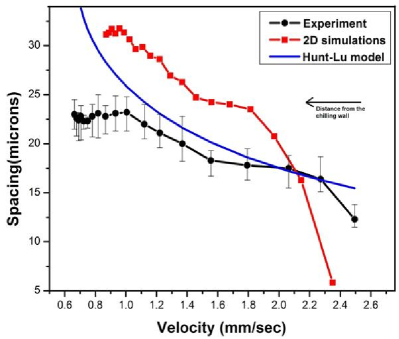
Figure (7) shows experimental (black curve) and simulated (red curve) plots of the transverse dendrite spacing as a function of the front velocity, which varies during solidification. Also shown for comparison is the corresponding primary arm spacing determined from the unsteady state model of Hunt and Lu Hunt-Lu:96 (blue curve). In the experiments, temperature gradient is coupled with the velocity and are not independent. The solidification rate is obtained from the cooling curves by considering that a thermocouple registers a sharp change in the temperature slope (with respect to time) when the solidification front passes through it. The experimental spacing shown is that obtained from transverse sections. Analysis of the longitudinal sections shows the same qualitative behavior, although the values are different, as expected. It is recalled that the experimental spacing data is obtained from different grains of the same experiment.
The experimental results in figure (7) are consistent with those reported by Losert et al Losert:96 . Namely, the spacing exhibits regions of very slow change, between which it changes rapidly. It is noteworthy that the experimental data does not compare well quantitatively and, especially, qualitatively with the unsteady state model of Hunt and Lu. Plausible reasons for this will be addressed in section (V).
Losert et al associate a rapid change or jump in spacing with the period doubling instability studied by Warren and Langer, citing boundary effects to account for the discrepancy of the jump being less than a factor of two. We propose that the discrepancy is also due to the fact that instabilities do not affect the system as a whole but are confined to smaller domains. The solute field ahead of the interface is not periodic and a localized disturbance has to propagate along the front before affecting other regions. Hence there is a delay between an instability in one region and its consequences to farther away dendrites. The spacing at any given time is thus the average of spacing in different domains, rather than a consequence of an instability affecting the system instantaneously. We examined this hypothesis in our experiments by examining different regions of a single transverse section at a specific position away from the chilling surface. Regions with different average spacing are found, consistent with our hypothesis. Figure (8) shows two separated regions within same transverse section of a grain which have different average spacing.
IV.3 Dendrite spacing evolution: simulations
In order to approximate the growth conditions similar to those in our experiments, our directional solidification simulations included a variable thermal gradient and pulling speed, the values of which were set by fitting the corresponding curves obtained from experiments. Of-course, the pulling speed is not the same as the front velocity, especially under transient effects, since the interface moves within the coexistence region as growth conditions vary. This discrepancy is largest at the onset of the simulation due to the initial conditions.
The two dimensional simulations in figure (7) show remarkably similar behavior to the experiments, consistent with the idea that the branch spacings are confined to a band of slowly varying spacing separated by rapid change at particular velocities. The quantitative discrepancies between experiments and numerical results are to be expected due to the different growth conditions of the simulations compared to the experiments and that the simulations are two dimensional.
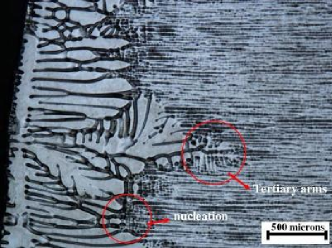
It is noteworthy that the mean peak of the power spectra of the simulation data essentially captures the main branch spacing and not the seaweed-like sub-structure evidenced in figure (5). The latter structures are present at early and intermediate times and likely arise due to interface kinetics induced by the high solidification rate. As mentioned above, these structures appear in the experimental data as well (see figure 2). To illustrate this further, we cooled a sample at very low rate for a short period of time an then increased the cooling rate abruptly. The resulting microstructure is shown in figure (9). At low cooling rate, where the microstructure is larger, the microstructure comprises both cellular and seaweed-like tip splitting and side branching. After the cooling rate is increased, a finer structure emerges from the tips of these tertiary branches as well as nucleation events.
V Mechanisms for Spacing Evolution
The initial pulling speed implies the diffusion length is several orders of magnitude smaller than the system width. Moreover, even though the pulling speed decreases with time, the diffusion length stays several orders of magnitude below the system size. At the same time, the diffusion length is within an order of magnitude from the dendritic spacing. Therefore, each dendrite branch can be considered to be in one of many, weakly interacting, sub-arrays of branches. The change in cooling conditions, on the other hand, is a global event that affects the whole system at the same time. It is therefore to be expected that the quasi-independent sub-arrays of branches will react differently to the globally changing cooling conditions. As a result, each sub-array may undergo instabilities –to some extent– independent from each other. This will influence the ”jumps” in the spacing versus velocity curve. The rate of change in the cooling conditions may also play an important role, as the change in the global cooling conditions may cause the solute field associate with different regions to transfer information to neighbouring regions at different times.
For a small number of dendrites branches in a system, the larger the change in the spacing due to a given branch elimination event. Conversely, a large enough system, or smaller the spacing, should exhibit a smoother evolution of spacing. For the transient conditions we explored, there appears to exist quasi-independent domains which undergo instabilities without, for the most part, affecting each other. After an instability, such as cell elimination, affects one, or several, entire domains, the average interdendritic spacing of the entire system will experience a sharp change. On the other hand, we also expect periods of low latency in which the overall spacing does not change, or evolves very slowly, while the different regions slowly interact through diffusion of the solute field. These observations are consistent with our findings and also with those of Losert et al Losert:96 , in which he changed the pulling speed in steps and found a sharp jump in the spacing after it went almost unchanged for a range of pulling speeds.
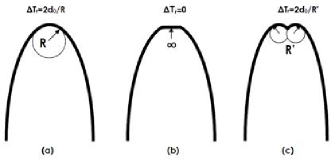
The existence of plateaus connected by rapid changes in spacing points to a dynamics in which an energy barrier has to be overcome for the spacing to adapt. Specifically, for the tip of a cell or branch to split, it effectively needs to pass through a flattening stage in which the tip radius becomes effectively infinite. This lowers the interface undercooling (i.e. the contribution of dendrite tip curvature to interface undercooling, , becomes zero), preventing tip splitting until a larger local interface velocity is reached. Increasing the velocity reduces the diffusion length and shortens the distance over which solute is rejected. This effect acts to reduce arm spacing. Hence, there will be a competition between the two effects, keeping the spacing constant due to the first effect until the driving force provided by second phenomenon is large enough to force dendrites or cells to split and reduce their spacing. Figure (10) schematically represents the stages of tip splitting.
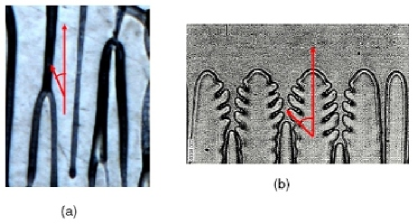
An increase in branch spacing via cell elimination occurs when a dendrite is blocked by either the secondary arms (in low speed solidification) of an adjacent dendrite or by the main stalk (in high speed solidification) of an adjacent dendrite. As shown in figure (11), in both cases, the seizing arm grows at an angle with a velocity component perpendicular to the growth direction of the primary arms (which is the direction of lowest energy, obtained as the product of anisotropy direction and heat flow direction). Unlike equiaxed growth, where secondary arms grow at a rate comparable to the growth rate of primary arms, in directional solidification the growth rate of secondary branches is negligible compared to that of the main trunks. Thus, the seizing mechanism described above is not able to act until diffusion-mediated interactions through the melt become significant. As growth velocity decreases, solute diffuses a longer distance and if the diffusion length of a dendrite is large enough, it interacts with adjacent diffusion fields. It is at this point that a jump in system energy can occur.
Hence, in the case of cell elimination, there is an energy increase due to the growth in any of the undesired directions and an energy decrease for changes that increase the distance between dendrites (i.e. characterized by non-interacting diffusion fields). These two phenomena dynamically compete, with the spacing change eventually determined by the dominant effect, where the former effect acts as a barrier against the change in the spacing and the latter provides the driving force for cell elimination. It is also plausible that over a small range of cooling conditions (i.e. solidification rate, temperature gradient) these effects may balance each other, causing the spacing not to change very much, at least over some long-lived transient time (i.e. the plateau regions in the data). Furthermore, the farther from steady state spacing the initial condition of the system, the higher the energy and the larger the driving force required for the system to perform branch elimination. Thus, it is possible that different spacings can also exist at the same cooling conditions depending on the history of the system. This matter will be further investigated in future work.
VI Acknowledgments
We would like to thank the National Science and Engineering Research Council of Canada (NSERC) and Novelis Inc for financial support of this work.
References
- (1) Trivedi R., Theory of dendritic growth during the directional solidification of binary alloys., Journal of Crystal Growth, 49, n2, 219-32 (1980)
- (2) Bouchard D. and Kirkaldy J. S., Prediction of dendrite arm spacings in unsteady-and steady-state heat flow of unidirectionally solidified binary alloys., Metallurgical and Materials Transactions B, 27B, n1, 101-13 (1996)
- (3) Somboonsuk K., Mason J.T. and Trivedi R., Interdendritic spacing. Part I. Experimental studies., Metallurgical transactions. A, 15A, n6, 967-975 (1983)
- (4) Bouchard D. and Kirkaldy J. S., Prediction of dendrite arm spacings in unsteady-and steady-state heat flow of unidirectionally solidified binary alloys., Metallurgical and Materials Transactions B, 28, n4, 651-663 (1997)
- (5) Hunt J. D., Solidification and casting of metals, Cellular and primary dendrite spacings., The metals society, London, 3 (1979)
- (6) Cante M. V., Spinelli J. E., Ferreira I. L., Cheung N. and Garcia A., Microstructural Development in Al-Ni Alloys Directionally Solidified under Unsteady-State Conditions., Metallurgical and Materials Transactions A, 39A, 1712-26 (2008)
- (7) Warren J. A., Langer J. S., Stability of dendritic arrays., Physical Review A,42, n 6, 3518-25 (1990)
- (8) Warren J. A. and Langer J. S., Prediction of dendritic spacings in a directional-solidification experiment., Physical Review E, 47, n4, 2702-12 (1993)
- (9) Lin X., Huang W., Feng J., Li T. and Zhou Y., History-dependent selection of primary cellular/dendritic spacing during unidirectional solidification in aluminum alloys., Acta Materialia, 47, n11, 3271-80 (1999)
- (10) Losert W., Shi B.Q., Cummins H.Z. and Warren J.A., Spatial period-doubling instability of dendritic arrays in directional solidification., Physical Review Letters, 77, n5, 889-91 (1996)
- (11) Boettinger W. J. and Warren J. A., Journal of Crystal Growth 200, 583 (2000)
- (12) Karma A.,Phase-field formulation for quantitative modeling of alloy solidification, Physical Review Letters 87, 115701/1-4 (2001)
- (13) Echebarria B., Folch R., Karma A. and Plapp M.,Quantitative phase-field model of alloy solidification, Physical Review E 70, 061604 (2004)
- (14) Athreya B. P., Goldenfeld N., Dantzig J. A., Greenwood M., Provatas N., Adaptive mesh computation of polycrystalline pattern formation using a renormalization-group reduction of the phase-field crystal model., Physical Review E,76, n5, 056706/1-14 (2007)
- (15) Greenwood M., Haataja M. and Provatas N., Crossover scaling of wavelength selection in directional solidification of binary alloys., Physical Review Letters, 93, n24, 246101/1-4 (2004)
- (16) Provatas N., Greenwood M., Athreya B., Goldenfeld N. and Dantzig J., International Journal of Modern Physics B 19, 4525 (2005)
- (17) Gurevich S., Karma A., Plapp M. and Trivedi R., Phase-field study of three-dimensional steady-state growth shapes in directional solidification., Physical Review E, 80, 1 (2009)
- (18) Kuchnio P., Tetervak A., Watt C., Henein H., Provatas N., Quantification of rapidly solidified microstructure of Al-Fe droplets using correlation length analysis., Metallurgical and Materials Transactions A, 40, n1, 196-203 (2009)
- (19) Wang H., PhD thesis, McMaster University, Hamilton, ON, (2009)
- (20) Boettinger W. J., Warren J. A., Beckermann C. and Karma A., Phase-field simulation of solidification, Annual Review of Materials Research 32, 163 (2002)
- (21) Provatas N., Goldenfeld N., Dantzig J.,Efficient computation of dendritic microstructures using adaptive mesh refinement.,Physical Review Letters, 80, n15, 3308 (1998)
- (22) Hunt J. D. and Lu S. Z.,Numerical modeling of cellular/dendritic array growth: spacing and structure predictions.,Metallurgical and Materials Transactions A, 27A, n3, 611-623 (1996)
- (23) Private communications with W. Losert.