292\Yearpublication2007\Yearsubmission2006\Month10\Volume328\Issue3/4\DOI10.1002/asna.200610732
2007 Feb 28
Surface magnetic field effects in local helioseismology
Abstract
Using helioseismic holography strong evidence is presented that the phase (or equivalent travel-time) of helioseismic signatures in Dopplergrams within sunspots depend upon the line-of-sight angle in the plane containing the magnetic field and vertical directions. This is shown for the velocity signal in the penumbrae of two sunspots at 3, 4 and 5 mHz. Phase-sensitive holography demonstrates that they are significantly affected in a strong, moderately inclined magnetic field. This research indicates that the effects of the surface magnetic field are potentially very significant for local helioseismic analysis of active regions.
keywords:
Sun: helioseismology – Sun: magnetic fields – sunspots1 Introduction
The potential influence of the magnetic field at the surface on acoustic waves is somewhat controversial, but there is a growing consensus that surface magnetic effects should be considered and included in local helioseismic analysis of active regions (Braun 1997; Woodard 1997; Zhao & Kosovichev 2006; Braun & Birch 2006). The showerglass effect (Lindsey & Braun 2005a,b) is a recently suggested phenomenon, consisting of large amplitude and phase distortions of the surface wavefield due to magnetic fields in the photosphere. Lindsey & Braun (2005b) apply a correction for these effects based on the strong correlation between magnetic field strength and the phase perturbations. A peculiar enhancement of the phase perturbation is noted in the penumbra of sunspots, called the penumbral acoustic anomaly (Lindsey & Braun 2005a). The magnetic field in the penumbra is not as strong as in the umbra and this research attempts to quantify the phase perturbations produced specifically by inclined magnetic fields which characterize sunspot penumbrae.
This paper expands upon previous research by Schunker et al. (2005) and explores the effects that the inclined field within the penumbrae of two sunspots may have on acoustic waves originating below the solar surface. The analysis uses helioseismic holography (Sect. 2). Generally, in the quiet Sun, the “ingression” (the deduced amplitude of incoming acoustic waves from a surrounding pupil) and the observed surface signal agree well (Lindsey & Braun 2005a,b). In magnetic regions, a deviation of the amplitude and phase of the incoming acoustic waves is indicated. Schunker et al. (2005) demonstrated that there is a clear cyclic variation of the ingression phase with azimuthal angle within a sunspot penumbra, and the line-of-sight direction. It is suggested that the effect may be due to the process of mode conversion as discussed by Schunker & Cally (2006). It has also previously been established that mode conversion is able to simulate the observed acoustic absorption in inclined magnetic fields (Cally & Crouch 2003; Cally, Crouch & Braun 2005). This has encouraging prospects for explaining the observed penumbral and inclined field dependencies. Initially, a fast acoustic wave propagates up to the surface where it encounters the layer (where is the Alfvén speed and is the sound speed) and undergoes conversion to a fast (magnetic) wave and transmission to a slow (acoustic) wave. The amount of energy devoted to each depends on the attack angle between the path of the ray and the magnetic field where the conversion/transmission occurs (where ). It is thought that the slow acoustic wave is what may be contributing to the observed effect of Schunker et al. (2005), and that presented here (see also Schunker & Cally 2006; Cally 2007).
The sunspot analysis is done using full disk data from the Michelson Doppler Imager (MDI) (Scherrer et al. 1995) over a period of days as the sunspot crosses the solar disk. The data is tracked and Postel projected into data cubes for each day. This enables the penumbral magnetic field to be viewed from a varying line-of-sight at different heliocentric angles (one for each day of observation). The phase shift of the incoming acoustic waves is determined from the correlation of the incident acoustic wave (estimated using holography) and the surface velocity. Vector magnetograms obtained from the Imaging Vector Magnetograph (IVM) (Mickey et al. 1996), for both sunspots are used to determine the orientation and strength of the field in relation to the phase perturbation.
2 Holography
Based on observed surface signals helioseismic holography is able to detect subsurface wave speed variations (Lindsey & Braun 2000). The amplitudes of acoustic waves propagating through the interior are inferred at a focal point of particular depth, , and horizontal position, .
For this purpose the focal plane is located at the surface, . The inferred contribution of the observed waves is calculated through the interior and back up to the surface. The ingression is the superposition of the amplitudes of the incoming waves at and time ,
| (1) | |||||
which is calculated here at . The Green’s function represents the sub-surface disturbance at () resulting from a unit acoustic impulse originating at surface co-ordinates (). A Green’s function derived in a wave-mechanical formalism that includes effects for dispersion (Lindsey & Braun 2000), is used here. The computation is confined to an annulus or ‘pupil’ surrounding the focal point with inner and outer radius and respectively. Essentially, the ingression is what should result from the incoming acoustic waves propagating from the pupil to the focal point in the absence of perturbations.
The ingression at the focus, , is correlated with the surface velocity signal at to gauge the effect of any surface anomaly. This “local ingression control correlation” (Lindsey & Braun 2005a) is given as
| (2) |
where represents the temporal Fourier transform of the surface disturbance , is the temporal frequency, and is the temporal Fourier transform of the ingression. The asterisk denotes complex conjugation and the brackets indicate an average over a positive frequency range of 1 mHz centered at a certain frequency (here at either 3, 4 or 5 mHz). The effect of the surface perturbations is quantified by the phase of the local ingression correlation,
| (3) |
We employ observations of two mature, nearly axisymmetric sunspots. The observations of the sunspot in AR9026 span a time from 2000 June 3 to June 12, and the sunspot in AR9057 from 2000 June 24 to 2000 July 2. This allows different line-of-sight observations of the sunspots as they rotate from approximately East of the central meridian to about West of the central meridian. These sunspots were selected as they do not evolve significantly over the duration of the observations.
As Schunker et al. (2005) described, the full-disk MDI data were analyzed in 24 hour sets. For each day Postel projections were made, centered near the sunspots. From the temporal Fourier transform, the ingression was computed and correlated to the surface Doppler signal (Eqs. 1 and 3). The pupil size is Mm and Mm for the inner and outer radii respectively. At a frequency of 5 mHz, this pupil selects -modes with spherical harmonic degrees () and radial order () between 450 ( = 5) and 700 ( = 4). This pupil is also of a size to eliminate the majority of the active region signal when computing the correlation inside the penumbra. Simple analysis of the acoustic dispersion relation near the surface shows that , where is the solar radius, is the propagation angle from vertical and is the local sound speed. At 3, 4 and 5 mHz, and in the given range of , 10, indicating a primarily vertical propagation.
3 Ingression correlation phase
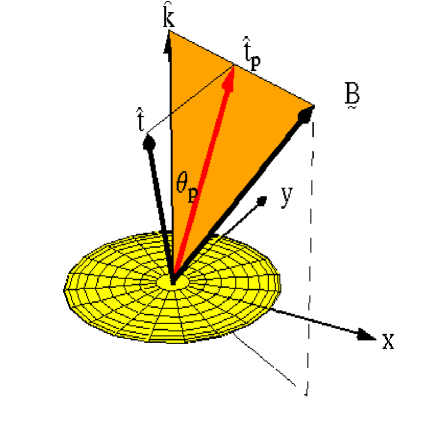
The penumbral regions for each sunspot, inner and outer radii, are determined from MDI continuum images as Mm from the centre of the sunspot in AR9026 and Mm for the smaller sunspot in AR9057. To determine the dependence of the phase shift (the ingression correlation phase) , on the line-of-sight direction projected onto the plane of the local magnetic field, a parameter is defined (see Fig. 1). The line of sight vector, , is projected onto the plane containing the radial vector, , and the magnetic field vector . The projected line-of-sight vector, , thus makes an angle with .
The magnetic field vector is determined from IVM magnetogram data. This provides the orientation and strength of the surface magnetic field in the sunspot. The IVM instrument observes in the same line as the MDI (Ni 676.8 nm), and hence at the same geometrical height in the photosphere. Rotation and scaling were applied to the data to align with the MDI magnetograms. The IVM observations were made during a 28 minute interval on 2000 June 5, for the sunspot in AR9026, and 2000 June 28, for the sunspot in AR9057.
It is desirable to investigate the acoustic properties of the magnetic field as functions of field strength and inclination. However, in sunspot penumbrae these quantities are not easily separable since the magnetic field strength exhibits a close nearly linear relationship with the inclination from vertical (see Fig. 4 of Schunker et al. 2005). As in Schunker et al. (2005), the penumbrae are divided into three roughly even bins, of , and . This corresponds to a mean magnetic field strength of 1900, 1400 and 600 Gauss for the sunspot in AR9026, and 1700, 1000 and 600 Gauss for the sunspot in AR9057, respectively.

The behaviour of the ingression correlation phase with respect to the projected line-of-sight for both sunspots, and several frequency bandpasses, are presented in Figs. 2 to 7. The last figure corresponds to Fig. 5 of Schunker et al. (2005), which showed only the results for one sunspot with waves averaged over a 1 mHz frequency bandpass centered at 5 mHz. The results for two sunspots averaged over a 1 mHz frequency bandpass centered at 3, 4 and 5 mHz demonstrates the consistency of the results for different spots and frequencies.

The horizontal dashed line is the average of over the entire range of . The error bars indicate the standard deviation of the mean over bins of 20 measurements in . The observed variation of with the projected line-of-sight angle is consistent with the conversion of vertically propagating acoustic waves to elliptical motion in the inclined magnetic field (Schunker et al. 2005). To quantify this, the variation of phase shift and amplitude (not shown) of the local ingression control correlations assuming elliptical motion, with the eccentricity, inclination and amplitude of the ellipses as free parameters in the fits is modelled. The models will be discussed in further detail elsewhere (see also Schunker 2006), but the results of the fits to are shown here to guide the eye. The solid line is a fit for all the displayed data, the dotted line is a fit for data straddling the magnetogram (2000 June 3–7 for the sunspot in AR9026, and 2000 June 24–28 for the sunspot in AR9057) and the dashed line is the fit for the remaining data. These alternate fits are shown to assess the consistency of the results over different time periods, since only a single set of IVM observations are used and it is assumed that the magnetic field is virtually static in time. The trends show similar properties for all time periods of the data.
The phase of the ingression correlation is seen to vary across the line-of-sight angle, from to , especially at stronger fields (or smaller inclinations). This variation progressively decreases at weaker fields. At stronger fields where the effect is most prominent, a slight dependency on frequency is observed in the two spots. At 3 mHz, increases by about as increases from and . At 5mHz, the increase in is about as determined by the fits.
4 Quiet-Sun control experiment
The Evershed effect is a steady outflow of km s-1 seen to occur along the penumbral fibrils of sunspots (Evershed 1909). Since this penumbral flow is roughly axisymmetric, its line-of-sight component may have a similar spatial dependence as the ingression correlation phase. For example, both quantities switch sign between the side of the penumbrae extending toward disk center and the side extending away from disk center. The question naturally arises as to whether the variation of phase may have non magnetic cause, and is perhaps related to the observed line-of-sight component of the Evershed flow. In fact, the Evershed flows increase with radial distance from the sunspot centre. The effect presented here, actually decreases with radial distance, and is most predominant close to the umbra. In addition, we do not expect a correlation between and the line-of-sight velocity, since the ingression is computed over a full annular pupil and should not be sensitive (to first order) to solar flows. Nevertheless, the possibility of some unknown physical relationship or instrumental, measurement, or analysis artifact should be tested.


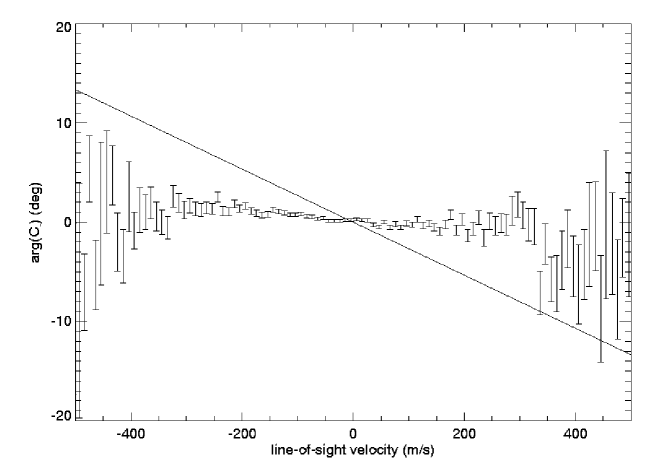
A control experiment was performed to assess any dependence of the ingression control correlation phases in the quiet Sun with the line-of-sight component of supergranulation, as determined from averages of full disk MDI Dopplergrams. This analysis must be done with care to remove all magnetic, including network, regions, which are characterized by downflows and may bias the result. In addition, large-scale spatial trends must be removed from the control correlation phases and the Dopplergrams, since only possible correlations over the size of a typical penumbrae are relevant to interpretations of the sunspot results. Figure 8 shows the resulting averaged ingression control correlation phase with line-of-sight velocity over a wide area of the solar disk. The solid diagonal line represents the expected phase shifts of supergranular flow if the hypothesis has merit. This assumes that the relationship between the phase shifts and flows is linear and must extrapolate to values consistent with what is observed within the two sunspots. The quiet-Sun phase shifts are clearly not consistent with this expectation. We believe that the Evershed effect does not significantly contribute to the effect described here and in Schunker et al. (2005).

5 Discussion and conclusions
The preliminary results first presented by Schunker et al. (2005) deserve confirmation and elaboration due to the implications of the results. Evidence for mode conversion in sunspots is critical for our understanding of the MHD of waves and sunspots (magnetohelioseismology). In addition, the surface effects of the magnetic field may alter the results of sub-surface imaging using helioseismology within active regions. Here, the results of Schunker et al. (2005) have been confirmed for a second sunspot, and it is also shown that the results are similar for all observed frequencies.
A frequency dependency is supported by the theory of Schunker & Cally (2006). A wave of lower frequency will experience the upper turning point at a lower depth than a higher frequency wave. Therefore it will not be strongly affected by the magnetic field. In regions of stronger field strengths, corresponding to the inner penumbrae, acoustic waves at 5 mHz are affected more by the magnetic field as seen in the observations presented here. However, it is not entirely clear why similar trends are not observed in the other regions of the penumbrae.
The effect is most prevalent in strong magnetic fields. Here, the observed variations correspond to travel time perturbations of approximately 1 minute at all observed frequencies between 3 mHz and 5 mHz. In comparison with travel times used to deduce sound speeds below sunspots this is considerable. Zhao & Kosovichev (2006) show evidence for a similar (but smaller, 0.4 minute) variation of travel times with azimuthal angle around a sunspot penumbra. However, their measurements were averaged over the entire penumbrae.

As it is shown here, the effect is highly dependent on the field strength, and is diminished in weaker and more inclined magnetic fields. However, whether this is due to the magnetic field strength or inclination is unclear, since in a sunspot the two properties are inseparable. Significantly, Zhao & Kosovichev (2006) also find a lack of variations in travel-times around the penumbra when they use MDI continuum intensity, rather than Dopplergrams. We note that the interpretation of Schunker et al. (2005), namely that these variations are caused by elliptical motion, would predict no variation with line-of-sight angle of scalar quantities such as the continuum intensity.
The Evershed effect may be eliminated as a major cause for the effect seen in the ingression control correlation. The ingression phase shift is larger closer to the umbra, whereas the Evershed effect is stronger close to the outer boundary of the penumbra. Line-of-sight supergranulation velocities do not show significant correlation with ingression phase shifts, which leads to the belief that what is being seen in penumbrae is likely a superficial variation in the ingression correlation phase with line-of-sight angle in magnetic fields.
These results have important implications for helioseismic calculations within active regions. The fact that there is such a dependence of the phase-shift with the line-of-sight suggests that this is predominantly a surface effect. Zhao & Kosovichev (2006) have argued that time-distance inversions do not significantly change with the variation of mean line-of-sight angle of sunspots from day to day. However, their inversions do not explicitly include or test effects of unresolved surface terms and so cannot directly answer the question of how the possible inclusion of those terms might change existing inferences about subsurface conditions. Theory and observations of waves in active regions will certainly aid in understanding and ameliorating the effects of surface magnetic fields with the goal to improve helioseismic interpretations of sunspot structure.
Acknowledgements.
The authors would like to thank Charlie Lindsey for his valued advice and guidance.References
- [Braun 1997] Braun, D.C.: 1997, ApJ487, 447
- [Braun & Birch 2006] Braun, D.C., Birch, A.C.: 2006, ApJ647, L187
- [Cally 2006] Cally, P.S.: 2007, AN, this volume
- [Cally, Crouch, & Braun 2003] Cally, P.S., Crouch, A.D., Braun, D.C.: 2003, MNRAS 346, 381
- [Crouch & Cally 2003] Crouch, A.D., Cally, P.S.: 2003, SoPh 214, 201
- [Evershed 1909] Evershed, J.: 1909, MNRAS 69, 454
- [Lindsey & Braun 2000] Lindsey, C., Braun, D.C.: 2000, SoPh 192, 261
- [Lindsey & Braun 2005a] Lindsey, C., Braun, D.C.: 2005a, ApJ620, 1107
- [Lindsey & Braun 2005b] Lindsey, C., Braun, D.C.: 2005b, ApJ620, 1118
- [Mickey et al. 1996] Mickey, D.L., Canfield, R.C., Labonte, B.J., Leka, K.D., Waterson, M.F., Weber, H.M.: 1996, SoPh 168, 229
- [Montesinos & Thomas 1997] Montesinos, B., Thomas, J.H.: 1997, Nature 390, 485
- [Scherrer et al. 1995] Scherrer, P.H., Bogart, R.S., Bush, R.I., et al: 1995, SoPh 162, 129
- [Schunker 2006] Schunker, H.: 2006, Thesis
- [Schunker et al. 2005] Schunker, H., Braun, D.C., Cally, P.S., Lindsey, C.: 2005, ApJ621, L149
- [Schunker & Cally 2006] Schunker, H., Cally, P.S.: 2006, MNRAS 372, 551
- [Woodard 1997] Woodard, M.F.: 1997, ApJ458, 890
- [Zhao & Kosovichev 2006] Zhao, J., Kosovichev, A.G.: 2006, ApJ643, 1317