Iron isotope effect on the superconducting transition temperature and the crystal structure of FeSe1-x
Abstract
The Fe isotope effect (Fe-IE) on the transition temperature and the crystal structure was studied in the Fe chalcogenide superconductor FeSe1-x by means of magnetization and neutron powder diffraction (NPD). The substitution of natural Fe (containing % of 56Fe) by its lighter 54Fe isotope leads to a shift of of 0.22(5) K corresponding to an Fe-IE exponent of . Simultaneously, a small structural change with isotope substitution is observed by NDP which may contribute to the total Fe isotope shift of .
pacs:
74.70.Xa, 74.25.Jb, 61.05.F-Historically, the isotope effect played a crucial role in elucidating the origin of the pairing interaction leading to the occurrence of superconductivity. The discovery of the isotope effect on the superconducting transition temperature in Hg [1] in 1950 provided the key experimental evidence for phonon-mediated pairing as formulated theoretically by BCS subsequently. The observation of unusually high ’s in the newly discovered Fe-based superconductors immediately raised the question regarding the pairing glue and initiated isotope effect studies. Currently, we are aware of two papers on isotope experiments with, however, contradicting results. Liu et al. [2] showed that in SmFeAsO0.85F0.15 and Ba0.6K0.4Fe2As2 the Fe isotope effect (Fe-IE) exponent,
| (1) |
reaches values of ( is the Fe atomic mass), while Shirage et al. [3] found a negative Fe-IE exponent in Ba1-xKxFe2As2. Note, that the only difference between the Ba1-xKxFe2As2 samples studied in Refs. [2] and [3] was the preparation procedure (low-pressure synthesis in [2] vs. high-pressure synthesis in [3]), while the potassium doping () as well as the ’s for the samples containing natural Fe ( K in [2] vs. K in [3]) were almost the same.
In this paper we study the Fe-IE on and on the structural parameters (such as the lattice parameters , , and , the lattice volume , and the distance between the Se atom and Fe plane, Se height ) for another representative of the Fe-based high-temperature superconductors (HTS), namely FeSe1-x. The substitution of natural Fe (containing % of 56Fe) by its lighter 54Fe isotope leads to a shift of of 0.22(5) K corresponding to an Fe-IE exponent of .
The 54FeSe1-x/56FeSe1-x samples (here after we denote natural Fe containing % of 56Fe isotope as 56Fe) with the nominal composition FeSe0.98 were prepared by a solid state reaction made in two steps. Pieces of Fe (natural Fe: 99.97% minimum purity, average atomic mass g/mol, or 54Fe: 99.99% purity, 99.84% isotope enriched, g/mol) and Se (99.999% purity) were first sealed in double walled quartz ampules, heated up to 1075oC, annealed for 72 h at this temperature and 48 h at 420oC, and then cooled down to room temperature at a rate of 100oC/h. As a next step, the samples, taken out of the ampules, were powderised, pressed into pellets, sealed into new ampules and annealed first at 700oC for 48 h and then at 400oC for 36 h, followed by cooling to room temperature at a rate of 200oC/h. Due to the extreme sensitivity of FeSe1-x to oxygen [4], all the intermediate steps (grinding and pelletizing) as well as the preparation of the samples for the neutron powder diffraction and magnetization experiments were performed in a glove box under He atmosphere.
The Fe-IE on the structural properties was studied by neutron powder diffraction (NPD) experiments by using the high-resolution powder diffractometer HRPT (Paul Scherrer Institute, Switzerland) [5]. The experiments were carried out at a wavelength Å. The 54FeSe1-x/56FeSe1-x samples, placed into vanadium containers, were mounted into a He-4 cryostat in order to reach temperatures between 5 and 250 K. High statistics data were taken at 250 and 5 K. Data at K were collected with intermediate statistics.
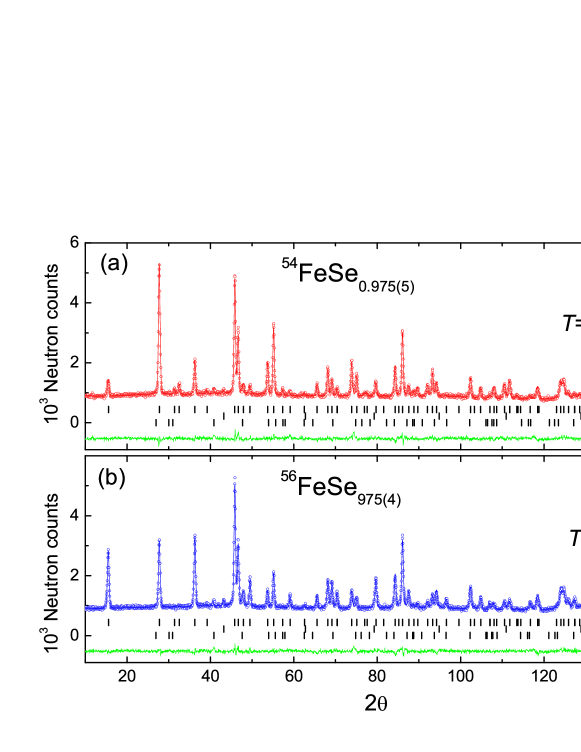
Figure 1 shows the NPD spectra taken at K. The differences in peak intensities, clearly visible at small , are caused by the different values of the coherent neutron scattering length () of natural Fe and that of the 54Fe isotope. The refinement of the crystal structure was performed by using the FULLPROF program [6] with m, m, and m [7]. The refined structural parameters at K and 5 K are summarized in Table 1. The amount of the impurity phases and the Se content (), determined for the data sets taken at K, were kept fixed during the refinement of the NPD spectra at lower temperatures. The mass fractions of impurity phases, the hexagonal FeSe () and Fe (), were found to be 0.50(10)%, 0.31(4)% and 1.13(18)%, 1.06(7)% for 54FeSe1-x and 56FeSe1-x, respectively.
| K | K | |||
|---|---|---|---|---|
| 54FeSe1-x | 56FeSe1-x | 54FeSe1-x | 56FeSe1-x | |
| Space group | ||||
| Se content | 0.975(5) | 0.975(4) | fixed to 0.975 | |
| (Å) | 3.77036(3) | 3.76988(5) | 5.33523(10) | 5.33426(10) |
| (Å) | 5.30984(10) | 5.30933(10) | ||
| (Å) | 5.51619(9) | 5.51637(9) | 5.48683(9) | 5.48787(9) |
| Volume (Å3) | 156.883(3) | 156.797(3) | 155.438(5) | 155.424(5) |
| Se | 0.2319(2) | 0.2326(0.3) | 0.2321(2) | 0.2322(3) |
| (Å2) | 1.02(2) | 0.93(2) | 0.44(2) | 0.36(2) |
| 3.11 | 2.93 | 4.13 | 3.63 | |
| 3.93 | 3.72 | 5.16 | 4.62 | |
| 3.13 | 3.05 | 4.73 | 4.03 | |
| 1.58 | 1.49 | 1.19 | 1.32 | |
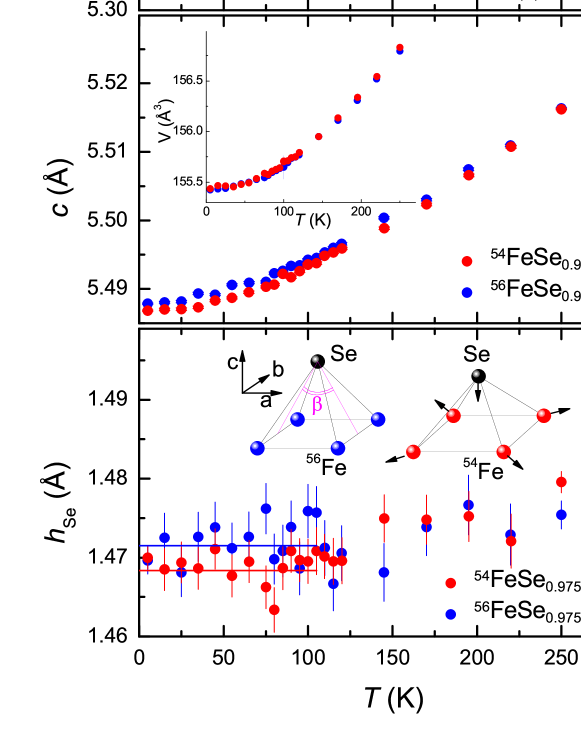
Figure 2 shows the temperature dependence of the lattice parameters , , and , the lattice volume , and the Se height of a representative 54FeSe1-x and a representative 56FeSe1-x sample (see Fig. 3). From Fig. 2a it is obvious that at K a transition from a tetragonal to an orthorhombic structure takes place, analogous to that reported in [4, 8]. The Fe-IE on the structural transition temperature could be estimated from the shift of the interception point of the linear fits to and in the vicinity of , as denoted by the arrows in the inset of Fig. 2a, which was found to be K. Within the whole temperature range (5 K250 K) the lattice constants and are slightly larger for 54FeSe1-x than those for 56FeSe1-x (see Fig. 2a). This is in contrast to the lattice parameter , which within the same range is marginally smaller for 54FeSe1-x than for 56FeSe1-x (Fig. 2b). The lattice volume remains, however, unchanged. Consequently, substitution of 56Fe by 54Fe leads to a small, but detectable enhancement of the lattice along the crystallographic and directions and a compression of it along the axis, resulting in a change of the shape of the Fe4Se pyramid, which is known to influence in Fe-based HTS [9, 10, 11]. This is shown in Fig. 2c where below 100 K the Se atom is located closer to the Fe plane in 54FeSe1-x than in 56FeSe1-x. The corresponding change of the Fe4Se pyramid is shown schematically in the inset of Fig. 2c. It is important to note that the observed Fe-IE’s on the lattice parameters are intrinsic and not just a consequence of slightly different samples. As shown in Ref. [4], various samples of 56FeSe1-x with and K indeed exhibit the same lattice parameters within experimental error.
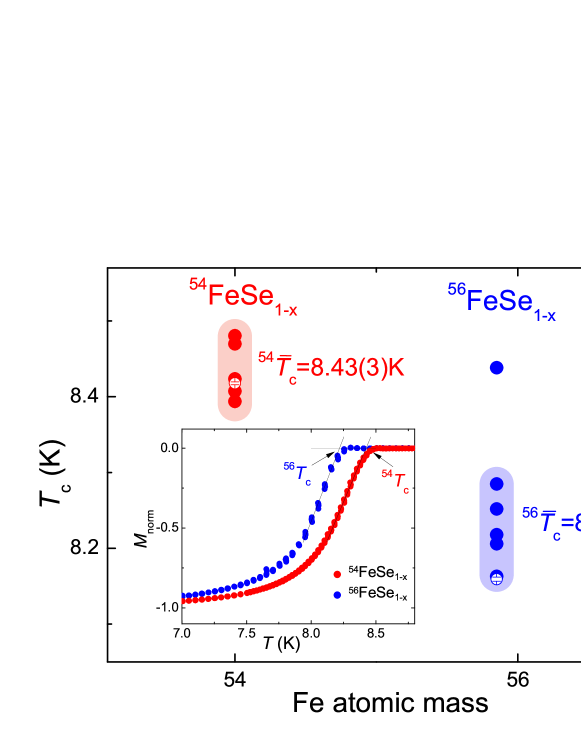
The Fe-IE on the transition temperature was studied by means of magnetization experiments. Measurements were performed by using a SQUID magnetometer (Quantum Design MPMS-7) in a field of mT for temperatures ranging from 2 to 20 K. In order to avoid artifacts and systematic errors in the determination of the isotope shift of it is important to perform a statistical study: i.e. to investigate series of 54FeSe1-x/56FeSe1-x samples synthesized exactly the same way (the same thermal history, the same amount of Se in the initial composition). The magnetization experiments were conducted for six 54FeSe1-x and seven 56FeSe1-x samples, respectively. The inset in Fig. 3 shows an example of zero-field cooled (ZFC) magnetization curves for a pair of 54FeSe1-x/56FeSe1-x samples ( was obtained after subtracting the small paramagnetic offset measured at and further normalization of the obtained curve to the value at K, see Fig. 1 in Ref. [4] for details). The magnetization curve for 54FeSe1-x is shifted almost parallel to higher temperature, implying that of 54FeSe1-x is higher than that of 56FeSe1-x. The resulting transition temperatures determined from the intercept of the linearly extrapolated curves with the line for all samples investigated are summarized in Fig. 3. The ’s for both sets of 54FeSe1-x/56FeSe1-x samples fall into two distinct regions: K and K, respectively. The corresponding mean values are: K and K. Note, that one out of the seven 56FeSe1-x samples had K which is by more than 5 standard deviations above the average calculated for the rest of the six samples. We have no explanation for this discrepancy, but decided to show this point for completeness of the data collected.
The Fe-IE exponent was determined from the data presented in Fig. 3 using Eq. (1), where the relative Fe isotope shift of the quantity is defined as (this definition of is used throughout the paper). With K, K, g/mol, and g/mol one obtains . Two points should be emphasized: i) The positive sign of the Fe-IE exponent is similar to that observed in phonon mediated superconductors, such as elemental metals [1] and MgB2 [12] as well as in cuprate HTS [13, 14] where the pairing mechanism is still under debate. Bearing in mind that a positive Fe-IE exponent was also observed in SmFeAsO0.85F0.15 and Ba0.6K0.4Fe2As2 [2], we may conclude that at least for three compounds representing different families of Fe-based HTS (1111, 122, and 11) the sign of the Fe-IE on is conventional. This suggests that the lattice plays an essential role in the pairing mechanism in the Fe-based HTS. ii) The Fe-IE exponent is larger than the BCS value as well as more than twice as large as reported for SmFeAsO0.85F0.15 and Ba0.6K0.4Fe2As2 [2]. Note that an enhanced value of the oxygen isotope exponent () was also observed in underdoped cuprate HTS [14] and was shown to be a consequence of the polaronic nature of the supercarriers in that class of materials [15]. Recently, Bussmann-Holder et al. [16] showed that in the framework of a two-band model polaronic coupling in the larger gap channel as well as in the interband interaction induce a (doping) dependent Fe-IE: increases strongly with reduced (doping), reaching at K. Note that a similar generic trend is observed in cuprate HTS [13, 14].
However, our structural refined NPD data suggest that part of the large Fe-IE may result from the tiny structural changes due to 54Fe/56Fe substitution. In the following we discuss a possible structural effect on the observed Fe-IE on . It is known that in FeSe1-x a decrease of the Se height caused by compression of the Fe4Se pyramid leads to an increase of by K/% [11, 17]. In contrast, an increase of the Se(Te)-Fe-Se(Te) angle in the FeSe1-yTey family (angle in our notation [18], see the inset of Fig. 2c) results for in a decrease of by K/% [10]. Based on the structural data presented in Fig. 2 one obtains % and %, leading to K and K (in this estimate the values of the lattice constants and , and were averaged over the temperature regions denoted as solid lines in Figs. 2a and c). Bearing in mind that all Fe-based HTS are similarly sensitive to structural changes as FeSe1-x (see, e.g., [9, 10, 11, 19]) we conclude that the shift of caused by tiny modifications of the crystal structure upon isotope exchange may contribute to the total Fe-IE exponent. However, the large errors of and do not allow a reliable estimate of this structural effect on the Fe-IE on . A better estimate of this effect can be made based on the empirical relation between and the lattice parameter for the 11 family FeSe1-yTey [10, 19]. Assuming that the relation is also valid for FeSe1-x one obtains from the data presented in Ref. [19] for the relation K/%. With % this gives rise to a structural shift of of K (the lattice constants and were averaged over the temperature regions marked as solid line in Fig. 2a). Taking this correction into account yields a rough estimate of the intrinsic Fe-IE exponent of . This value is comparable with reported for SmFeAsO0.85F0.15 and Ba0.6K0.4Fe2As2 [2].
To summarize, the 56Fe/54Fe isotope effects on the superconducting transition temperature and the crystal structure were studied in the iron chalcogenide superconductor FeSe1-x. The following results were obtained: (i) The substitution of the natural Fe ( g/mol) by the 54Fe isotope ( g/mol) gives rise to a pronounced Fe isotope shift of the transitions temperature as determined by magnetization measurements. The average is found to be K higher for the 54FeSe1-x samples as compared to the 56FeSe1-x samples resulting in a Fe-IE exponent of . (ii) The 56Fe/54Fe isotope substitution leads to an enhancement of the lattice constants and and a shrinkage of the lattice constant . These modifications do not affect the lattice volume. (iii) The tetragonal to orthorhombic structural transition temperature ( K) is the same for both 54FeSe1-x and 56FeSe1-x within the accuracy of the experiment. (iv) For temperatures below 100 K the distance between the Se atom and Fe plane (Se height) is smaller for the samples with 54Fe. This, together with the results of point ii), imply that 56Fe/54Fe isotope substitution leads to a compression of the Fe4Se pyramid along the crystallographic axis and an enhancement along the and directions. (v) The structural changes caused by 56Fe/54Fe isotope substitution induce a shift in which may reduce the value of Fe-IE exponent to , in fair agreement with obtained for SmFeAsO0.85F0.15 and Ba0.6K0.4Fe2As2 [2].
In conclusion, from magnetization experiments the Fe-IE exponent of for the FeSe1-x system was determined to be . The tiny changes of the structural parameters caused by isotope substitution may contribute to the total Fe-IE exponent, and may help to clarify or even be the origin of the previously reported controversial results [2, 3]. However, more detailed and systematic structural investigations on Fe isotope substituted samples are required in order to draw definite conclusions. Our findings, on the other hand, clearly show that a conventional isotope effect on is present which highlights the role of the lattice in the pairing mechanism in this new material class.
We would like to thank A. Bussmann-Holder for fruitful discussions and for the critical reading of the manuscript. This work was partly performed at SINQ (Paul Scherrer Institute, Switzerland). The work of MB was supported by the Swiss National Science Foundation. The work of EP was supported by the NCCR program MaNEP.
References
References
- [1] Maxwell E 1950 Phys. Rev. 78 477; Reynolds C A, Serin B, Wright W H and Nesbitt L B 1950 Phys. Rev. 78 487.
- [2] Liu L B, Wu T, Wu G, Chen H, Wang X F, Xie Y L, Yin Y L, Yan Y J, Li Y J, Shi Y J, Chu W S, Wu Z Y and Chen X H 2009 Nature 459 64.
- [3] Shirage X H, Kihou K, Miyazawa K, Lee C-H, Kito H, Eisaki H, Yanagisawa T, Tanaka Y and Iyo A 2009 Phys. Rev. Lett. 103 257003.
- [4] Pomjakushina E, Conder K, Pomjakushin V, Bendele M, and Khasanov R 2009 Phys. Rev. B 80 024517.
- [5] Fischer P 2000 Physica B 276-278 146.
- [6] Rodrí guez-Carvajal J 1993 Physica B 192 55.
- [7] http://www.ncnr.nist.gov/resources/n-lengths
- [8] Margadonna S, Takabayashi Y, McDonald M T, Kasperkiewicz K, Mizuguchi Y, Takano Y, Fitch A N, Suard E and Prassides K 2008 Chem. Commun. (Cambridge) 5607.
- [9] Zhao J, Huang Q, de la Cruz C, Li S, Lynn J W, Chen Y, Green M A, Chen G F, Li G, Li Z, Luo J L, Wang N L and Dai P 2008 Nature Materials 7 953.
- [10] Horigane K, Hiraka H and Ohoyama K 2009 J. Phys. Soc. Jpn. 78 074718.
- [11] Mizuguchi Y, Hara Y, Deguchi K, Tsuda S, Yamaguchi T, Takeda K, Kotegawa H, Tou H and Takano Y 2010 Supercond. Sci. Technol. 23 054013.
- [12] Budko S L, Lapertot G, Petrovic C, Cunningham C E, Anderson N and Canfield P C 2001 Phys. Rev. Lett. 86 1877; Hinks D G, Claus H and Jorgensen J D 2001 Nature 411 457.
- [13] Batlogg B, Kourouklis G, Weber W, Cava R J, Jayaraman A, White A E, Short K T, Rupp L W and Rietman E A 1987 Phys. Rev. Lett. 59 912; Franck J P, Jung J, Mohamed M A-K, Gygax S and Sproule G I 1991 Phys. Rev. B 44 5318.
- [14] Khasanov R, Shengelaya A, Di Castro D, Morenzoni E, Maisuradze A, Savic I M, Conder K, Pomjakushina E, Bussmann-Holder A and Keller H 2008 Phys. Rev. Lett. 101 077001.
- [15] Bussmann-Holder A and Keller H 2005 Eur. Phys. J. B 44 487.
- [16] Bussmann-Holder A, Simon A, Keller H and Bishop A R 2010 J. Supercond. Nov. Magn. 23 365; Bussmann-Holder A, Simon A, Keller H and Bishop A R arXiv:0906.2283.
- [17] Margadonna S, Takabayashi Y, Ohishi Y, Mizuguchi Y, Takano Y, Kagayama T, Nakagawa T, Takata M and Prassides K 2009 Phys. Rev. B 80 064506.
- [18] In the orthorombic phase there are two angles and which are different by at K.
- [19] Mizuguchi Y, Tomioka F, Tsuda S, Yamaguchi T and Takano Y 2009 J. Phys. Soc. Jpn. 78 074712.