A Hubble Space Telescope NICMOS and ACS Morphological Study of 2 Submillimetre Galaxies
Abstract
We present a quantitative morphological analysis using Hubble Space Telescope (HST) NICMOS - and ACS -band imaging of 25 spectroscopically confirmed submillimetre galaxies (SMGs) which have redshifts between –3.4 (). Our analysis also employs a comparison sample of more typical star-forming galaxies at similar redshifts (such as Lyman Break Galaxies) which have lower far-infrared luminosities. This is the first large-scale study of the morphologies of SMGs in the near-infrared at resolution ( 1 kpc). We find that the half light radii of the SMGs (rh=2.30.3 and 2.80.4 kpc in the observed - and -bands respectively) and asymmetries are not statistically distinct from the comparison sample of star-forming galaxies. However, we demonstrate that the SMG morphologies differ more between the rest-frame UV and optical-bands than typical star-forming galaxies and interpret this as evidence for structured dust obscuration. We show that the composite observed -band light profile of SMGs is better fit with a high Sersic index () than with an exponential disk suggesting the stellar structure of SMGs is best described by a spheroid/elliptical galaxy light distribution. We also compare the sizes and stellar masses of SMGs to local and high-redshift populations, and find that the SMGs have stellar densities which are comparable (or slightly larger) than local early-type galaxies, but comparable to luminous, red and dense galaxies at 1.5 which have been proposed as direct SMG descendants, although the SMG stellar masses and sizes are systematically larger. Overall, our results suggest that the physical processes occuring within the galaxies are too complex to be simply characterised by the rest-frame UV/optical morphologies which appear to be essentially decoupled from all other observables, such as bolometric luminosity, stellar or dynamical mass.
keywords:
galaxies: evolution – galaxies: formation – galaxies: high-redshift – sub-millimetre1 Introduction
Around 60% of the stellar mass in the local Universe is contained within early-type and elliptical galaxies, which sit on a tight “red sequence” in the colour magnitude diagram (Sandage & Visvanathan, 1978; Bower et al., 1992; Bell et al., 2003). Early-type and elliptical galaxies follow well known scaling relations (the fundamental plane) and exhibit systematic correlations between the absorption line strengths and velocity dispersion, . This age- relation is such that the most massive (400 km s-1) galaxies appear to have formed their stars 10–13 Gyr ago. By contrast the mean age of the lower dispersion galaxies (50 km s-1) formed more recently; 4 Gyr ago (e.g. Smith et al., 2007). This suggests that the stars in giant red galaxies formed early in the history of the Universe (eg. Nelan et al., 2005). Using deep near-infrared imaging, it has also become possible to extend the selection of red galaxies to higher redshift and identify massive, relatively old galaxies at which could be considered the progenitors of the local elliptical population (eg. van Dokkum et al. 2004; Cimatti et al. 2008). Clearly to probe this evolutionary sequence further, direct observations of the formation of the most massive galaxies at high-redshift are required. However, this has turned out to be a non-trivial exercise since the most actively star-forming, massive galaxies at 2 are also the most dust obscured (Dole et al., 2004; Papovich et al., 2004; LeFloc’h et al., 2009).
Nevertheless, mid- and far- infrared surveys (particularly those made with the 850m SCUBA camera on the JCMT and more recently with the Spitzer Space Telescope at 24m) have begun to resolve the most highly obscured populations into their constituent galaxies, determine their contribution to the energy density in the extra-galactic far-infrared/sub-mm background, and chart that history of massive galaxy formation (Smail et al., 2002; Cowie et al., 2002; Le Floc’h et al., 2005). Extensive, multi-wavelength follow-up has shown that these heavily dust-obscured, gas-rich galaxies lie predominantly at high redshift (; e.g. Chapman et al. 2003a, 2005), with bolometric luminosities of 1012L⊙ and star-formation rates of order 700 M⊙ yr-1. It has therefore been speculated that SMGs are the progenitors of luminous elliptical galaxies (e.g. Lilly et al. 1999; Genzel et al. 2003; Blain et al. 2004; Swinbank et al. 2006; Tacconi et al. 2008).
With the redshift distributions and contributions to the cosmic energy density of ultra-luminous galaxies reasonably constrained, the next step is to study the evolutionary history of SMGs, and to determine how they relate to lower luminosity galaxies. Indeed, given the apparently rapid evolution in the space density of ULIRGs from to (Chapman et al., 2005; Le Floc’h et al., 2005), one key issue is to understand the physical processes which trigger these far-infrared luminous events. Indeed, the mechanism responsible for these vigorous starbursts is still uncertain. Analogy to local ULIRGs would argue for merging as the trigger, although secular bursts in massive gas disks is also conceivable and indeed recent theoretical interest has stressed the importance of cold flows in high-redshift star formation (e.g. Genel et al., 2008). The suggestion that SMGs have compact disk-like gas reservoirs ( kpc) with “maximal starbursts” (Tacconi et al., 2008) hints that SMGs are scaled-up versions of the local ultra-luminous galaxy population, which are usually associated with merger activity (Tacconi et al., 2002).
In order to test the connection between SMGs, lower-luminosity star-forming galaxies at high redshift, as well as local ULIRGs, we have obtained high resolution Hubble Space Telescope (HST) imaging of a sample of spectroscopically confirmed SMGs at 0.7–3.4. By necessity, most morphological studies of high redshift galaxies to date have been performed at optical wavelengths which probe the rest-frame UV (Chapman et al., 2003b; Webb et al., 2003; Conselice et al., 2003b, 2008; Smail et al., 2004; Law et al., 2007b). However the rest-frame UV is dominated by radiation which traces the brightest, active star-forming regions rather than the bulk of the stellar population and can lead to late-type galaxies being classified as irregular systems (Dickinson et al., 2000; Thompson, 2003; Goldader et al., 2002). Nevertheless, in a recent study, Law et al. (2007b) conducted a detailed analysis of the rest-frame UV morphologies of a large sample of UV/optically selected star-forming galaxies at 1–3 in the Hubble Deep Field North (HDFN) and find evidence that dusty galaxies have more nebulous UV morphologies than more typical sources, but otherwise conclude that UV morphology is statistically decoupled from the majority of physical observables (such as stellar or dynamical mass, gas fraction or star-formation rate). Here we aim to extend this work to include the rest-frame optical emission to test whether there are key differences in the morphologies at longer wavelengths (as suggested by imaging of low redshift ULIRGs; e.g. Goldader et al. 2002). We have therefore assembled a sample of 25 SMGs with both HST ACS -band and NICMOS -band observations. We determine the basic morphological parameters of this sample of SMGs, as well as search for signs of tidal features and major mergers. To baseline our analysis we also use a sample of 228 optically selected star-forming galaxies at –3 (of which 53 have also been observed in -band with HST).
We use a WMAP cosmology (Spergel et al., 2003) with =0.73, =0.27, and H0=72 km s-1 Mpc-1. In this cosmology, at 2.1 (the median redshift of our SMG sample), 0.1 (the typical resolution of our observations) corresponds to a physical scale of 0.8 kpc. All quoted magnitudes are on the AB system unless otherwise noted.
2 Observations, Reduction and Analysis
2.1 SMG Sample
We used HST NICMOS during Cycle 12 (PID: 9506) to observe 23 galaxies spanning the redshift range from the spectroscopic catalog of Chapman et al. (2005). We also include in our analysis two spectroscopically confirmed SMGs from Borys et al. (2004) (see also Pope et al. 2005) which are part of the Chapman et al. (2005) sample and which lie in the GOODS-North (GOODS-N) field and were observed with NICMOS during program PID: 11082 (Conselice et al. 2010 in prep). Therefore the final sample consists of 25 SMGs with secure spectroscopic redshifts, and localized via VLA radio imaging.
The majority of the NICMOS targets also have optical coverage from HST as part of the same program from Cycle 12, although we also include archival data in the ELAIS field (PID: 9761) and GOODS Legacy program. Briefly, 20 galaxies have HST ACS imaging, four galaxies have WFPC2 observations, and one galaxy has STIS imaging. Unless otherwise stated, we will refer to the ACS, WFPC2, and STIS images as “optical”, and specifically the -band filter. In the case of the lone STIS image, no filter was used (hence the wavelength range covered is 5400–1m). We note that the sample spans a redshift range =0.7–3.4 (median redshift 2.1), 850m flux (3–15 mJy) and -band magnitude range (=21.5–26.5) which is representative of the parent sample of 73 SMGs in Chapman et al. (2005). We also note that there are roughly equal numbers for each bin (Table 1).
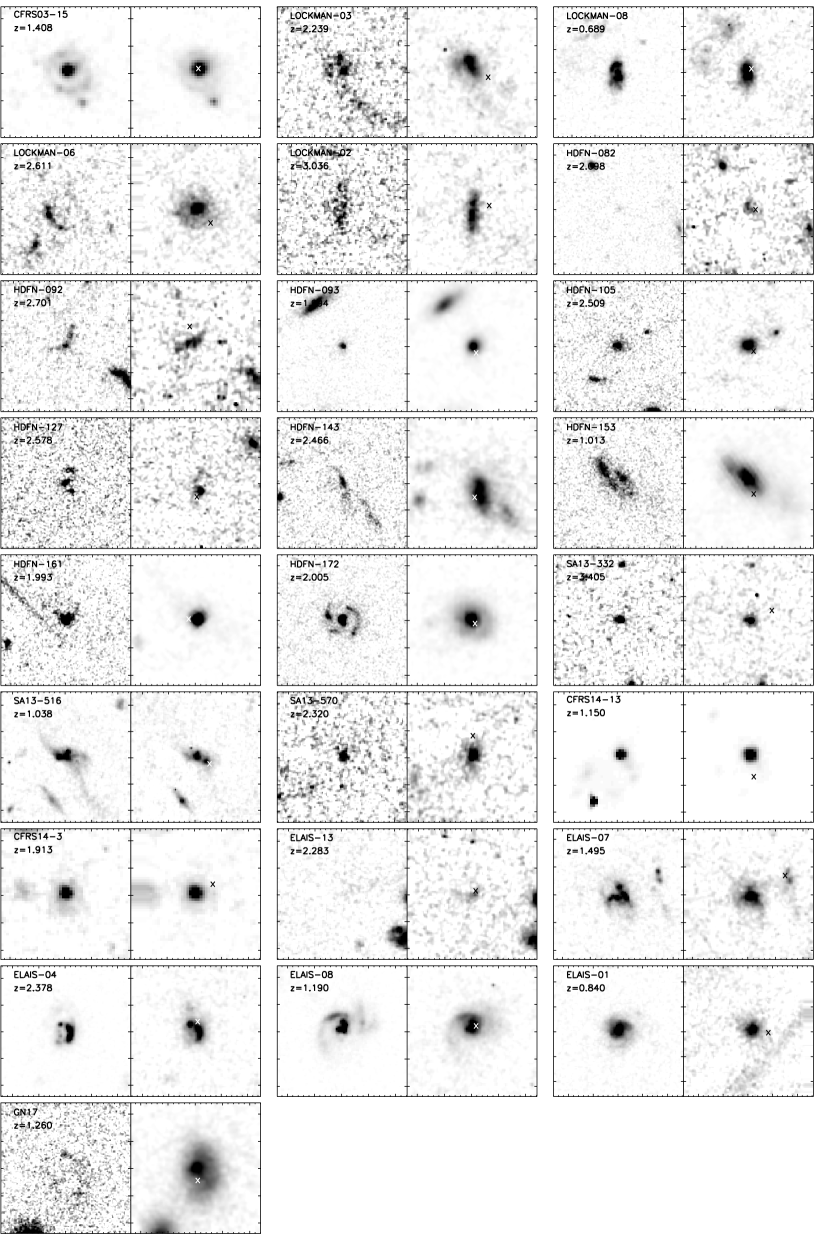
The near-infrared observations were made using the NIC2 camera and the F160W filter. We employed the standard spiral dither pattern under LOWSKY conditions. Each exposure was corrected for a pedestal offset, and then mosaiced together using the calnicb task in IRAF. Unfortunately several exposures were affected by the South Atlantic Anomaly (SAA), and extra processing steps were required111http://www.stsci.edu/hst/nicmos/tools/post_SAA_tools.html. The final images appear very flat and have very low cosmic ray contamination. The observed and -band images of each SMG in this sample are shown in Fig. 1.
2.2 Comparison Sample
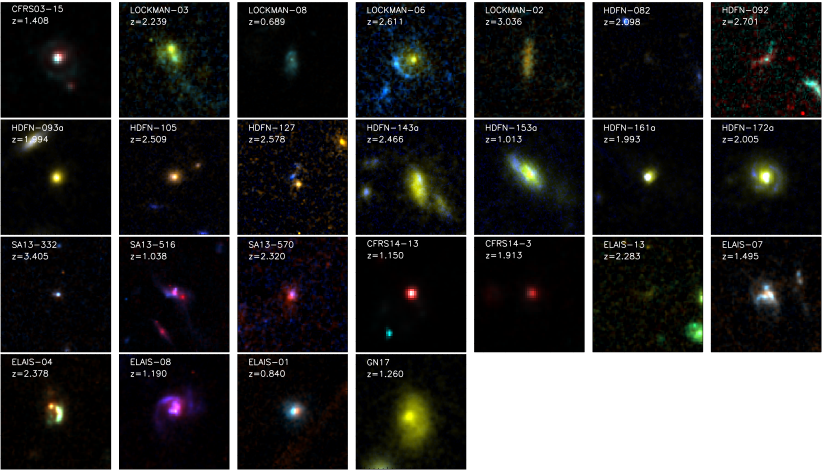
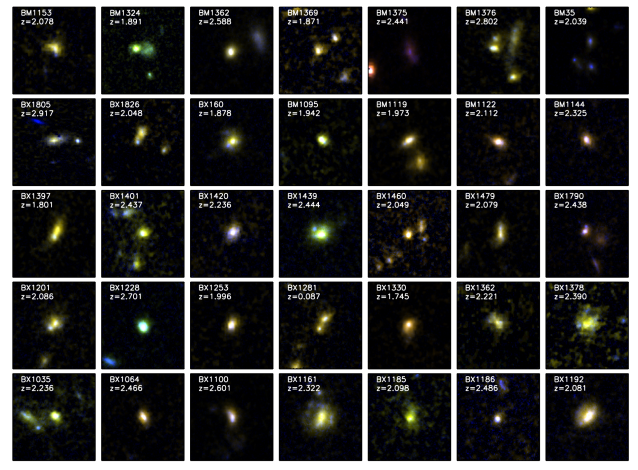
To construct a comparison sample, we exploit the extensive spectroscopy in GOODS-N. To act as a high redshift “field” sample, we use 2100 galaxies from Barger et al. (2008) between –3.5 of which 330 also lie within the GOODS-N NICMOS imaging (Conselice et al. 2010 in prep). To ensure a fair comparison, we restrict this high-redshift field sample to have the same redshift distribution as the SMGs (we note that the final high-redshift field sample has an -band magnitude distribution of =22.781.05; for reference, the SMGs have =23.371.6). We hereafter refer to this sample as the “high- field”, but caution that the selection function for this sample is extremely complex since it comprises a highly incomplete mix of UV/optical, mid-infrared and X-ray selected galaxies. We therefore also restrict the analysis specifically to a more homogeneously selected sample of UV/optically selected galaxies (star-forming BX/BM and LBGs) with secure spectroscopic redshifts (in the range 1.6–3.5) from Reddy et al. (2006) (hereafter called UV-SF galaxies). This sample contains 228 galaxies which are in the GOODS-North ACS -band imaging of which 53 are also have also been observed with NICMOS. We also remove from the UV-SF sample one galaxy which has a bolometric luminosity greater than L⊙ and note that the median bolometric luminosity of the remaining sample is L10 (Reddy et al., 2006) which is an order of magnitude lower than the typical bolometric luminosity of the SMGs. In Fig. 2 and 3 we show true-colour HST images of the SMGs and UV-SF galaxies to demonstrate the visual mix of morphological types is comparable.
2.3 Galaxy Sizes and Morphologies
To quantify the galaxy morphologies (and measure their physical scale), we first calculate the Petrosian and half-light radii in the optical and near-infrared. The Petrosian radius is defined by rpet=1.5rη=0.2 where is the radius () at which the surface brightness within an annulus at is one fifth of the surface brightness within (Conselice et al., 2000; Chapman et al., 2003b). This provides a measure of the size which does not depend on isophotes. The half-light radius, , is then defined as the radius at which the flux is one-half of that within .
Given the small angular sizes of these objects, and their apparently complex morphologies, it is difficult to apply a standard morphological analysis along the lines of a “Hubble tuning fork”. Fortunately, statistics have been developed to help characterize high redshift galaxy morphologies. We concentrate on the Gini and Asymmetries (Abraham et al., 2003; Conselice, 2003) although we note that a number of other parameterisations of galaxy morphologies have been developed (such as concentration and clumpiness as part of the CAS system; Conselice 2003). However, since the concentration parameter represents the scale of the galaxy, and the clumpiness defines the spatial light distribution, to keep the analysis concise here we concentrate on the half-light radius and Gini co-efficient which are similar parameterisations.
The Gini coefficient is a statistical tool, originally developed for economics, which determines the distribution of wealth within a population. Higher values indicate a very unequal distribution (=1 indicates all of the flux is in one pixel), whilst a lower value indicates it is more widely distributed (=0 suggests the flux is evenly distributed). The value of is defined by the Lorentz curve of the galaxies light distribution, which does not take into consideration any of the spatial information. The value is derived by first sorting the pixel values within the Petrosian aperture, and then summed over a cumulative distribution (see Abraham et al. 2003).
Since the Gini coefficient removes all spatial information, to study the structures and morphologies of our sample, we also compute the galaxy asymmetry (). The asymmetry of a galaxy is measured by minimising the subtraction of a galaxy image from itself after rotating the original image by 180∘. The minimisation takes into account the uncertainty in deriving the galaxy center (see Conselice et al. (2008) and references therein for a detailed discussion). Briefly, a lower value of suggests that the galaxy is more symmetrical (e.g. elliptical galaxies), whilst higher values of suggest highly asymmetric systems, usually found in spiral galaxies or major mergers (for reference, in the rest-frame UV/optical, an asymmetry value in excess of A=0.30 has been found to be a robust indication of a major merger at =0 Conselice et al. 2003a)
To derive the asymmetry for the galaxies in our sample, we first extract a 1010′′ thumbnail of a galaxy image from the background subtracted frame. We mask all objects except for the galaxy image using the sextractor segmentation map, replacing these regions with values taken from the correct noise properties as measured from the sky. We then measure the petrosian radius, half light radius and Gini co-efficient ( & ). To derive the asymmetry, we first derive a crude centre for the galaxy by finding the luminosity weighted centroid of the galaxy light distribution. We extract, rotate and subtract the galaxy image about this center, but then iterate and allow the center to vary over the entire half-light radius. This function is minimised to provide the integer pixel centre of the galaxy. Operationally, after the initial centre is found, the asymmetry is computed again for centres at the surrounding eight points in a 33 grid. We use a distance of 0.1 pixels, corresponding to approximately 0.1% of the galaxy half light radius and use bilinear interpolation on the shifted image. If the asymmetry parameter at the centre is lower than any of the surrounding pixels, then the asymmetry parameter is taken as this value. If the central pixel does not give the asymmetry minimum, then the procedure is repeated with the new centre where the minimum was found. This process repeats until the minimum is found.
3 Analysis and Results
3.1 Galaxy Sizes
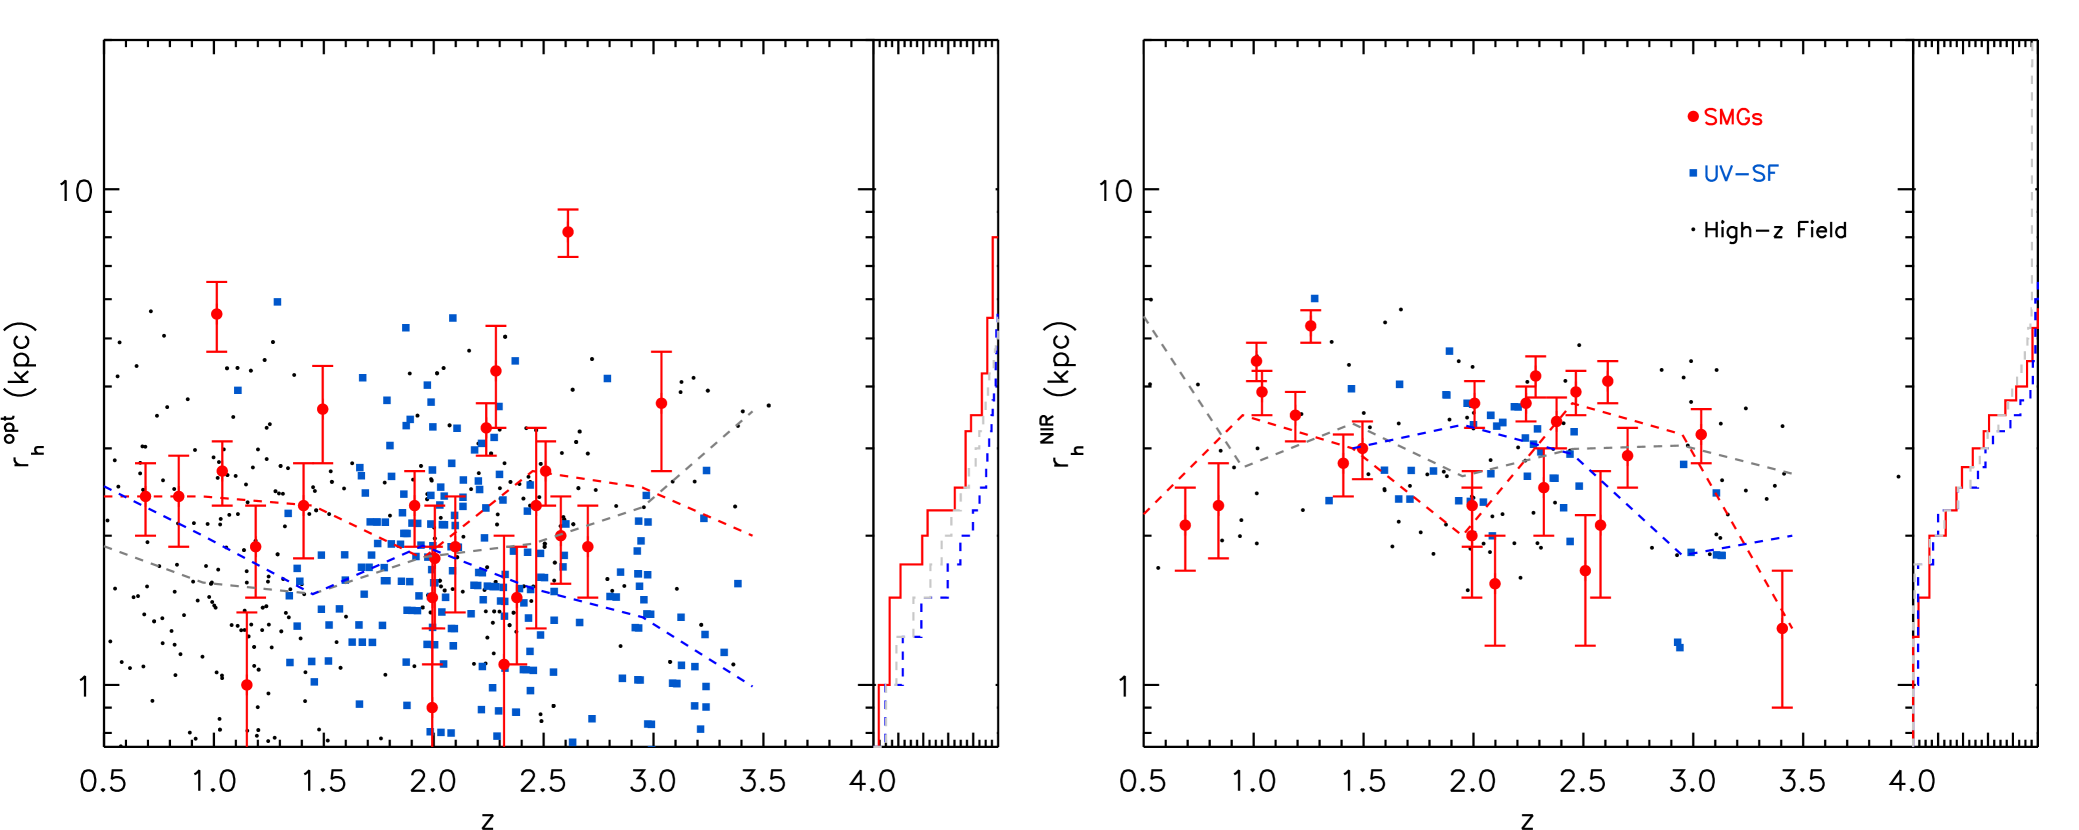
First, we compare the half light sizes of the SMGs and comparison samples. As Fig. 4 shows, the SMGs have an optical median half light radii of =2.30.3 kpc, which significantly overlaps with the half-light radii of UV-SF galaxies (=1.90.2 kpc), and the field population (=2.00.1 kpc) (here we quote the error on the mean and we note that in all cases the 1 scatter in the distribution is is 1.3–1.7 kpc). These rest-frame UV SMG half light radii are similar to those found by Chapman et al. (2003b) who derive rh=2.80.3 kpc for a small sample of SMGs.
Turning to the observed -band, the SMGs have a median half light radii of =2.80.4 kpc which is in good agreement with both the high- field population, and the UV-SF sample which have =2.60.2 and 2.50.2 kpc respectively. Thus it appears that the sizes of the SMGs are not systematically larger than the lower-luminosity star-forming galaxies at the same epoch in either - or -bands (Table 2), but the near-infrared half light radii tend to be systematically larger (0.5 kpc) in all three galaxy populations. Finally, in Fig. 4 we show the optical and near-infrared sizes for all three galaxy samples as a function of redshift from 0.5–3.5. Binning the samples into =0.5 bins, none of the three samples show systematic trends of half light radius with redshift.
Table 1.
Log of SMG sample with NICMOS imaging
| ID | Short Name | Type | F160W | |||||
|---|---|---|---|---|---|---|---|---|
| (AB) | (kpc) | (kpc) | (kpc) | (kpc) | ||||
| SMM J030227.73+000653.51 | CFRS03-15 | 1.408 | SB | 14.42.0 | 2.80.4 | 13.11.5 | 2.30.5 | |
| SMM J105158.02+571800.2 | LOCKMAN-03 | 2.239 | SB | 9.91.3 | 3.70.3 | 7.81.3 | 3.30.4 | |
| SMM J105200.22+572420.2 | LOCKMAN-08 | 0.689 | SB | 5.30.5 | 2.10.4 | 5.01.3 | 2.40.4 | |
| SMM J105230.73+572209.5 | LOCKMAN-06 | 2.611 | SB | 10.20.5 | 4.10.4 | 15.92.5 | 8.20.9 | |
| SMM J105238.30+572435.8 | LOCKMAN-02 | 3.036 | SB | 8.60.6 | 3.20.4 | 5.72.0 | 3.71.0 | |
| SMM J123553.26+621337.7 | HDFN-082 | 2.098 | SB | 3.10.2 | 1.60.4 | 3.70.4 | 1.90.5 | |
| SMM J123600.10+620253.52 | HDFN-092 | 2.701 | SB | 5.01.5 | 2.90.4 | 3.61.2 | 2.40.4 | |
| SMM J123600.15+621047.2 | HDFN-093 | 1.994 | SB | 4.22.0 | 2.30.4 | 5.00.8 | 1.50.4 | |
| SMM J123606.85+621021.4 | HDFN-105 | 2.509 | SB | 4.20.5 | 1.70.5 | 7.60.5 | 2.70.4 | |
| SMM J123616.15+621513.7 | HDFN-127 | 2.578 | SB | 9.72.0 | 2.10.6 | 7.61.2 | 2.00.4 | |
| SMM J123622.65+621629.7 | HDFN-143 | 2.466 | SB | 9.70.4 | 3.90.4 | 6.12.0 | 2.31.0 | |
| SMM J123629.13+621045.8 | HDFN-153 | 1.013 | SB | 12.00.9 | 4.50.4 | 13.82.5 | 5.60.9 | |
| SMM J123632.61+620800.1 | HDFN-161 | 1.993 | AGN | 5.00.4 | 2.00.5 | 2.50.5 | 0.90.4 | |
| SMM J123635.59+621424.1 | HDFN-172 | 2.005 | AGN | 9.20.4 | 3.70.4 | 10.61.2 | 1.80.5 | |
| SMM J123701.59+621513.9 | GN17 | 1.260 | SB | 12.50.4 | 5.30.4 | …. | …. | |
| SMM J131201.17+424208.1 | SA13-332 | 3.405 | AGN | 3.30.4 | 1.30.4 | 2.20.4 | 0.40.4 | |
| SMM J131225.20+424344.51 | SA13-516 | 1.038 | SB | 10.31.2 | 3.90.4 | 8.90.5 | 2.70.4 | |
| SMM J131232.31+423949.5 | SA13-570 | 2.320 | SB | 7.50.9 | 2.50.5 | 3.61.5 | 1.11.0 | |
| SMM J141741.81+522823.01 | CFRS14-13 | 1.150 | AGN | 5.61.5 | 6.62.0 | 1.00.4 | ||
| SMM J141800.40+522820.31 | CFRS14-3 | 1.913 | SB | 3.70.6 | 8.30.3 | 2.30.4 | ||
| SMM J163631.47+405546.9 | ELAIS-13 | 2.283 | AGN | 8.60.6 | 4.20.4 | 7.32.0 | 4.31.0 | |
| SMM J163639.01+405635.9 | ELAIS-07 | 1.495 | SB | 8.30.7 | 3.00.4 | 12.73.0 | 3.60.8 | |
| SMM J163650.43+405734.5 | ELAIS-04 | 2.378 | SB/AGN | 9.70.6 | 3.40.4 | 5.01.5 | 1.50.4 | |
| SMM J163658.78+405728.1 | ELAIS-08 | 1.190 | SB | 9.90.6 | 3.50.4 | 6.82.0 | 1.90.4 | |
| SMM J163704.34+410530.3 | ELAIS-01 | 0.840 | SB | 6.91.2 | 2.30.5 | 6.10.5 | 2.40.5 |
Table 2.
Median Morphological Parameters
| Sample | r(kpc) | r(kpc) | r(kpc) | r(kpc) | Gopt | Gnir | Aopt | Anir | ||
|---|---|---|---|---|---|---|---|---|---|---|
| SMGs | 6.90.7 | 7.70.6 | 2.30.3 | 2.80.4 | 0.690.03 | 0.560.02 | 0.270.03 | 0.250.02 | 0.130.04 | 0.020.03 |
| UV-SF | 6.20.2 | 6.60.3 | 1.90.2 | 2.60.2 | 0.590.02 | 0.530.02 | 0.290.02 | 0.240.02 | 0.060.03 | 0.050.03 |
| High- field | 7.70.2 | 7.80.2 | 2.00.1 | 2.50.2 | 0.600.05 | 0.550.01 | 0.240.10 | 0.240.01 | 0.050.05 | 0.000.10 |
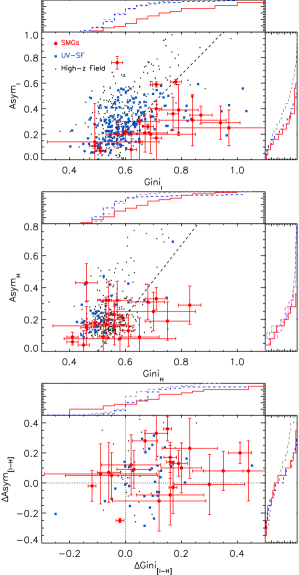
3.2 Gini and Asymmetries
In Fig. 5 we show the - and -band Gini and Asymmetry coefficients for the SMGs compared to the UV-SF sample and the high- field population. In the observed -band the SMGs have a median Gini value of =0.690.03. In contrast, the comparison samples have =0.590.02 and =0.600.05. Thus the SMGs have a systematically larger optical Gini coefficient (0.1) than the comparison samples. In the observed -band, the SMGs also have a slightly larger Gini co-efficient with =0.560.02 which is larger than the UV-SF population. The differences in the Gini co-efficient between SMGs and UV-SF galaxies (particularly in the rest-frame UV) suggests that dustier galaxies have star-formation which is less uniform, and/or that they suffer from more structured dust obscuration.
Turning to the asymmetries, in both the rest-frame UV and optical, the SMGs have comparable asymmetries as the high- field and UV-SF samples (0.270.03 and 0.250.02). In the asymmetries alone, it therefore appears that the SMGs are no more likely to appear as major mergers in the rest-frame UV/optical than more typical (lower bolometric luminosity), high-redshift galaxies.
3.3 Light Profile
Given the high resolution and reasonable signal-to-noise of our data, we also model the surface brightness distribution of the SMGs and comparison samples. We use galfit (Peng et al., 2002) to model both the - and -band surface brightness distributions for the sample. To ensure robust results, we restrict the analysis to galaxies brighter than I23.8 and for 24.5 (see Cimatti et al. 2008). For each galaxy image, the PSF which galfit uses during the fitting process was generated with tinytim. In all cases, we used the Sersic profile to model the galaxy surface brightness profile, allowing the Sersic index, , to vary between =0.5 and =6. For =1 and =4 the Sersic profile reduces to an exponential or de Vaucoulers profile respectively. Disk dominated galaxies typically have low Sersic indices (2), whilst bulge dominated galaxies tend to have higher Sersic values (e.g. 2).
Individually, the SMGs have a wide range of Sersic indices in both the - and -bands, ranging from 0.5 to =4.5, with a median (SMG)=1.81.0 and (SMG)=1.40.8 (the errors denote the error on the mean; the errors on individual measurements are typically 1.0). Similarly, the UV/optical star-forming comparison sample has a median Sersic index of (UV-SF)=1.20.8 and (UV-SF)=1.50.7, although also with a comparably wide spread as the SMGs.
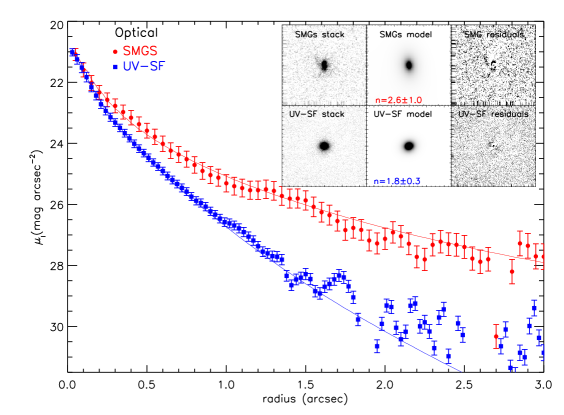
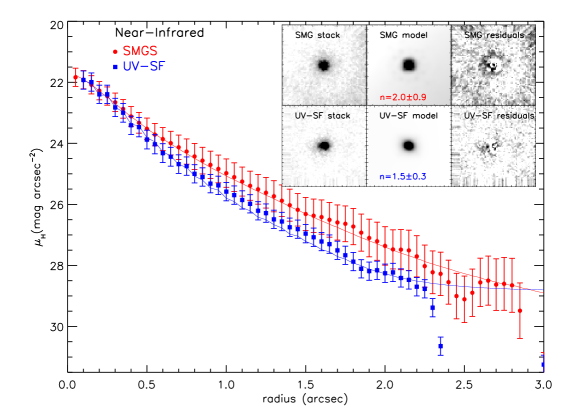
An alternative test of the average light profile can be made by stacking the individual images. To achieve this, we first normalise the light distribution using the total flux within the Petrosian aperture (we only include galaxies brighter than I23.8, 24.5 as above), and use the centre as defined by the Asymmetry minimisation procedure. In Fig. 6 we show the stacked two-dimensional images, as well as the average light profiles for the SMGs and comparison samples. We also show the best-fit model and residuals after subtraction of the best fit profile. Using galfit to model the light profile (accounting for the PSF using tinytim) the resulting best-fit model in the -band has (SMG)=2.60.5, whilst the -band light profile is best described with (SMG)=2.00.5. Although the SMGs are extended on scales greater than the PSF in both - and -band (typically r0.25′′;2 kpc), it is likely that the spatial light profiles are sensitive to the PSF. We therefore convolve the -band image with the NICMOS PSF and the -band image with the ACS PSF and re-fit the - and -band images with the convolved PSF respectively, obtaining (SMG)=2.51.0 and (SMG)=3.00.9. Since this extra smoothing produces Sersic indices within 1 of the previous measurements, we conclude that the Sersic indices give a reasonable estimate of the true Sersic indices of the galaxies. We also note that removing those SMGs with possible AGN contributions (Table 1), the Sersic index increases in both cases by n=0.20.3 (where the error accounts for the lower number of galaxies in the stack). Thus, the best fit SMGs in both - and -bands is –2.5 which is consistent with bulge-dominated galaxies. The same stacking procedure for the UV-SF comparison sample yields a slightly smaller Sersic index with (UV-SF)=1.80.3 and (UV-SF)=1.50.3, significantly overlapping the Sersic values in both bands for the SMGs.
4 Discussion
Using deep HST and -band imaging, we have performed a quantitative morphological analysis of a sample of 25 spectroscopically confirmed sub-mm selected galaxies. We measure the sizes of the SMGs, and derive typical half light radii of r(SMG)=2.30.3 kpc and r(SMG)=2.80.4 kpc. We find that the SMGs have comparable sizes to UV-SF galaxies, and the general –3 field population in both bands. The sizes we derive are slightly larger, but comparable to the gas sizes measured using IRAM/PdBI millimeter interferometry (=1.80.8 kpc; Tacconi et al. 2008). The similarity between the CO and observed -band (stellar) sizes suggest that the stars and dense gas are most likely co-located.
Although the measured sizes of SMGs and UV-SF samples are comparable, previous results have shown that there are significant differences in stellar and dynamical masses, with SMGs having potential well depths much greater than optically selected star-forming galaxies (e.g. Swinbank et al., 2004; Erb et al., 2006; Genzel et al., 2006; Förster Schreiber et al., 2006; Swinbank et al., 2006; Law et al., 2007a). If the regions sampled by the H and CO emission lines are the same as those seen in the rest-frame UV/optical imaging, then this suggests that the SMGs have surface matter densities up to an order of magnitude larger than typical BX/BM and LBGs (see also Tacconi et al. 2008).
Using the asymmetry parameter to gauge the importance of major mergers, we find that the SMGs and UV-SF comparison samples all have comparable asymmetries in the optical and near-infrared, with and in the observed - and -band respectively. This is somewhat larger than typically measured for spiral or elliptical galaxies in the local Universe (typically ), but comparable to the asymmetry measured in local ULIRGs (; Conselice et al. 2003a). Overall, (and surprisingly) this suggests that in the the rest-frame UV/optical morphologies, SMGs are as equally likely to appear as major mergers than lower-luminosity (and hence more quiescent) high-redshift star-forming galaxies. However, the Gini co-efficients of the SMGs are systematically larger than the UV-SF galaxies, suggesting less uniform star-formation in the rest-frame UV, and possibly structured dust obscuration (see also Law et al. 2007b).
The striking result that the SMGs have comparable sizes and asymmetries as other high-redshift populations is at odds with the traditional picture of SMGs which have shown that SMGs are extended starbursts which are a result of major mergers (e.g. Greve et al., 2005; Swinbank et al., 2006; Tacconi et al., 2008). However, many of these studies have concentrated on other multi-wavelength data (such as kinematic studies through CO or H). Indeed, recently Ivison et al. (2010) use deep EVLA radio imaging of the CO(1-0) to show that the archetypal lensed SMG behind Abell 1835 (L1L2) has a large, extended cold molecular gas reservoir which extends over 25 kpc in projection. To reconcile this apparent contradiction, we measure the half light radius, Gini co-efficient and asymmetry of L1L2 using the source-plane imaging, deriving half light radii of rh=3.00.3 and 2.80.4 kpc, asymmetries of =0.32 and 0.30 and Gini co-efficients of G=0.82 and 0.88 in observed - and -bands respectively (centered on L1 in this system). Thus, the rest-frame UV/optical morphology of L1L2 appears similar to the typical SMGs studies here, even though the kinematics and spatial extent of the gas in this system is complex. Our findings suggest that, whilst multi-wavelength studies (such as those carried out via radio, CO or H) suggest archetypal SMGs may mark the sites of complex, merging systems, this is poorly reflected in their rest-frame UV/optical morphologies (or, at least it is difficult to differentiate SMGs from other more quiescent high-redshift populations via rest-frame UV/optical morphologies alone).
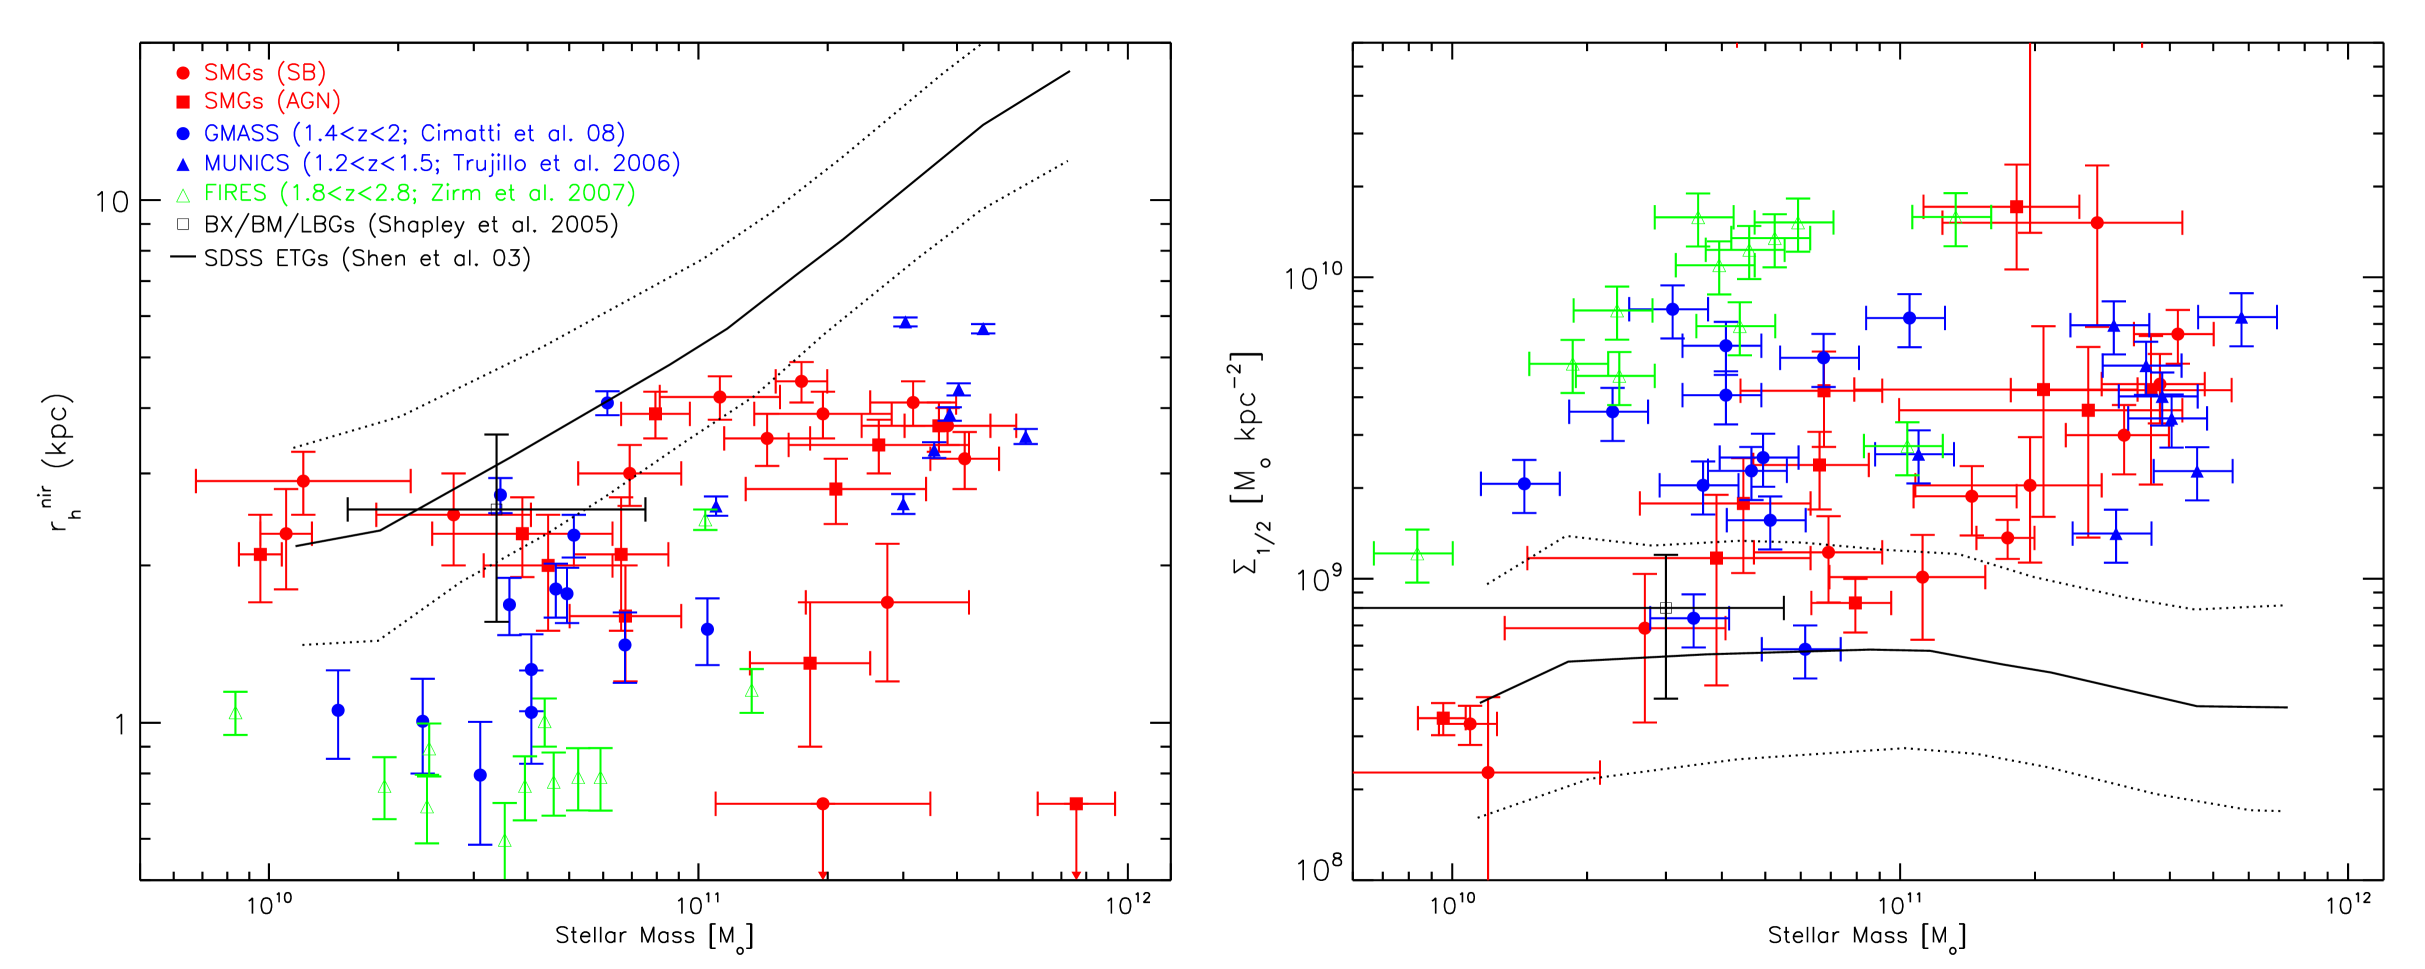
Finally, to test how the stellar densities of the SMGs compare to other high redshift populations we combine the size and stellar mass estimates and show the size versus stellar mass relation in Fig. 7. We use the latest estimates for the SMG stellar masses from Hainline et al. (2009a,b) (which take account of the TP-AGB phase of stellar evolution; Maraston 1998) and AGN contribution to the rest-frame near-infrared photometry. For the SMGs, the median stellar masses, (M M⊙) suggest stellar densities which are a factor 5 larger (on average) than the UV-SF population (see also Borys et al., 2005; Alexander et al., 2008), but slightly larger (by a factor 2) than local early type galaxies (Shen et al., 2003). We also compare the sizes and stellar densities to other 1.5 luminous red galaxies (LRGs) from Cimatti et al. (2008); Zirm et al. (2007) which (due to their moderately high stellar masses, 1010.5-11.0M⊙, compact sizes kpc, and low space densities, 10-4 Mpc-3) have been proposed as direct SMG descendants. However, the stellar masses and sizes of the SMGs are, on average, both a factor 2 larger than LRGs. Thus, unless the stars forming in the gas reservoir ultimately have a very different spatial distribution than the gas itself (which is unlikely given the similarity between the observed stellar and gas sizes), it is difficult to reconcile the small physical sizes of luminous red galaxies at 1.5 with an evolutionary sequence with SMGs which already appear to be a factor larger measured at the same rest-frame wavelength at .
5 Conclusions
We have undertaken the first large near-infrared morphological analysis of SMGs. We find that the SMGs have comparable sizes to UV-SF galaxies at the same epoch (BX/BM and LBGs) in both - and -bands, and (surprisingly) with comparable asymmetries. However, we find that the SMGs have systematically larger Gini co-efficients (particularly in the observed -band) than UV-SF galaxies at the same epoch suggesting less uniform, high intensity star-formation in the rest-frame UV, possibly reflecting structured dust obscuration (see also Law et al. 2007b). Overall our results suggest that SMGs are no more likely to appear as major mergers in the rest-frame UV/optical than more typical, lower-luminosity high-redshift galaxies (such as Lyman break galaxies or BX/BMs). However, the differences in the Gini coefficients between populations suggests that the dustier SMGs have star-formation which is less uniform (and/or that they suffer from more structured dust obscuration).
We also show that most of the SMGs have observed -band light profiles which are better fit with that of a spheroid galaxy light distribution. Indeed, stacking the galaxies we find that in the observed -band, an n2 Sersic index provides a better fit to the spatial light profile than an exponential disk model, suggesting that, whilst these galaxies are individually morphologically complex, the composite stellar structure of the SMGs reflects that of a spheroid/elliptical galaxy. However, we note that the same analysis of the UV-SF galaxies is statistically indistinguishable, with only a marginally lower Sersic index with .
The close similarity between the rest-frame UV and optical morphologies in the SMGs, and UV-SF galaxies suggests that both wavelengths are dominated by young, star-bursting components as well as dusty regions (see also Dickinson et al., 2000; Papovich et al., 2005). These results are in contrast to local studies of similarly luminous LIRGS and ULIRGs in the local Universe which have been shown to have very different Hubble types from the rest-frame UV and optical wavelengths (e.g. Goldader et al. 2002), possibly suggesting fundamental differences between starbursts at and .
Although the sizes and structural properties of the SMGs and UV-SF star-forming galaxies are similar, previous work has shown that the dynamical masses of SMGs are up to an order of magnitude larger than UV-SF galaxies (e.g. Erb et al., 2003; Swinbank et al., 2004; Erb et al., 2006; Genzel et al., 2006; Förster Schreiber et al., 2006; Swinbank et al., 2006; Law et al., 2007a).. This suggests that the intense star-formation within SMGs does not represent an evolutionary sequence in which typical UV-SF galaxies undergo intense star-formation (either through merging or through secular processes), but rather it is the availability of large gas reservoirs within already massive galaxies that allow the SMG phase.
Finally, we also investigate the size–stellar mass relation of SMGs in order to test whether the SMGs may represent progenitors of the luminous red galaxies seen at 1.5. We combine estimates of the size and stellar masses to show that approximately half of the sample have stellar mass densities comparable to those derived for luminous red galaxies (eg. Cimatti et al., 2008). However, we show that the median size of the SMGs in the observed near-infrared ( kpc) is larger than that of the luminous red galaxies, which have a median half light radius of kpc. We also show that the median stellar mass of the SMGs is also a factor larger, thus suggesting that the luminous red population at are unlikely to be direct descendants of the SMG population unless the new stars formed in the SMG starburst ultimately have a very different spatial distribution from their gas reservoirs, which seems unlikely given the similarity between the CO and UV/optical sizes.
Overall, our results suggest that rest-frame UV and optical morphologies of high-redshift galaxies are essentially decoupled from other observables (such as bolometric luminosity, stellar or dynamical mass). Alternatively, the physical processes occuring within the galaxies are too complex to be simply characterised by the rest-frame UV/optical morphologies. It may be that at significantly longer wavelength structural differences will appear, but this will have to wait for rest-frame near-infrared imaging with James Webb Space Telescope, (JWST). Alternatively, high resolution kinematical studies on sub-kpc scales (e.g. with near-infrared IFUs which can now be carried out from the ground using adaptive optics) may offer the most direct route to probing the differences between high-redshift galaxy population as the dynamics, distribution of star-formation and metallicity gradients will reflect differences in the triggering mechanism and mode of star-formation at high-redshift.
acknowledgments
We are very grateful to the referee for their constructive comments which significantly improved the content and clarity of this paper. We would like to thank Alfred Schultz at STScI for advice on dealing with the effects of the SAA on our NICMOS data. We gratefully acknowledge Eric Richards for providing us with his reduced maps of HDF and SSA13 and David Law and Jim Dunlop for useful discussions. AMS gratefully acknowledges a Sir Norman Lockyer Royal Astronomical Society fellowship. SCC acknowledges support from NASA grants #9174 and #9856. IRS acknowledges support from STFC. AWB ackowledges NSF grant AST-0205937 and the Alfred P. Sloan Foundation. DMA thanks the Royal Society and Leverhume trust.
References
- Abraham et al. (2003) Abraham, R. G., van den Bergh, S., & Nair, P. 2003, ApJ, 588, 218
- Alexander et al. (2008) Alexander, D. M., Brandt, W. N., Smail, I., Swinbank, A. M., Bauer, F. E., Blain, A. W., Chapman, S. C., & Coppin et al. 2008, AJ, 135, 1968
- Barger et al. (2008) Barger, A. J., Cowie, L. L., & Wang, W.-H. 2008, ApJ, 689, 687
- Bell et al. (2003) Bell, E. F., McIntosh, D. H., Katz, N., & Weinberg, M. D. 2003, APJS, 149, 289
- Blain et al. (2004) Blain, A. W., Chapman, S. C., Smail, I., & Ivison, R. 2004, ApJ, 611, 725
- Borys et al. (2004) Borys, C., Scott, D., Chapman, S., Halpern, M., Nandra, K., & Pope, A. 2004, MNRAS, 355, 485
- Borys et al. (2005) Borys, C., Smail, I., Chapman, S. C., Blain, A. W., Alexander, D. M., & Ivison, R. J. 2005, ApJ, 635, 853
- Bower et al. (1992) Bower, R. G., Lucey, J. R., & Ellis, R. S. 1992, MNRAS, 254, 601
- Chapman et al. (2003a) Chapman, S. C., Blain, A. W., Ivison, R. J., & Smail, I. R. 2003a, Nature, 422, 695
- Chapman et al. (2005) Chapman, S. C., Blain, A. W., Smail, I., & Ivison, R. J. 2005, ApJ, 622, 772
- Chapman et al. (2003b) Chapman, S. C., Windhorst, R., Odewahn, S., Yan, H., & Conselice, C. 2003b, ApJ, 599, 92
- Cimatti et al. (2008) Cimatti, A., Cassata, P., Pozzetti, L., Kurk, J., Mignoli, M., Renzini, A., Daddi, E., & Bolzonella et al. 2008, A&AP, 482, 21
- Conselice (2003) Conselice, C. J. 2003, APJS, 147, 1
- Conselice et al. (2003a) Conselice, C. J., Bershady, M. A., Dickinson, M., & Papovich, C. 2003a, AJ, 126, 1183
- Conselice et al. (2000) Conselice, C. J., Bershady, M. A., & Gallagher, III, J. S. 2000, A&AP, 354, L21
- Conselice et al. (2003b) Conselice, C. J., Chapman, S. C., & Windhorst, R. A. 2003b, ApJL, 596, L5
- Conselice et al. (2008) Conselice, C. J., Rajgor, S., & Myers, R. 2008, MNRAS, 386, 909
- Cowie et al. (2002) Cowie, L. L., Barger, A. J., & Kneib, J.-P. 2002, AJ, 123, 2197
- Dickinson et al. (2000) Dickinson, M., Hanley, C., Elston, R., Eisenhardt, P. R., Stanford, S. A., Adelberger, K. L., Shapley, A., & Steidel et al. 2000, ApJ, 531, 624
- Dole et al. (2004) Dole, H., Le Floc’h, E., Pérez-González, P. G., Papovich, C., Egami, E., Lagache, G., Alonso-Herrero, A., & Engelbracht, C. W et al. 2004, APJS, 154, 87
- Erb et al. (2003) Erb, D. K., Shapley, A. E., Steidel, C. C., Pettini, M., Adelberger, K. L., Hunt, M. P., Moorwood, A. F. M., & Cuby, J. 2003, ApJ, 591, 101
- Erb et al. (2006) Erb, D. K., Steidel, C. C., Shapley, A. E., Pettini, M., Reddy, N. A., & Adelberger, K. L. 2006, ApJ, 646, 107
- Förster Schreiber et al. (2006) Förster Schreiber, N. M., Genzel, R., Lehnert, M. D., Bouché, N., Verma, A., Erb, D. K., Shapley, A. E., & Steidel, C et al. 2006, ApJ, 645, 1062
- Genel et al. (2008) Genel, S., Genzel, R., Bouché, N., Sternberg, A., Naab, T., Schreiber, N. M. F., Shapiro, K. L., Tacconi, L. J., Lutz, D., Cresci, G., Buschkamp, P., Davies, R. I., & Hicks, E. K. S. 2008, ApJ, 688, 789
- Genzel et al. (2003) Genzel, R., Baker, A. J., Tacconi, L. J., Lutz, D., Cox, P., Guilloteau, S., & Omont, A. 2003, ApJ, 584, 633
- Genzel et al. (2006) Genzel, R., Tacconi, L. J., Eisenhauer, F., Förster Schreiber, N. M., Cimatti, A., Daddi, E., Bouché, N., & Davies, R., et al. 2006, Nature, 442, 786
- Goldader et al. (2002) Goldader, J. D., Meurer, G., Heckman, T. M., Seibert, M., Sanders, D. B., Calzetti, D., & Steidel, C. C. 2002, ApJ, 568, 651
- Greve et al. (2005) Greve, T. R., Bertoldi, F., Smail, I., Neri, R., Chapman, S. C., Blain, A. W., Ivison, R. J., & Genzel et al. 2005, MNRAS, 359, 1165
- Law et al. (2007a) Law, D. R., Steidel, C. C., Erb, D. K., Larkin, J. E., Pettini, M., Shapley, A. E., & Wright, S. A. 2007a, ApJ, 669, 929
- Law et al. (2007b) Law, D. R., Steidel, C. C., Erb, D. K., Pettini, M., Reddy, N. A., Shapley, A. E., Adelberger, K. L., & Simenc, D. J. 2007b, ApJ, 656, 1
- Le Floc’h et al. (2005) Le Floc’h, E., Papovich, C., Dole, H., Bell, E. F., Lagache, G., Rieke, G. H., Egami, E., & Pérez-González, P. G. et al. 2005, ApJ, 632, 169
- LeFloc’h et al. (2009) LeFloc’h, E., Aussel, H., Ilbert, O., Riguccini, L., Frayer, D. T., Salvato, M., Arnouts, S., & Surace, J. et al. 2009, ApJ, 703, 222
- Lilly et al. (1999) Lilly, S. J., Eales, S. A., Gear, W. K. P., Hammer, F., Le Fèvre, O., Crampton, D., Bond, J. R., & Dunne, L. 1999, ApJ, 518, 641
- Maraston (1998) Maraston, C. 1998, MNRAS, 300, 872
- Nelan et al. (2005) Nelan, J. E., Smith, R. J., Hudson, M. J., Wegner, G. A., Lucey, J. R., Moore, S. A. W., Quinney, S. J., & Suntzeff, N. B. 2005, ApJ, 632, 137
- Papovich et al. (2005) Papovich, C., Dickinson, M., Giavalisco, M., Conselice, C. J., & Ferguson, H. C. 2005, ApJ, 631, 101
- Papovich et al. (2004) Papovich, C., Dole, H., Egami, E., Le Floc’h, E., Pérez-González, P. G., Alonso-Herrero, A., Bai, L., Beichman, C. A., Blaylock, M., Engelbracht, C. W., Gordon, K. D., Hines, D. C., Misselt, K. A., Morrison, J. E., Mould, J., Muzerolle, J., Neugebauer, G., Richards, P. L., Rieke, G. H., Rieke, M. J., Rigby, J. R., Su, K. Y. L., & Young, E. T. 2004, APJS, 154, 70
- Peng et al. (2002) Peng, C. Y., Ho, L. C., Impey, C. D., & Rix, H.-W. 2002, AJ, 124, 266
- Pope et al. (2005) Pope, A., Borys, C., Scott, D., Conselice, C., Dickinson, M., & Mobasher, B. 2005, MNRAS, 358, 149
- Reddy et al. (2006) Reddy, N. A., Steidel, C. C., Erb, D. K., Shapley, A. E., & Pettini, M. 2006, ApJ, 653, 1004
- Sandage & Visvanathan (1978) Sandage, A. & Visvanathan, N. 1978, ApJ, 225, 742
- Shapley et al. (2005) Shapley, A. E., Steidel, C. C., Erb, D. K., Reddy, N. A., Adelberger, K. L., Pettini, M., Barmby, P., & Huang, J. 2005, ApJ, 626, 698
- Shen et al. (2003) Shen, S., Mo, H. J., White, S. D. M., Blanton, M. R., Kauffmann, G., Voges, W., Brinkmann, J., & Csabai, I. 2003, MNRAS, 343, 978
- Smail et al. (2004) Smail, I., Chapman, S. C., Blain, A. W., & Ivison, R. J. 2004, ApJ, 616, 71
- Smail et al. (2002) Smail, I., Ivison, R. J., Blain, A. W., & Kneib, J.-P. 2002, MNRAS, 331, 495
- Smith et al. (2007) Smith, R. J., Lucey, J. R., & Hudson, M. J. 2007, MNRAS, 381, 1035
- Spergel et al. (2003) Spergel, D. N., Verde, L., Peiris, H. V., Komatsu, E., Nolta, M. R., Bennett, C. L., Halpern, M., & Hinshaw, G., et al. 2003, APJS, 148, 175
- Swinbank et al. (2006) Swinbank, A. M., Chapman, S. C., Smail, I., Lindner, C., Borys, C., Blain, A. W., Ivison, R. J., & Lewis, G. F. 2006, MNRAS, 371, 465
- Swinbank et al. (2004) Swinbank, A. M., Smail, I., Chapman, S. C., Blain, A. W., Ivison, R. J., & Keel, W. C. 2004, ApJ, 617, 64
- Tacconi et al. (2002) Tacconi, L. J., Genzel, R., Lutz, D., Rigopoulou, D., Baker, A. J., Iserlohe, C., & Tecza, M. 2002, ApJ, 580, 73
- Tacconi et al. (2008) Tacconi, L. J., Genzel, R., Smail, I., Neri, R., Chapman, S. C., Ivison, R. J., Blain, A., & Cox et al. 2008, ApJ, 680, 246
- Takata et al. (2006) Takata, T., Sekiguchi, K., Smail, I., Chapman, S. C., Geach, J. E., Swinbank, A. M., Blain, A., & Ivison, R. J. 2006, ApJ, 651, 713
- Thompson (2003) Thompson, R. I. 2003, ApJ, 596, 748
- Trujillo et al. (2006) Trujillo, I., Feulner, G., Goranova, Y., Hopp, U., Longhetti, M., Saracco, P., Bender, R., & Braito et al. 2006, MNRAS, 373, L36
- van Dokkum et al. (2004) van Dokkum, P. G., Franx, M., Förster Schreiber, N. M., Illingworth, G. D., Daddi, E., Knudsen, K. K., Labbé, I., & Moorwood et al. 2004, ApJ, 611, 703
- Webb et al. (2003) Webb, T. M. A., Lilly, S. J., Clements, D. L., Eales, S., Yun, M., Brodwin, M., Dunne, L., & Gear, W. K. 2003, ApJ, 597, 680
- Zirm et al. (2007) Zirm, A. W., van der Wel, A., Franx, M., Labbé, I., Trujillo, I., van Dokkum, P., Toft, S., & Daddi et al. 2007, ApJ, 656, 66