11email: cschang@mpifr.de, ros@mpifr.de 22institutetext: Departament d’Astronomia i Astrofísica, Universitat de València, E-46100 Burjassot, Spain 33institutetext: Astro Space Centre of Lebedev Physical Institute, Profsoyuznaya 84/32, 117997 Moscow, Russia
33email: yyk@asc.rssi.ru 44institutetext: Department of Physics, Purdue University, 525 Northwestern Avenue, West Lafayette, IN 47907, USA
44email: mlister@physics.purdue.edu
VLBI detection of the HST-1 feature in the M 87 jet at 2 cm
Abstract
Context. A bright feature 80 pc away from the core in the powerful jet of M 87 shows highly unusual properties. Earlier radio, optical and X-ray observations have shown that this feature, labeled HST-1, is superluminal, and is possibly connected with the TeV flare detected by HESS in 2005. It has been claimed that this feature might have a blazar nature, due to these properties.
Aims. To examine the possible blazar-like nature of HST-1, we analyzed 2 cm VLBA archival data from dedicated full-track observations and the 2 cm survey/MOJAVE VLBI monitoring programs obtained between 2000 and 2009.
Methods. Applying VLBI wide-field imaging techniques, the HST-1 region was imaged at milliarcsecond resolution.
Results. Here we present the first 2 cm VLBI detection of this feature in observations from early 2003 to early 2007, and analyze its evolution over this time. Using the detections of HST-1, we find that the projected apparent speed is 0.610.31. A comparison of the VLA and VLBA flux densities of this feature indicate that is mostly resolved on molliarcsecond scales. This feature is optically thin ( for S ) between 2 cm and 20 cm.
Conclusions. We do not find evidence of a blazar nature for HST-1.
Key Words.:
Radio continuum: galaxies - Techniques: high angular resolution - Techniques: interferometric - Galaxies: active - Galaxies: jets1 Introduction
Active Galactic Nuclei (AGN) are among the most energetic phenomena in the Universe, and they have been heavily studied since their initial discovery by Seyfert (1943). Although there are many clues that imply that a super-massive black hole (SMBH) is the engine launching the powerful jet (Urry & Padovani 1995), the exact mechanism remains unknown.
| Exp. | b | Nant | Beamc | S | S | S | S | S | rms | rms | ||
| Epoch | Code | [min] | size[mas] | [degree] | [Jy] | [Jy beam-1] | [mJy] | [mJy beam-1] | [mJy beam-1] | [Jy beam-1] | [Jy beam-1] | |
| 2000.06 | BK073Ae,f | 476 | 11 | 2.071.35 | 2.26 | 1.24 | 1.36 | 0.26 | 0.23 | 79 | 68 | |
| 2000.35 | BK073Be,f | 476 | 11 | 1.881.31 | 2.33 | 1.29 | 1.42 | 0.20 | 0.21 | 70 | 71 | |
| 2000.99 | BK073Ce,f | 476 | 10j | 2.121.52 | 2.46 | 1.33 | 1.84 | 0.25 | 0.33 | 100 | 92 | |
| 2001.99 | BR077Dg,h | 68 | 10 | 1.741.09 | 2.74 | 1.42 | 5.24 | 0.66 | 0.70 | 212 | 262 | |
| 2002.25 | BR077Jg,h | 57 | 10 | 1.771.13 | 2.54 | 1.40 | 5.84 | 0.80 | 0.81 | 300 | 292 | |
| 2003.09 | BL111Eg | 54 | 10 | 1.851.30 | 2.85 | 1.57 | 3.98 | 1.01 | 2.13 | 218 | 206 | |
| 2004.61 | BL111Ng | 63 | 10 | 1.881.16 | 2.32 | 1.27 | 22.03 | 4.14 | 8.76 | 198 | 210 | |
| 2004.92 | BL111Qg | 64 | 10 | 1.951.23 | 2.41 | 1.39 | 23.59 | 2.70 | 9.97 | 223 | 295 | |
| 2005.30 | BL123Eg | 63 | 9k | 2.061.37 | 2.35 | 1.37 | 19.72 | 2.57 | 7.03 | 237 | 226 | |
| 2005.85 | BL123Pg | 63 | 10 | 2.111.25 | 2.39 | 1.31 | 19.93 | 3.67 | 9.53 | 188 | 208 | |
| 2006.45 | BL137Fg | 22 | 10 | 1.851.22 | 2.51 | 1.51 | 6.96 | 1.02 | 1.44 | 295 | 348 | |
| 2007.10 | BL137Ng | 42 | 10 | 1.951.23 | 2.67 | 1.53 | 10.49 | 1.14 | 2.94 | 201 | 255 | |
| 2007.42 | BL149AAg | 45 | 10 | 1.781.25 | 2.69 | 1.46 | 7.70 | 0.81 | 1.13 | 272 | 385 | |
| 2008.33 | BL149AOe | 41 | 9j | 1.771.10 | 3.24 | 1.79 | 3.22 | 0.54 | 0.75 | 193 | 161 | |
| 2009.10 | BL149BGi | 50 | 9l | 2.251.52 | 1.99 | 1.13 | 5.26 | 0.36 | 0.49 | 223 | 263 | |
| a Observations are in dual-polarization mode, except as indicated | ||||||||||||
| b Total scheduled VLBI on-source time | ||||||||||||
| c Beam A: natural weighting and tapering of Gaussian full-width half maximum 0.3 at 200 M | ||||||||||||
| d Root-mean-square image noise using natural weighting and tapering with a Gaussian factor of 0.3 at a radius of 200 M | ||||||||||||
| e Recording rate: 256 Mbit s-1, 2 bits per sample | ||||||||||||
| f Dedicated full-track experiment on M 87 (see Kovalev et al. 2007); the array included a single VLA antenna (Y1) | ||||||||||||
| g Recording rate: 128 Mbit s-1, 1 bit per sample | ||||||||||||
| h Single polarization hand (LL) observations only | ||||||||||||
| i Recording rate: 512 Mbit s-1, 2 bits per sample | ||||||||||||
| j Antenna NL missing | ||||||||||||
| k Antenna SC missing | ||||||||||||
| l Antenna HN missing | ||||||||||||
One of the most studied AGN is M 87 (also known as Virgo A), a nearby elliptical galaxy located in the Virgo cluster. It hosts a very powerful one-sided jet emerging from the central region, and was also the first extragalactic jet to be discovered (Curtis 1918). The synchrotron-emitting nature of the M 87 jet was suggested by Baade (1956). Observations show that M 87 contains within a 0.25′′ radius, which suggests the presence of a SMBH in its nucleus (Harms et al. 1994). Due to its proximity (16.4 Mpc, z=0.00436, 1 mas = 0.08 pc, 1 mas yr-1 = 0.26 , Jordán et al. 2005), M 87 is an ideal candidate for studying AGN phenomena, and has been monitored at many different wavelengths over the last several decades. In the observed one-sided jet of M 87 (Shklovsky 1964), superluminal motion was reported from Hubble Space Telescope (HST) observations within the innermost 6′′ of the jet with apparent speeds of 4 to 6 (Biretta et al. 1999). Discrepant speeds were reported from VLBA observations at 7 mm with values between 0.25 to 0.4 (Ly et al. 2007), and a value of 2 or even larger (Acciari et al. 2009). VLBA 2 cm observations showed apparent speeds 0.05 from 1994 to 2007 (Kovalev et al. 2007; Lister et al. 2009b). Therefore, the kinematical properties of the jet in M 87 remain an important topic of discussion.
In 1999 HST observations revealed a bright knot in the jet located 1′′ (projected distance of 0.08 kpc) away from the core. This feature, named HST-1, is active in the radio, optical and X-ray regimes. VLBA 20 cm observations showed that HST-1 has sub-structure and appears to contain superluminal components moving at speeds up to 4 (Cheung et al. 2007). These observations suggest that HST-1 is a collimated shock in the AGN jet. Furthermore, recent multi-wavelength observations were used to show that HST-1 could be related to the origin of the TeV emission observed in M 87 in 2005 by the HESS telescope (Aharonian et al. 2006). Comparing data taken in the near ultraviolet by Madrid (2009), soft X-rays (Chandra) and VLA 2 cm observations (Cheung et al. 2007; Harris et al. 2006), the light curves of HST-1 reached a maximum in 2005, while the resolved core showed no correlation with the TeV flare. Therefore, the TeV emission from M 87 was suggested to originate in HST-1 (Harris et al. 2008). Based on those findings, Harris et al. (2008) suggest that HST-1 has a blazar nature. However, Acciari et al. (2009) reported rapid TeV flares from M 87 in February 2008, which may have originated in the core, instead of HST-1, which remained in a low state during the flares in 2008. Recently, the Fermi Large Area Telescope (LAT) team reported the detection of M 87 at gamma-ray energies (Abdo et al. 2009).
The AGN standard model considers the blazar behavior to originate at the vicinity of the SMBH. However, HST-1 is 80 pc away from the core. If the HST-1 blazar hypothesis is true, this would pose a challenge to current AGN models. In this paper, we examine this hypothesis with 2 cm VLBI wide-field imaging of the HST-1 feature. We present the description of our VLBI observations and the corresponding data reduction in Sect. 2; the results are presented in Sect. 3; the discussion is presented in Sect. 4. Finally, a short summary is presented in Sect. 5. Throughout this paper, we use the term “core” as the apparent origin of AGN jets that commonly appears as the brightest feature in VLBI radio images of blazars (Lobanov 1998; Marscher 2008). We use a cosmology with , and Mpc-1 (Komatsu et al. 2009).
2 VLBI Observations and Data Analysis
M 87 has been monitored at 2 cm with the VLBA since 1994 by the 2 cm Survey/MOJAVE programs111http://www.physics.purdue.edu/MOJAVE/ (Kellermann et al. 2004; Lister et al. 2009a). We re-analyzed 12 epochs of these monitoring program data obtained after late 2001, together with three observing sets of targeted observations on M 87 in 2000 (see Table 1). The 2 cm Survey/MOJAVE epochs from 2001 to 2009 were snapshot observations with a total integration time from 20 minutes to one hour, and were broken up into about six-minute-long scans in order to have a better coverage; the three epochs in 2000 were full-track observations with eight-hour integration time and included a single VLA antenna (Y1).
The VLBA data were processed by following the standard procedures in AIPS cookbook, as described in detail by Kovalev et al. (2007); Lister et al. (2009a). The data were fringe-fitted before the imaging process. The data from MOJAVE project epochs after 2007.61 were processed using the pulse calibration signals to align the phases instead of fringe fitting, because the positions of the sources and the VLBA antennas are well determined (Petrov et al. 2008, 2009) , and the station clocks are known to be stable. However, for our wide-field imaging purposes, fringe fitting was necessary for a better determination of the phase and rate across the observed band, and therefore to better image the extended jet of M 87. Moreover, it ensures the homogeneity of all the datasets.
In order to accurately image HST-1 with VLBI, there are two issues that need to be considered. First, HST-1 lies 800 2 cm beamwidth away from the brightest feature (the VLBA core). For this reason, time or frequency data averaging would produce time and bandwidth smearing in the HST-1 region. Second, based on earlier VLBA 20 cm and VLA 2 cm observations of HST-1 (Cheung et al. 2007), we expect the total 2 cm flux density to be at the milliJansky level, which is much weaker than the total flux density of the inner jet (2.5 Jy). To detect HST-1, we need to image the inner jet region with its extended structure (over tens of milliarcseconds); otherwise, the sidelobes from the core would cover the HST-1 emission. To reach this goal, we applied natural weighting and -tapering on the whole dataset.

First, we averaged the data 16-sec in time and averaged all channels in each IF in frequency, and obtained the inner jet initial model by applying phase and amplitude self-calibration using DIFMAP. The time-smearing effect of 16 seconds begins to be relevant at a distance of 200 mas from the field center, which is beyond the inner jet scale, and did not affect our data analysis at this stage. When the inner jet model was reasonably good, we applied the obtained CLEAN-components to the un-averaged data for the first amplitude-and-phase self-calibration using AIPS. Natural weighting and tapering with a Gaussian factor of 0.3 at a radius of 200 M in the -plane was applied to the whole dataset, and the resultant beam sizes are shown in Table 1. If we remove tapering and apply uniform weighting, the inner jet is better resolved but less flux density is recovered. In this case, the image noise level is too high to detect the HST-1 feature.
To better identify the extended component, and since full-resolution, uniform-weighting imaging did not produce detections of this feature, we chose the approach of tapering and natural weighting. Furthermore, we downgraded the resolution to a larger beam size of 83.4 mas in P.A. 0∘ This beam size was chosen specifically for comparison with the VLBA 20 cm observations of (Cheung et al. 2007) In the following Sections, we label the smaller beams as beam A, noting that the beam sizes are slightly different in each epoch. These are listed in Table 1. Beam B refers to the beam size of 83.4 mas.

3 Results
We completed the wide-field imaging of 15 epochs of M 87 VLBA 2 cm obtained between 2000 and 2009. Each epoch was imaged using beam A and beam B (see Sect. 2), and for each beam size, we applied two image cleaning fields, one for the M 87 inner jet region, and another for the HST-1 region, which was phase-shifted as 788.5 mas in right ascension and 348.9 mas in declination. We performed deep cleaning iterations until the image rms reached the expected thermal noise value. The rms values of the final images are listed in Table 1. Three epochs in the year 2000 are full-track observations with an on-source time of 476 minutes, and have the lowest rms.
3.1 Imaging of the inner jet of M 87
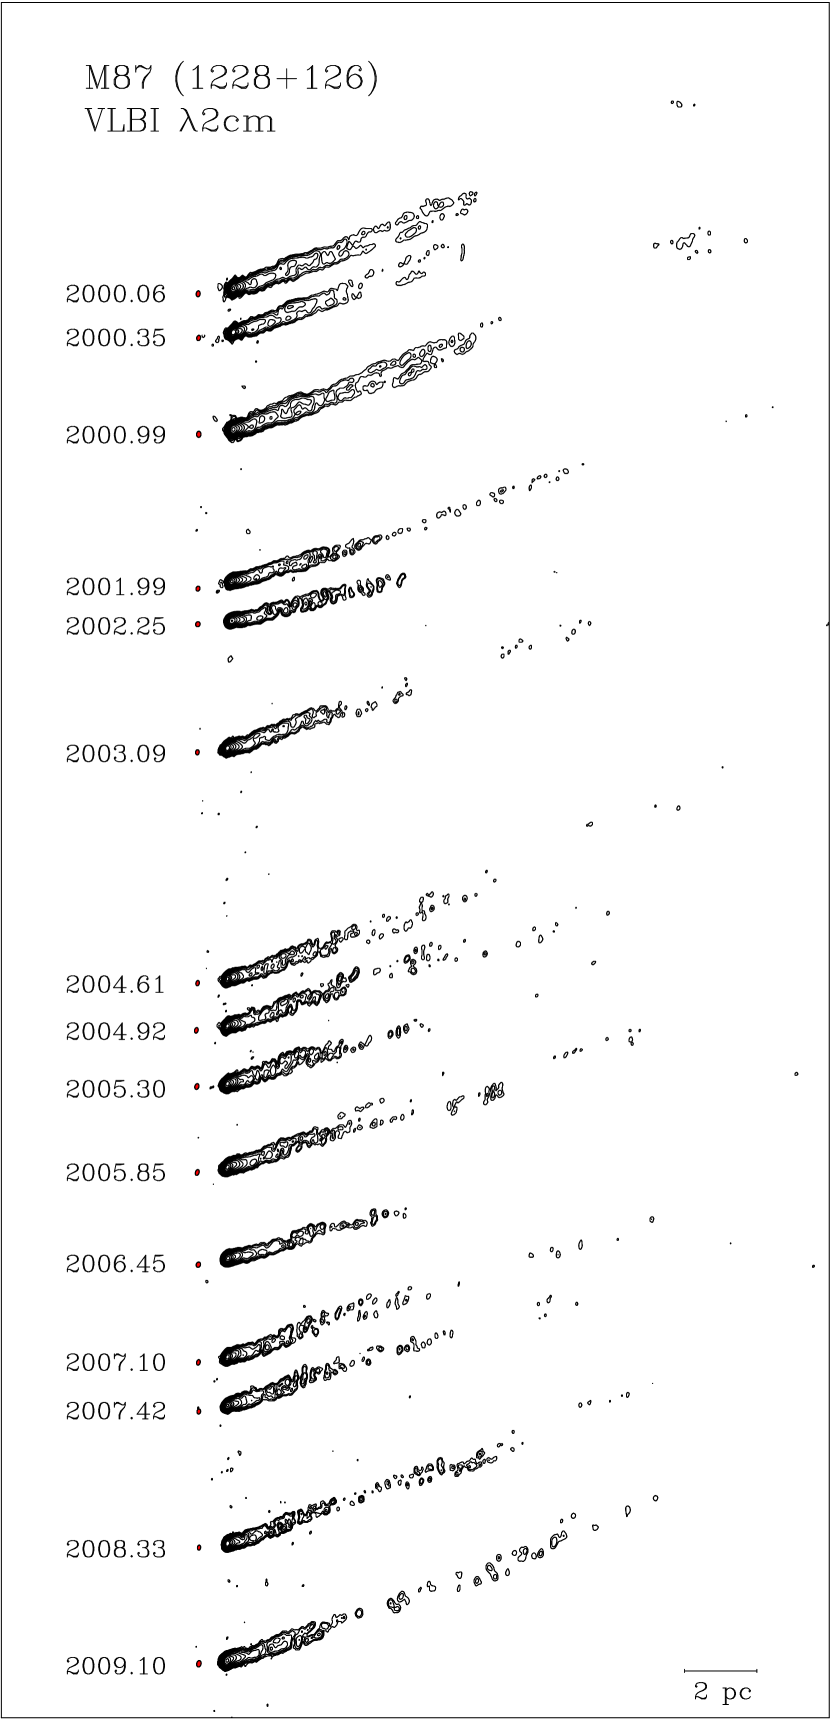
With tapering and natural weighting of the data, the extended inner jet was imaged over a region 100-200 mas in size, which varied according to the different sensitivity of each epoch. The inner jet images are shown in Fig. 2 (beam A) and Fig. 2 (beam B). The inner jet structure has an average total flux density of 2.5 Jy, with overall flux density changes up to 1 Jy during 2000 to 2009, as shown in Fig. 3. We estimate the error in flux densities to be 5%, based on the typical amplitude calibration accuracy of the VLBA (Kovalev et al. 2005 and Ulvestad & Wrobel 2009). In February 2008, multiple very high energy flares were detected by the multi-wavelength campaign of HESS, MAGIC, VERITAS; meanwhile, VLBA 7 mm observations detected a flare in the VLBA core simultaneously (Acciari et al. 2009). We have also seen the 2008 flare from the core in our VLBA 2 cm data, and therefore confirmed this result (see Fig. 3).
The inner jet showed structural changes during the period of our observations. However, the study of the inner jet is beyond the scope of this paper (see e.g., Kovalev et al. 2007, Walker et al. 2008, and Lister et al. 2009b for a detailed discussion of the structure and kinematics of the inner jet).
3.2 Imaging of the HST-1 region
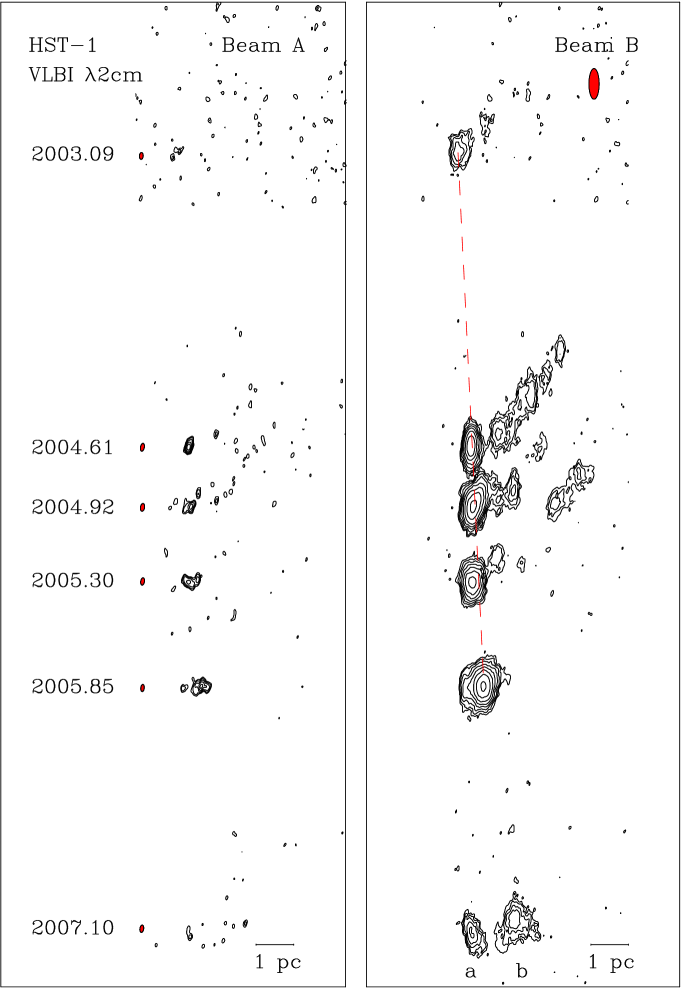
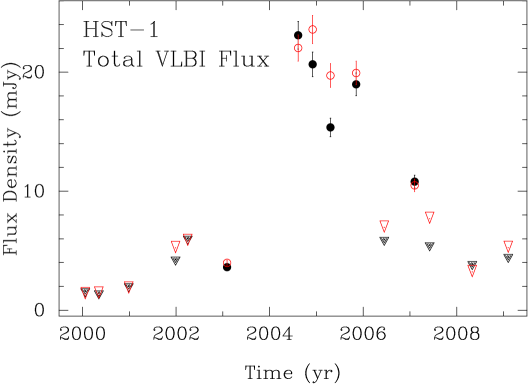
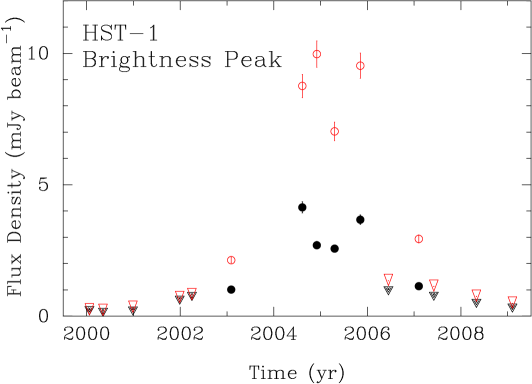
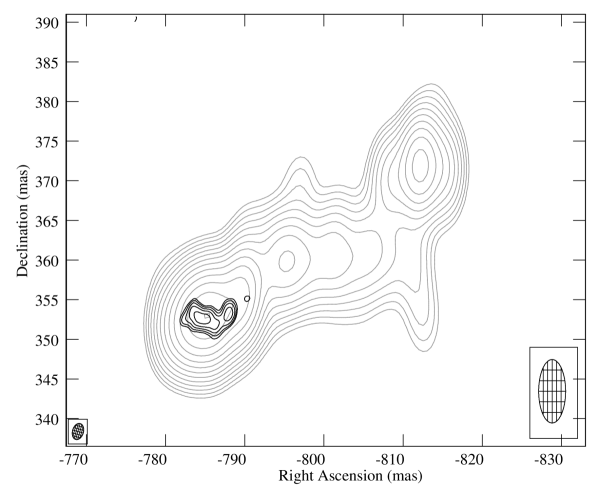
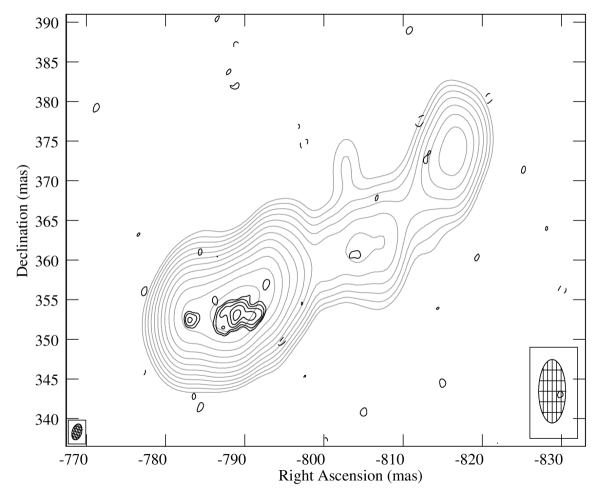
HST-1 was detected in six of the 15 epochs we analyzed from 2003 to early 2007 (detection limit: 5). As discussed in Sect. 4, this feature was too faint in most epochs, and the image noise was too high to allow us to to detect it. Fig. 4 shows hybrid maps of this region. The HST-1 images produced using beam A show that the brightest component has a size of 10 mas down to the lowest contours, while the images produced using beam B reveal an extended structure 50 mas in size, which is comparable with VLBA 20 cm observations (Cheung et al. 2007). The feature has a total flux density that varies between 4 and 24 mJy (Fig. 5). The peak surface brightness varies from 1 to 4 mJy beam-1 (beam A) and 2 to 10 mJy beam-1 (beam B), as shown in Fig. 6. Epochs which have no detection are marked as upper limits (inverted triangles) in Figs. 5 and 6.
In 2003.09, HST-1 is marginally detected with both beam sizes; the brightness peak is 1 mJy beam-1, and the total flux density is 3.7 mJy. During 2004.61–2005.85, 4 epochs show significant detections of HST-1 with beam A and beam B, where the peak component remains dominant, and the total flux density fluctuation is 30%. In 2007, the structure of HST-1 becomes more extended and complex, reaching a total flux density of 10 mJy and developing two distinct peaks (peak a and peak b in Fig. 4).
For the epochs with no detections, we derived upper limit on the total VLBI flux density of HST-1. These were estimated based on the rms noise values of each epoch. The maximum amount of flux density hidden below the noise would be the rms value times the size of the HST-1 emission region (in units of beam size). Based on our HST-1 detection, we assume that the size of the HST-1 emission region is about 20 times the beam size, and we derived the upper limit on each epoch accordingly. We also derived the upper limit of the brightness temperature in this region as 9 K at 2 cm.
3.3 Spectral properties of HST-1
Figure 7 illustrates two overlaid images of HST-1 at 20 cm (Cheung et al. 2007 and Cheung, priv. comm.) and 2 cm (beam A) of two adjacent epochs. The images were co-aligned using the peak of the inner jet as a common reference point. This figure shows that our observations are resolving the HST-1 peak component. We use those epochs to derive the HST-1 spectral properties by producing a rendition of the 2 cm image using the same restoring beam as the 20 cm image, namely, 83.4 mas at a position angle of 0∘ (beam B; Fig. 4, right panel). Table 2 lists the epochs of 20 cm and 2 cm observations and the corresponding spectral index , where Sν . The uncertainties of the spectral indices are formal errors, and are estimated using standard error propagation methods. When interpreting these values, one has to keep in mind that the resolution of 20 cm and 2 cm are very different. First, the frequency is different by one magnitude, which results in small formal error bars of the spectral index. Second, the incomplete coverage on short VLBA baselines might cause a missing flux density in the HST-1 region at 2 cm (see Sect. 4.4 for a discussion). The average value of the derived spectral index is 0.78.
| Epoch | Sν [mJy] | |||
| 2 cm | 20 cm | 2 cm | 20 cm | |
| 2005.30 | 2005.35 | 19.71.0 | 1116b | 0.750.03 |
| 2005.85 | 2005.82 | 19.91.0 | 1266b | 0.800.02 |
| a The spectral index and its errors are formal, see section 4.4 | ||||
| b 5% error assumed for VLBI observations | ||||
3.4 HST-1 kinematics
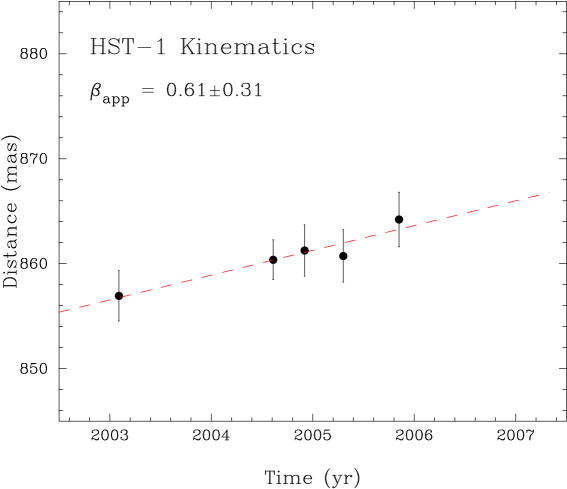
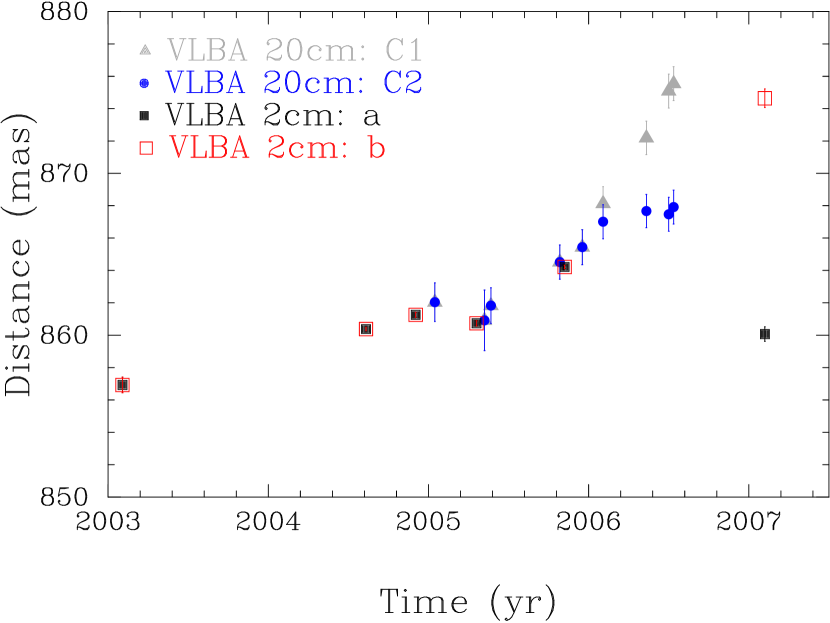
To study the kinematics of HST-1, we fitted the peak of HST-1 and the M 87 core in the image plane with a Gaussian component using IMFIT in AIPS. As shown in Fig. 4, it is difficult to identify moving components in this region, because the detections are weak. Therefore it is difficult to derive an accurate apparent speed for the HST-1 subcomponents. For this reason, we use the relative position between the peak of HST-1 and the M 87 core to estimate the apparent speed of HST-1. Moreover, among the 6 epochs of detection, HST-1 was almost resolved out in epoch 2007.10, and appeared to have a double-peak morphology in beam B image (Fig. 4). By considering that the HST-1 detection in 2007.10 was weak, and the double-peak structure might be due to the effect of convolution, we excluded this epoch from the kinematic analysis (see Sect. 4.2 for a discussion). As shown in Fig. 8, we plotted the peak positions of HST-1 with respect to the M 87 core against time, and we estimated the position errors as the FWHM of the fitted Gaussian component. By applying a linear regression to the peak positions, we obtained a value for the projected apparent speed of the HST-1 feature of 2.361.19 mas yr-1, which correspond to = 0.610.31.
4 Discussion
4.1 Variability timescale and HST-1 flaring region at parsec-scales
We derived the variability timescale of the 2005 flare from HST-1 assuming that a single flare would produce a logarithmic rise and fall in the light curve. By fitting the available light curves from VLBI and VLA measurements before and after the maximum flux density during the flare, we derived corresponding variability timescales and the upper limit of the characteristic size where the flare was produced. We define the logarithmic variability timescale as , where is the flux density, is the time interval between observations in units of years (Burbidge et al. 1974). Next, we estimate the upper limit of the characteristic size of the emission region from light-travel time: , where z is the redshift, D is the luminosity distance in Gpc, and is the Doppler factor (Marscher et al. 1979). Table 3 shows the result of the derived characteristic size of the 2005 flare in HST-1.
Harris et al. (2003) estimated the Doppler factor of HST-1 to have a value between 2 and 5, based on decay timescales of Chandra observations. In the same context, Wang & Zhou (2009) estimated the Doppler factor of HST-1 to be 3.570.51 by fitting the non-simultaneous spectral energy distribution of M87 using a synchrotron spectrum model. Simulations incorporating MHD models for the M 87 jet have suggested that the recollimation shock formed close to the HST-1 position had a relatively low Doppler factor 1-2 (Gracia et al. 2009). If we use =3.57, the derived characteristic sizes of HST-1 emission region during its flaring time are 20 31 and 54 100 mas. The size scale of structural changes of HST-1 (see Fig. 4) is between 2050 mas (1 pc = 12.5 mas), which is within the derived characteristic size scale. However, if 3.5, derived from VLBA 2 cm is smaller than 20 mas, which would create a causality problem, since the largest structural change of HST-1 cannot be bigger than the upper limit of the information propagation time. Therefore, 3.5 is needed based on the causality argument.
| Wavelength | ||||
| [yr] | [yr] | [mas] | [mas] | |
| VLA 2 cm | 1.5 | 4.9 | 8.7 | 28 |
| VLBA 2 cm (beam A) | 1.0 | 4.2 | 5.6 | 24 |
| VLBA 2 cm (beam B) | 1.0 | 2.7 | 5.7 | 15 |
| aThe characteristic size is related to the Doppler factor . | ||||
If is less than 3.5 in the HST-1 region, we could explain the causality problem by the self-calibration procedure that we used while imaging HST-1. We applied self-calibration to the inner jet and HST-1 for all of the epochs with detections in beam A and beam B. Self-calibration works better with stronger objects, in our case, the marginal detection in epoch 2003.09 might not provide a satisfactory result in recovering extended emissions, comparing with stronger detections between 2004.61 and 2005.85, in which after self-calibration, we were able to recover more extended emission.
4.2 Speeds of HST-1
We used the peak position and fitted Gaussian errors to estimate the projected apparent speed of HST-1 = 0.610.31 (see Fig. 8), which is sub-luminal. In the kinematic analysis, we excluded epoch 2007.10 for obtaining a robust kinematic result. However, to make our results more solid, we estimated the upper and lower limit of HST-1 apparent speed by including epoch 2007.10 as a test. The derived possible range of the apparent speed is 0.23 1.2, which is still consistent with a mildly relativistic jet motion.
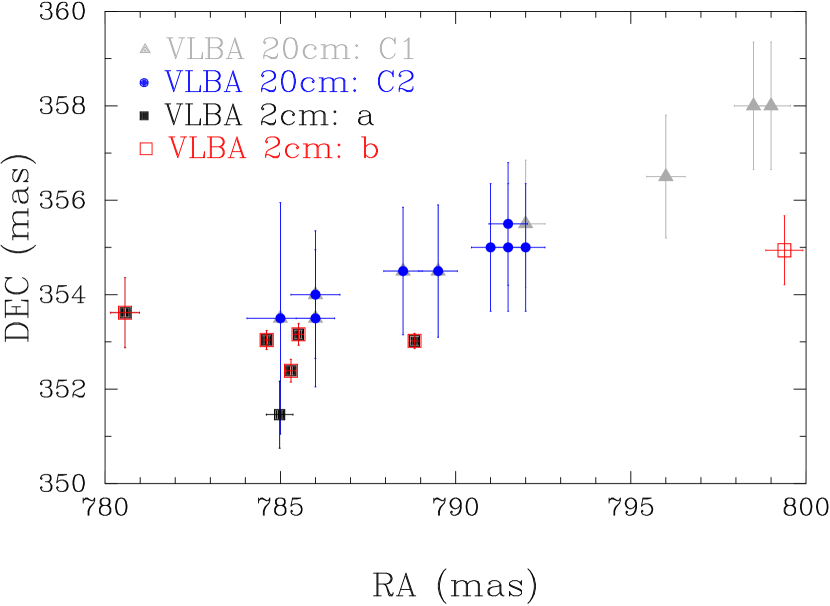
To compare our kinematic results with previous findings, we show the positional evolution on the sky of the HST-1 peak at VLBA 2 cm with both beam A and beam B (see Fig. 4), and components C1 and C2 at VLBA 20 cm (Cheung et al. 2007 and priv. comm.). As illustrated, our derived apparent speed range and structural evolution in time at 2 cm are consistent with the 20 cm results. However, our sub-luminal speed measurements of HST-1 are inconsistent with the high apparent superluminal motions reported in Cheung et al. (2007) from VLBA 20 cm observations and with the HST (Biretta et al. 1999). Nevertheless, in the VLBA 20 cm observations (Cheung et al. 2007), lower speeds were derived from some components in HST-1: c2 has = 0.47 0.39, and HST-1d has = 1.14 0.14. Our results are consistent with these findings.
4.3 Detection limits
HST-1 was not detected in epoch 2006.45. This epoch had only 22 minute integration time and the sampling rate was 128Mbit s-1. Therefore, the rms level (0.35 mJy beam-1) was not low enough to detect HST-1, which was also fading according to our light curve (Fig. 5).
The total flux density of HST-1 measured by the VLA at 2 cm reached its maximum value of 123 mJy in 2005 (Harris et al. 2006). Our VLBA 2 cm results recovered a HST-1 total flux density of 23 mJy, which is only 19% of the VLA measurement. We conclude that the innermost region of HST-1 was resolved out with the long baselines of the VLBA. The low measured flux density suggests that HST-1 is very extended.
4.4 HST-1 parsec-scale spectrum
We derived the spectral index of the HST-1 region based on VLBA 2 cm and 20 cm data (Table 2). However, one should be cautious with these values. First, the two datasets have a frequency difference of a factor of 10, which results in small formal error bars of the derived spectral index. One should be aware that the spectral index here could provide us with a trend in the spectrum of HST-1 and the physical condition of the region, but not the absolute value. Second, we have found that the incomplete coverage on short VLBA baselines has resulted in missing flux in the HST-1 region at 2 cm. Therefore, the spectral index value of HST-1 region is a lower limit, and the results suggest that HST-1 was optically thin during the flare in 2005. If assuming HST-1 was a flat-spectrum source, there would have been 90 mJy missing flux in this region in our 2 cm VLBA measurements.
4.5 A blazar nature of HST-1
The intensity of HST-1 reached a maximum in different wavebands in 2005, and the light curves from the VLA 2 cm, VLBA 20 cm, NUV, and X-ray observations all show the same tendency (Harris et al. 2009; Madrid 2009). Our light curve of HST-1 at VLBA 2 cm (Fig. 5) is consistent with the other observations. Although this trend could be taken as evidence that HST-1 is the source of the HESS-detected TeV flare in 2005 (Aharonian et al. 2006), its VLBA radio properties that we have derived do not support it. These include (i) a very low compactness of the dominant emission, (ii) low brightness temperature, (iii) sub-luminal motion, and (iv) possibly low optical depth across the feature at parsec-scales. Those are in contrast to the typical blazar core features, which tend to have flat or inverted spectral indices in cm-wave VLBA images. We observed that HST-1 has radio properties consistent with those commonly seen in jet components. TeV observatories cannot resolve the M 87 core and HST-1 separately. To probe the origin of TeV emission, correlating variability between different bands is a powerful tool. Recent examples of this approach were successfully shown for a sample of blazars by Kovalev et al. (2009), and for M 87 by Acciari et al. (2009). Another approach is to apply physical models to multiwavelength observations to probe the TeV origin. There are models that suggest radio-TeV connections. For example, high energy flares could be generated from parsec-scale radio jets by inverse-Compton scattering of the photons and particles emitting from the core, and Stawarz et al. (2006) used this approach to explain the TeV flare from M87 in 2005. However, Acciari et al. (2009) reported about the VHE flare of M87 in 2008, and suggested that there might be correlations with the radio flare observed by VLBA at 43 GHz from the core. From our results, although we cannot fully discount, however, that HST-1 was the source of the TeV flare in 2005 based on our results alone, we do not favor the blazar nature for HST-1 suggested by Harris et al. (2008).
5 Summary
With our VLBA 2 cm data from 2000.06 to 2009.10, we have detected HST-1 during 2003.09–2007.10, which covered the multi-band flaring period of HST-1. The total flux density of HST-1 varied from 4-24 mJy in our detections; by comparing the images of VLBA 2 cm and 20 cm, we saw a steep spectrum with 0.8 in this region. The projected apparent speed of HST-1 derived from the brightness peak position is 0.610.31, which suggests a sub-luminal nature at VLBA 2 cm.
Our results showed that HST-1 is extremely extended at parsec-scales, and has a steep spectrum. No compact feature with a brightness temperature higher than 9 K is present in the 2 cm VLBA observations of this region of the M 87 jet, which implies that HST-1 does not have the properties of a standard blazar core. Combining our findings, we do not find evidence of a blazar nature for HST-1 in the jet of M 87.
Acknowledgements.
We thank A. Moré, G. Cimò, S. Mühle, M. A. Garrett, R. W. Porcas, R. C. Walker, and C. M. Fromm for valuable comments and inspiring discussions. Special thanks are due to C. C. Cheung for providing the VLBA 20 cm images (Cheung et al. 2007), and D. E. Harris for providing VLA 2 cm light curve (Harris et al. 2009). We thank the anonymous referee for useful comments and suggestions. This research was supported by the EU Framework 6 Marie Curie Early Stage Training program under contract number MEST/CT/2005/19669 “ESTRELA”. C. S. Chang is a member of the International Max Planck Research School for Astronomy and Astrophysics. Part of this project was done while Y. Y. K. was working as a research fellow of the Alexander von Humboldt Foundation. Y. Y. K. was partly supported by the Russian Foundation for Basic Research (project 08-02-00545) and the Alexander von Humboldt return fellowship. This research has made use of data from the 2 cm Survey (Kellermann et al. 2004) and MOJAVE programs that is maintained by the MOJAVE team (Lister et al. 2009a). The MOJAVE project is supported under National Science Foundation grant AST-0807860 and NASA Fermi grant NNX08AV67G. Part of this work made use of archived VLBA and VLA data obtained by K. I. Kellermann, J. Biretta, F. Owen, and W. Junor. The Very Long Baseline Array is operated by the USA National Radio Astronomy Observatory, which is a facility of the USA National Science Foundation operated under cooperative agreement by Associated Universities, Inc. This research has made use of the NASA/IPAC Extragalactic Database (NED) which is operated by the Jet Propulsion Laboratory, California Institute of Technology, under contract with the National Aeronautics and Space Administration. This research has made use of NASA’s Astrophysics Data System.References
- Abdo et al. (2009) Abdo, A. A., Ackermann, M., Ajello, M., et al. 2009, ApJ, 707, 55
- Acciari et al. (2009) Acciari, V. A., Aliu, E., Arlen, T., et al. 2009, Science, 325, 444
- Aharonian et al. (2006) Aharonian, F., Akhperjanian, A. G., Bazer-Bachi, A. R., et al. 2006, Science, 314, 1424
- Baade (1956) Baade, W. 1956, ApJ, 123, 550
- Biretta et al. (1999) Biretta, J. A., Sparks, W. B., & Macchetto, F. 1999, ApJ, 520, 621
- Burbidge et al. (1974) Burbidge, G. R., Jones, T. W., & Odell, S. L. 1974, ApJ, 193, 43
- Cheung et al. (2007) Cheung, C. C., Harris, D. E., & Stawarz, Ł. 2007, ApJ, 663, L65
- Curtis (1918) Curtis, H. D. 1918, Publications of Lick Observatory, 13, 31
- Gracia et al. (2009) Gracia, J., Vlahakis, N., Agudo, I., Tsinganos, K., & Bogovalov, S. V. 2009, ApJ, 695, 503
- Harms et al. (1994) Harms, R. J., Ford, H. C., Tsvetanov, Z. I., et al. 1994, ApJ, 435, L35
- Harris et al. (2003) Harris, D. E., Biretta, J. A., Junor, W., et al. 2003, ApJ, 586, L41
- Harris et al. (2006) Harris, D. E., Cheung, C. C., Biretta, J. A., et al. 2006, ApJ, 640, 211
- Harris et al. (2009) Harris, D. E., Cheung, C. C., Stawarz, Ł., Biretta, J. A., & Perlman, E. S. 2009, ApJ, 699, 305
- Harris et al. (2008) Harris, D. E., Cheung, C. C., Stawarz, L., et al. 2008, in Astronomical Society of the Pacific Conference Series, Vol. 386, Extragalactic Jets: Theory and Observation from Radio to Gamma Ray, ed. T. A. Rector & D. S. De Young, 80
- Jordán et al. (2005) Jordán, A., Côté, P., Blakeslee, J. P., et al. 2005, ApJ, 634, 1002
- Kellermann et al. (2004) Kellermann, K. I., Lister, M. L., Homan, D. C., et al. 2004, ApJ, 609, 539
- Komatsu et al. (2009) Komatsu, E., Dunkley, J., Nolta, M. R., et al. 2009, ApJS, 180, 330
- Kovalev et al. (2009) Kovalev, Y. Y., Aller, H. D., Aller, M. F., et al. 2009, ApJ, 696, L17
- Kovalev et al. (2005) Kovalev, Y. Y., Kellermann, K. I., Lister, M. L., et al. 2005, AJ, 130, 2473
- Kovalev et al. (2007) Kovalev, Y. Y., Lister, M. L., Homan, D. C., & Kellermann, K. I. 2007, ApJ, 668, L27
- Lister et al. (2009a) Lister, M. L., Aller, H. D., Aller, M. F., et al. 2009a, AJ, 137, 3718
- Lister et al. (2009b) Lister, M. L., Cohen, M. H., Homan, D. C., et al. 2009b, AJ, 138, 1874
- Lobanov (1998) Lobanov, A. P. 1998, A&A, 330, 79
- Ly et al. (2007) Ly, C., Walker, R. C., & Junor, W. 2007, ApJ, 660, 200
- Madrid (2009) Madrid, J. P. 2009, AJ, 137, 3864
- Marscher (2008) Marscher, A. P. 2008, in Astronomical Society of the Pacific Conference Series, Vol. 386, Extragalactic Jets: Theory and Observation from Radio to Gamma Ray, ed. T. A. Rector & D. S. De Young, 437–443
- Marscher et al. (1979) Marscher, A. P., Marshall, F. E., Mushotzky, R. F., et al. 1979, ApJ, 233, 498
- Petrov et al. (2009) Petrov, L., Gordon, D., Gipson, J., et al. 2009, Journal of Geodesy, 83, 859
- Petrov et al. (2008) Petrov, L., Kovalev, Y. Y., Fomalont, E. B., & Gordon, D. 2008, AJ, 136, 580
- Seyfert (1943) Seyfert, C. K. 1943, ApJ, 97, 28
- Shklovsky (1964) Shklovsky, I. S. 1964, Soviet Astronomy, 7, 748
- Stawarz et al. (2006) Stawarz, Ł., Aharonian, F., Kataoka, J., et al. 2006, MNRAS, 370, 981
- Ulvestad & Wrobel (2009) Ulvestad, J. S. & Wrobel, J. M. 2009, VLBA status summary, http://www.vlba.nrao.edu/astro/obstatus/current/obssum.html, NRAO
- Urry & Padovani (1995) Urry, C. M. & Padovani, P. 1995, PASP, 107, 803
- Walker et al. (2008) Walker, R. C., Ly, C., Junor, W., & Hardee, P. J. 2008, Journal of Physics Conference Series, 131, 012053
- Wang & Zhou (2009) Wang, C. & Zhou, H. 2009, MNRAS, 395, 301