FERMI LAT OBSERVATIONS OF SUPERNOVA REMNANTS INTERACTING WITH MOLECULAR CLOUDS
Abstract
We report the detection of -ray emission coincident with four supernova remnants (SNRs) using data from the Large Area Telescope on board the Fermi Gamma-ray Space Telescope. G349.7+0.2, CTB 37A, 3C 391, and G8.7–0.1 are SNRs known to be interacting with molecular clouds, as evidenced by observations of hydroxyl (OH) maser emission at 1720 MHz in their directions. SNR shocks are expected to be sites of cosmic ray acceleration, and clouds of dense material can provide effective targets for production of -rays from -decay. The observations reveal unresolved sources in the direction of G349.7+0.2, CTB 37A, and 3C 391, and a possibly extended source coincident with G8.7–0.1, all with significance levels greater than 10.
Subject headings:
gamma rays: ISM — ISM: individual (G349.7+0.2, CTB 37A, 3C 391, G8.7–0.1) — ISM: supernova remnants1. INTRODUCTION
The case for cosmic ray acceleration at supernova remnant (SNR) shocks has found increasing support in observational evidence, both from the thermal and non-thermal components of the emission from these objects. The production of relativistic electrons has been clearly established from the non-thermal X-ray emission detected from several shell-type SNRs, e.g., SN 1006 (Koyama et al., 1995; Reynolds, 1998), RX J1713.7-3946 (Koyama et al., 1997; Slane et al., 1999), and Vela Jr. (Aschenbach, 1998; Slane et al., 2001). Additionally, the dynamical properties of some SNRs suggest that a significant fraction of the explosion energy is going into the acceleration of ions to relativistic speeds, like in the case of 1E 0102.2-7219 (Hughes et al., 2000). X-ray measurements of the relative positions of the forward and reverse shocks, and contact discontinuity in Tycho’s SNR also indicate modification of the remnant dynamics by the acceleration of cosmic-ray ions (Warren et al., 2005). -ray emission in the TeV range from some SNRs, observed with ground-based telescopes, seems to confirm that particles are indeed being accelerated to energies approaching the knee of the cosmic ray spectrum (Enomoto et al., 2002; Aharonian et al., 2007a; Katagiri et al., 2005; Aharonian et al., 2007b). However, there is growing debate as to whether the origin of this high energy emission is hadronic or leptonic in nature, as reviewed in Reynolds (2008).
Pion production, followed by decay, is a natural result of the interaction of relativistic ions, like those generated through diffusive shock acceleration at SNR shocks, with dense material (Drury et al., 1994; Baring et al., 1999). Hence, SNRs known to be interacting with molecular clouds present particularly interesting targets for the detection of -ray emission of hadronic origin, as suggested by Frail et al. (1996) and Claussen et al. (1997). The detection of hydroxyl (OH) masers at 1720 MHz is a very useful tool for finding this type of interactions, as they indicate the presence of shocked clouds of dense molecular material (Wardle & Yusef-Zadeh, 2002; Hewitt et al., 2009).
Observations in the MeV to GeV range are especially important in order to identify signatures of -decay, because the photon spectrum from this process has a distribution that peaks approximately at 70 MeV (Reynolds, 2008). The Energetic Gamma-Ray Experiment Telescope (EGRET), on board the Compton Gamma-Ray Observatory, found a host of discrete -ray sources in the GeV band possibly associated with Galactic SNRs (Torres et al., 2003). However, due to poor spatial resolution and other instrumental constraints, it has proven impossible to determine unambiguously the origins of these EGRET sources. The Large Area Telescope (LAT), onboard the Fermi Gamma-ray Telescope has opened a new window for studying SNRs in the GeV energy range, due to its improved sensitivity and resolution. For example, the detection of an extended LAT source coincident with SNR W51C (G49.2-0.7), was reported by (Abdo et al., 2009d), and their study suggests that -decay emission is the dominant component of the -ray flux observed in its direction. The observation of OH maser (1720 MHz) emission in the direction of this SNR, reported by Green et al. (1997), suggests that it is interacting with a cloud of dense material.
SNRs G349.7+0.2, CTB 37A, 3C 391 and G8.7–0.1, are known to be interacting with molecular clouds, as evidenced by OH masers observed in their directions (Frail et al., 1996; Hewitt & Yusef-Zadeh, 2009). In this paper we report the detection of four LAT sources coincident with these SNRs, and on the results of our detailed study of -ray emission in their regions. After a description of how the LAT data are analyzed in this work in Section 2, we present the results of the observations and put them in context for each individual object in Section 3. A discussion of the results is given in Section 4.
2. OBSERVATIONS AND DATA TREATMENT
The LAT -ray detector is the main instrument on board the Fermi Gamma-ray Space Telescope, which was launched on 2008 June 11. The LAT is a pair-conversion, imaging, large field-of-view (FoV) -ray telescope, that covers a wide energy range, from 20 MeV and up to 300 GeV. High precision tracking of electrons and positrons resulting from pair conversion allow the LAT to reconstruct the direction of -rays incident on the detector, and measurements of the energy of the subsequent electromagnetic showers are performed in its calorimeter. The FoV is 2.3 sr and the point-spread function (PSF) varies largely with photon energy, and improves at higher energies. The converter-tracker device has 16 planes of high-Z material, which are divided in two regions. The front section contains the first 12 layers which are thinner and optimize the PSF, and the back region has 4 thicker planes, which maximize the effective area at the expense of a lower angular resolution relative to the front section. Further details about the instrument and data calibration are described in Atwood et al. (2009).
The LAT, while operating on ”sky survey” mode, observes the entire sky every two orbits (approximately 3 hr). In this work, 15 months of LAT data (from 2008 August until 2009 November) are analyzed. Only events belonging to the diffuse class, which reduces the residual background rate as explained in detail in Atwood et al. (2009), have been selected for this study. The updated instrument response functions (IRFs) used are called ”Pass6 version 3”, which were developed using in-flight data and consider pile-up and coincidence effects not included in the pre-launch analysis (Rando et al., 2009). The systematic uncertainties of the effective area, for the IRF used, are energy dependent: 10% at 100 MeV, decreasing to 5% at 560 MeV, and increasing to 20% at 10 GeV (Abdo et al., 2009). Additionally, only events coming from zenith angles smaller than 105∘ are selected in order to reduce the contribution from terrestrial albedo -rays (Abdo et al., 2009c).
The -ray data in the direction of G349.7+0.2, CTB 37A, 3C 391 and G8.7–0.1 are analyzed using the Fermi Science Tools111The Science Tools package v9r15p2, and related documentation, is distributed by the Fermi Science Support Center at http://fermi.gsfc.nasa.gov/ssc. In order to study spatial distribution, position and spectral characteristics, the maximum likelihood fitting technique is employed using gtlike. The likelihood statistical approach is used on LAT data because of the low detection rates and the extent of the PSF, and it estimates the best model parameters by maximizing the joint probability for the data given the emission model (Mattox et al., 1996). The emission models used in gtlike place individual sources, with particular spectral properties, at fixed positions, and include a Galactic diffuse component resulting from the interactions of cosmic rays with interstellar material and photons, and an isotropic one that accounts for the extragalactic diffuse and residual backgrounds. In this work, the mapcube file gll_iem_v02.fit is used to describe the -ray emission from the Milky Way, and the isotropic component is modeled using the isotropic_iem_v02.txt table.
2.1. Spatial Analysis
Spatial analysis is performed using -ray data in the energy range 2-200 GeV, and converted in the front section, in order to improve the angular resolution. The 68% containment radius angle for normal incidence front-selected photons in this energy band is . To analyze the neighborhoods of the SNRs studied, count maps of the region centered on the region of interest (ROI) are constructed, and smoothed by a Gaussian kernel to match the PSF of the events selected.
In order to determine the detection significance and the precise position of the sources associated with the objects of interest, Galactic and isotropic backgrounds are modeled and test statistic maps are constructed using gttsmap. The test statistic is the logarithmic ratio of the likelihood of a point source being at a given position in a grid, to the likelihood of the model without the additional source, . The resolution of these maps, set by the size of the grid used, is .
2.2. Spectroscopy
The study of the spectral energy distribution (SED) characteristics of each of the sources associated with G349.7+0.2, CTB 37A, 3C 391, and G8.7–0.1, is performed through likelihood analysis with gtlike. Events converted in both front and back sections, and in the energy range 0.2-51.2 GeV, are included in the study. The lower energy bound is selected to avoid source confusion, to avoid the rapidly changing effective area of the instrument at low energies, and because of the large uncertainty below 0.2 GeV related to the Galactic diffuse model used.
The spectral analysis is performed using gtlike to model the flux at each energy bin and estimate, through the maximum likelihood technique, the best-fit parameters. Background sources from the 3 month Fermi LAT Bright Gamma-ray Source List (Abdo et al., 2009a), and detected pulsars from the 11 month Fermi LAT Pulsar Catalogue (Abdo et al., 2009b), within a radius of the sources of interest are modeled. Sources detected in the test statistic map of each field with significance greater than are also included in the background model. Additionally, the analysis was repeated using all background sources in the recently released one-year Fermi LAT First Source Catalog (1FGL) in each region222 The data for the 1451 sources in the Fermi LAT First Source Catalog is made available by the Fermi Science Support Center at http://fermi.gsfc.nasa.gov/ssc/data/access/lat/1yr_catalog/, with no significant effect on the results. The normalization of the Galactic diffuse component is left free at each energy step. As an addition to the statistical uncertainties associated with the likelihood approach, and the systematic errors related to the IRF as mentioned above, the uncertainty of the underlying Galactic diffuse level is considered. The treatment of this error in the evaluation of the systematic uncertainties is performed by artificially changing the normalization of the Galactic background by , similarly to the analysis in Abdo et al. (2009d).
3. RESULTS AND ANALYSIS
3.1. G349.7+0.2
G349+0.2 has one of the highest radio and X-ray surface brightnesses in the Milky Way. Its radio image is characterized by a small diameter (approximately ) partial shell, somewhat enhanced toward the southern and eastern limbs (Shaver et al., 1985). Five OH maser emission spots (at 1720 MHz) were detected in the direction of this SNR, which suggests that it is interacting with a dense molecular cloud (Frail et al., 1996). The velocity of these maser lines places the regions of shocked material at a distance kpc. The characteristics of the emission detected from molecular transitions of 12CO, 13CO, CS, HCO+, H2CO, HCN and SO, at similar velocities to those of the OH masers, are further evidence of molecular cloud-shock interaction (Lazendic et al., 2004; Reynoso & Mangum, 2001).
In the X-ray band, the morphology of the remnant observed with ASCA and Chandra is similar to that from the radio, and the high photon absorption of its X-ray spectrum ( cm-2) is consistent with the distance estimate from maser emission (Yamauchi et al., 1998; Slane et al., 2002; Lazendic et al., 2005). In the analysis of the Chandra observations, Lazendic et al. (2005) find that the overall X-ray emission of the remnant is best-fit by a nonequilibrium ionization plasma model with enhanced Si abundance, and temperature keV. The fit is significantly improved with the addition of a softer component of equilibrium thermal plasma with solar abundances and temperature keV. The Si overabundance suggests that the harder spectral component is emission from the supernova ejecta, and the softer component, with solar abundances, is related to shocked circumstellar material. From the volume emission measure these authors estimate the hydrogen density for the soft component to be cm-3, where is the volume filling factor, and assuming that the distance is 22 kpc and . The Chandra observations also revealed X-ray emission from a point source, CXOU J171801.0-372617, inside the SNR shell, with X-ray characteristics similar to the compact central object (CCO) class, such as the source in Cas A, and unlike those for energetic pulsars (Pavlov et al., 2004).
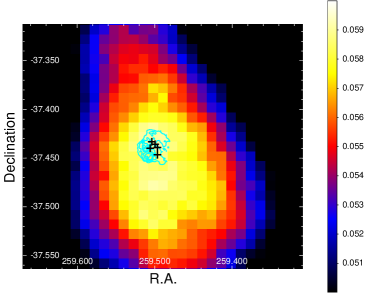
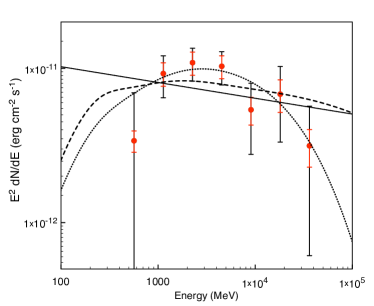
The Fermi LAT count map around G349.7+0.2 is shown in Figure 1a, overlaid with the contours of the Chandra X-ray map. A bright unresolved -ray source is coincident with the position of the remnant, and with that of the source designated as 1FGL J1717.9-3729 in the one-year Fermi LAT First Source Catalog. The significance of the detection, obtained from the evaluation of the test statistic in the region, is . The residual test statistic map shows no evidence that the source is spatially extended. The spectrum of the -ray emission is shown in Figure 2a, and its shape suggests that the spectral index steepens above a few GeV. The best-fit model for the data yields a spectral index of . The addition of an exponential cutoff is found to marginally improve the fit, the cutoff energy is estimated to be GeV, and the spectral index is . Table 1 summarizes the characteristics of the best fit spectral model of the emission from this source, as well as its position. The luminosity in the 0.1-100 GeV band of this source is estimated to be erg s-1, at a presumed distance of 22 kpc.
3.2. CTB 37A
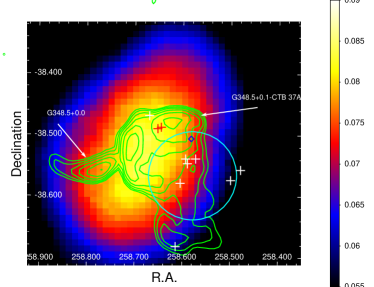
The SNR CTB 37A (G348.5+0.1) is located in a complicated region composed of three different remnants (Figure 1b). Its radio emission overlaps that of a second SNR, G348.5-0.0 on the east (Kassim et al., 1991), and a third remnant, CTB 37B, lies approximately 20′ to the north. The radio morphology of CTB 37A appears as a well-defined partial shell towards the north and east, and an extended outbreak to the south. H I absorption measurements by Caswell et al. (1975), toward both CTB 37A and CTB 37B, place constraints on the distance to the CTB 37A/B complex, which is estimated to lie between 6.6 kpc and 11.4 kpc, using a distance to the Galactic center of 8.5 kpc.
| Spatial | Spectral Fit | |||||||||
| R.A. | Decl. | F(0.1-100 GeV) | ||||||||
| Name | (deg) | (deg) | (deg) | (10-7 photons cm-2 s-1) | (dof) | TS Value | ||||
| G349.7+0.2 | 259.47 | -37.50 | 0.03 | 1.12(5) | 108 | |||||
| CTB 37A | 258.65 | 38.52 | 0.04 | 2.64(6) | 294 | |||||
| 3C 391 | 282.26 | -0.92 | 0.03 | 0.80(6) | 140 | |||||
| G8.7–0.1 | 271.33 | -21.64 | 0.03 | 1.22(6) | 486 | |||||
Various OH masers have been detected toward the interior of CTB 37A at 1720 MHz (Frail et al., 1996). Eight of these have velocities close to the upper velocity limit for this object given by the neutral hydrogen measurements (-65 km s-1). At this velocity, Reynoso & Mangum (2000) observed, in the CO () transition at 115 GHz, three molecular clouds coincident with the maser spots and estimated the distance to the clouds to be 11.3 kpc.
Aharonian et al. (2008) detected extended thermal X-ray emission from inside the NE shell of the remnant, using observations with Chandra and XMM-Newton. This study found consistent fit results from the detectors on both X-ray observatories, with plasma temperature T keV and absorption cm-2. Additionally, these authors observed an extended non-thermal X-ray source, CXOU J171419.8-383023, toward the NW of the CTB 37A complex (see Figure 1b), which they suggest might be associated with the emission of a pulsar wind nebula (PWN). A VHE (100 GeV) -ray source, HESS J1714-385, is coincident with CTB 37A (Figure 1b), and it has been suggested this is a signature of the interaction between the remnant’s shock wave and the surrounding clouds of dense material (Aharonian et al., 2008).
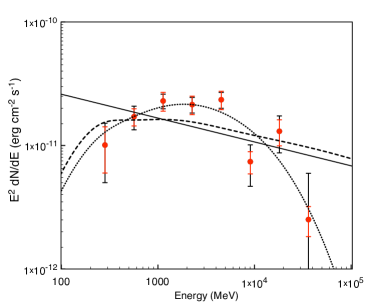
In Figure 1b, the smoothed GeV map of the region around CTB 37A is shown. The -ray emission in the Fermi LAT range appears as an unresolved source whose centroid lies within the eastern radio shell of CTB 37A, with detection significance 17. This source is coincident with 1FGL J1714.5-3830. The residual test statistic map gives no indication that this source is extended beyond the PSF of the instrument. The spectrum of this source is displayed in Figure 2b, together with the best-fit models. The simple power-law model for the data yields a spectral index . However, the fit is slightly improved by including an exponential cutoff at GeV, with spectral index . Table 1 summarizes the result of the analysis of this source. The luminosity in the 0.1-100 GeV band of this source is estimated to be erg s-1, at a presumed distance of 11.3 kpc.
3.3. 3C 391
3C391 (G31.9+0.0) is a radio bright SNR with an irregular spatial structure. Observations with the Very Large Array (VLA)333The VLA is operated by the National Radio Astronomy Observatory, which is a facility of the National Science Foundation, operated under cooperative agreement by Associated Universities, Inc. in the radio band uncovered an elongated morphology, which extends from northwest to southeast (Reynolds & Moffett, 1993). The shell surrounding the radio emission is enhanced toward the NW, and does not extend to the SE, where it appears that the SNR has broken out into a lower density region.
Frail et al. (1996) observed two OH maser spots coincident with 3C 391 at 1720 MHz, with velocities (105 and 110 km s-1) that agree well with the neutral hydrogen absorption velocity (Radhakrishnan et al., 1972). The H I absorption measurements indicate a distance of at least 7.2 kpc, and the absence of absorption at negative velocities suggests an upper limit of 11.4 kpc, using a distance to the center of the Galaxy of 8.5 kpc. The case for the interaction of 3C 391 with a molecular cloud, as suggested by the maser emission in the direction of the SNR, is further strengthened by the observations of CO () emission in the region (Wilner et al., 1998). The CO maps show evidence that 3C 391 resides at the edge of a molecular cloud located to the NW of the SNR, and that the ”breakout” morphology is produced as the SNR blast wave reaches lower density regions outside the cloud.
Observations with ASCA (Chen & Slane, 2001) and Chandra (Chen et al., 2004) show that the X-ray emission associated with this object is thermal and clumpy in nature, and its brightness peaks well inside the radio shell. The plasma temperature derived from the X-ray observations is keV, and the absorption column density is found to increase from SE to NW (from 0.6 to 4.1 ), which is consistent with the existence of molecular cloud to the northwest (Chen et al., 2004). These authors also discovered an unresolved X-ray source on the NW border, with spectral characteristics similar to those of CCO class of objects.
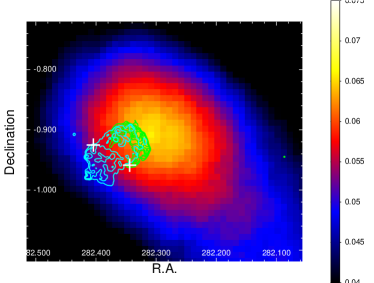
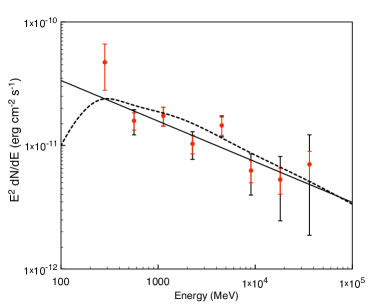
The smoothed photon count map from the Fermi-LAT data is shown in Figure 1c, and presents a strong case for an association between a GeV source and 3C 391. The unresolved -ray source is detected with a 13 significance and the peak of the test statistic map is 4′ from the northwestern radio shell and the position of the closest maser spot. This source is coincident with 1FGL J1849.0-0055. The SED of the emission from this source is best described by a power law model, with spectral index . The SED is shown in Figure 2c, and spectral characteristics are presented in Table 1. The luminosity of this source in the 0.1-100 GeV band is erg s-1, at a presumed distance of 8 kpc.
3.4. G8.7–0.1 (W30)
The rather large SNR G8.7–0.1, together with nine discrete H II regions, forms the W30 complex. G8.7–0.1 was identified as a Galactic SNR on the basis of the observation of a 45′ diameter area of extended non-thermal radio emission (Odegard, 1986; Kassim & Weiler, 1990).
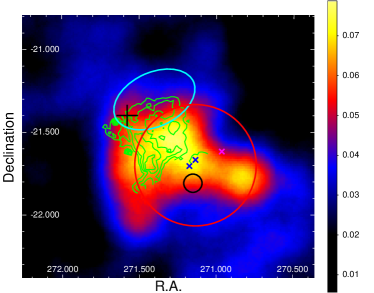
Hewitt & Yusef-Zadeh (2009) detected a single OH maser at 36 km s-1, on the eastern edge of G8.7–0.1. This relatively bright emission at 1720 MHz does not coincide with any of the compact radio sources, and hence they associate it with the SNR, and using the rotation curve of Fich et al. (1989) they estimate a distance to the remnant of kpc. An extended -ray source, HESS J1804-216, has been detected to the southwest of the remnant (Figure 1d), which could be further evidence of shock interaction with clouds of dense material (Aharonian et al., 2006). Several other sources in the field have been suggested as possible associations with the source HESS J1804-216, and they are shown in Figure 1d (Clifton & Lyne, 1986; Brogan et al., 2006; Bamba et al., 2007; Kargaltsev et al., 2007a, b; Higashi et al., 2008).
Finley & Ögelman (1994) detected diffuse thermal X-ray emission from the northern half of the remnant in the 0.1-2.4 keV band with ROSAT, and using Sedov analysis estimated the distance to the remnant to be kpc kpc. The estimated plasma temperature from these X-ray observations is keV, the absorption column density is cm-2, and the derived ambient density is . These authors also determined the distance to the H II regions associated with remnant to be kpc, using the kinematic measurements of Kassim & Weiler (1990) and more recent Galactic rotation models.
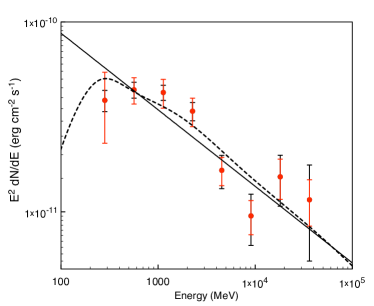
The -ray photon count map in the 2-200 GeV range of the crowded vicinity of the W30 complex is shown in Figure 1d. The -ray emission in the region appears as a source centered on a position inside the radio boundary of G8.7–0.1. This detection is coincident with 1FGL J1805.2-2137. The residual test statistic map does not rule out the possibility that this source is extended. The significance of the detection is . The spectrum of this source, shown in Figure 2d, seems to steepen above 2 GeV, and flatten at GeV. For a single power-law model the best-fit spectral index is . The spectral characteristics of this region are summarized in Table 1 . The luminosity in the 0.1-100 GeV band of this source is erg s-1, at a presumed distance of 4.5 kpc.
4. DISCUSSION
The detection with the Fermi-LAT of unresolved -ray sources in the direction of G349.7+0.2, CTB 37A, and 3C 391, as well as a possibly extended region of emission coincident with G8.7–0.1 is reported in this work. The best-fit positions and spectral characteristics of these sources are summarized in Table 1.
The shapes of the spectra of the sources coincident with G349.7-0.5, 3C 391 and G8.7–0.1 do not seem consistent with what has been observed from pulsars in -rays. Abdo et al. (2009b) found the SED of pulsars in the Fermi LAT band to be best described by power-law distributions, with exponential cutoffs in the energy range 1-6 GeV (the only exception, PSR J1833-1034 with cutoff energy 8 GeV, was reported to be poorly measured). The spectral characteristics of the sources coincident with 3C 391 and G8.7–0.1 do not suggest an exponential cutoff at all, and the spectrum of G349.7+0.2 is very modestly improved by a cutoff at GeV, which is very high for a -ray pulsar. Additionally, there are no pulsars from the Australian Telescope National Facility (ATNF) Pulsar Catalogue444The positions and characteristics of the 1509 pulsars in ATNF catalogue, as well as further documentation, can be accessed at http://www.atnf.csiro.au/research/pulsar/psrcat. coincident with this source (Manchester et al., 2005).
The spectrum of the source coincident with CTB 37A is well fit by a power law with an exponential cutoff at energy GeV, and hence does not rule out a pulsar hypothesis. However, there are no ATNF pulsars within 20′ radius of this source.
Given the lack of evidence for significant contribution by a pulsar, and the known presence of maser emission for each remnant, an appropriate hypothesis appears to be that the -ray sources are products of SNR interactions with molecular clouds. To investigate properties of the expected spectra, we have considered the scenario in which the -rays are produced by decay of accelerated hadrons. In order to reproduce the observed spectra, we have used a model based on that from Kamae et al. (2006) using a scaling factor of 1.85 for helium and heavier nuclei (Mori, 2009), and adopted a power law model with an exponential cutoff for the energy distribution of the protons:
| (1) |
where is the proton energy cutoff. Table 2 presents sets of representative model parameters that adequately reproduce the observed -ray spectra (see Figure 2). While the spectra of SNRs 3C 391 and G8.7–0.1 are well matched by models with proton distributions with spectral indices and high-energy cutoff, , the spectra of G349.7+0.2 and CTB 37A require harder proton distributions, , and . The model provides an estimate of the density of the material the SNR shock wave is impacting, given reasonable assumptions about the shock compression ratio, , and the fraction of the total supernova explosion energy that is converted into cosmic ray energy. Here we assume , , and erg; we use distances derived from observations at other wavelengths for each SNR. In Table 2, estimates of the densities of the -ray emitting material are compared to the densities derived from X-ray observations in other studies (Lazendic et al., 2005; Chen et al., 2004; Finley & Ögelman, 1994).
| Model Parameters | ||||||
| Object | n | n | d | |||
| (TeV) | (cm | (cm | (kpc) | |||
| G349.7+0.2 | 1.7 | 0.16 | 65 | 2.5 | 22 | |
| CTB 37A | 1.7 | 0.08 | 37 | … | 11.3 | |
| 3C 391 | 2.4 | 100 | 28 | 1 | 8 | |
| G8.7-0.1 | 2.45 | 100 | 18 | 0.03 | 4.5 | |
| Densities derived using the -ray spectrum obtained from the analysis of Fermi-LAT observations. | ||||||
| Densities derived from X-ray observations (see text for references). No estimate of the ambient density of SNR CTB 37A is provided in Aharonian et al. (2008). | ||||||
The values obtained from the -decay model fits to the -ray spectra of the SNRs are much higher than those from X-ray observations. It is possible that, upon interacting with dense ambient material, instabilities in the postshock flow result in considerable clumping of material. The denser regions would then not be expected to yield significant X-ray emission, although radiative shocks would then be expected to produce optical emission from these regions. If the filling fraction of the clumped material is large, then the densities inferred for the X-ray emitting material are underestimates, potentially leading to more reasonable values for the density contrast between clump and interclump regions.
Alternatively, the energetic particles that escape the particle acceleration region at the SNR shock could stream ahead of the shock and encounter clouds of molecular material, where the much higher density could dramatically enhance the -ray emission (Aharonian & Atoyan, 1996; Gabici & Aharonian, 2007). This scenario has been proposed as a possible explanation of the observed -ray fluxes in the direction of some Galactic SNRs, including RX J1713.7-3946 (Butt et al., 2001) and W28 (Fujita et al., 2009). Lee et al. (2008) model the interaction of particles accelerated by the diffusive shock of an SNR with arbitrary matter distributions outside the remnant blast wave, including an appropriate treatment of the escape and diffusion of these particles. These authors, as well as other works (Gabici & Aharonian, 2007; Rodriguez Marrero et al., 2008; Gabici et al., 2008), show that clouds of dense material in close proximity to SNRs can have an important, and even dominant contribution to the -ray flux from these regions. It is important to note, however, that the escaping particles are predominantly from the high-energy portion of the spectrum; the observed spectra, which extend to low energies, may be problematic for such a scenario.
An alternative scenario is that the -ray emission coincident with these sources is of leptonic origin. Bremsstrahlung and inverse Compton (IC) radiation from the nonthermal electron population have been proposed as production mechanisms of -rays in SNRs (e.g. Bykov et al., 2000), but these models present certain difficulties as well. Non-thermal bremsstrahlung can be the dominant emission process in this band for electron-to-proton ratios, , greater than (Gaisser et al., 1998). However, cosmic-ray abundance ratios suggest , and models for -ray emission from other SNRs (e.g., RX J1713.7-3946) favor even smaller values (Morlino et al., 2009; Zirakashvili & Aharonian, 2010; Ellison et al., 2010), making the bremsstrahlung-dominated model appear less likely. The IC-dominated scenario, on the other hand, is difficult to reconcile with the observed characteristics of the sources studied in this work. The expected spectral index for IC emission () is considerably harder than the values obtained here ().
In summary, using observations with the Fermi-LAT, we have revealed -ray emission from four SNRs known to be interacting with molecular clouds. In each case the inferred density is high, assuming a hadronic origin for the -rays, consistent with the presence of dense material indicated by maser emission. However, estimated densities of the ambient material derived under simple geometric assumptions are in considerable excess of those derived from the hot X-ray gas observed in the SNRs. More detailed modeling of the X-ray and -ray emission under a variety of scenarios for the ambient medium is required to address the emission mechanism more fully. These results are consistent with the scenario presented by Abdo et al. (2009d) for SNR W51C, and further studies of other such systems and their GeV-scale -ray emission with the Fermi-LAT are of particular interest.
References
- Abdo et al. (2009a) Abdo, A. A., et al. 2009a, ApJS, 183, 46
- Abdo et al. (2009b) Abdo, A. A., et al. 2009b, ApJS, 187, 460
- Abdo et al. (2009c) Abdo, A. A., et al. 2009c, Phys. Rev. D, 80, 122004
- Abdo et al. (2009d) Abdo, A. A., et al. 2009d, ApJ, 706, L1
- Abdo et al. (2009) Abdo, A. A., et al. 2009, Phys. Rev. Lett., 103, 251101
- Aharonian & Atoyan (1996) Aharonian, F. A., & Atoyan, A. M. 1996, A&A, 309, 917
- Aharonian et al. (2006) Aharonian, F., et al. 2006, ApJ, 636, 777
- Aharonian et al. (2007a) Aharonian, F., et al. 2007a, A&A, 470, 475
- Aharonian et al. (2007b) Aharonian, F., et al. 2007b, ApJ, 661, 236
- Aharonian et al. (2008) Aharonian, F., et al. 2008, A&A, 490, 685
- Aschenbach (1998) Aschenbach, B. 1998, Nature, 396, 141
- Atwood et al. (2009) Atwood, W. B., et al. 2009, ApJ, 697, 1071
- Bamba et al. (2007) Bamba, A., et al. 2007, PASJ, 59, 209
- Baring et al. (1999) Baring, M. G., Ellison, D. C., Reynolds, S. P., Grenier, I. A., & Goret, P. 1999, ApJ, 513, 311
- Brogan et al. (2006) Brogan, C. L., Gelfand, J. D., Gaensler, B. M., Kassim, N. E., & Lazio, T. J. W. 2006, ApJ, 639, L25
- Butt et al. (2001) Butt, Y. M., Torres, D. F., Combi, J. A., Dame, T., & Romero, G. E. 2001, ApJ, 562, L167
- Bykov et al. (2000) Bykov, A. M., Chevalier, R. A., Ellison, D. C., & Uvarov, Y. A. 2000, ApJ, 538, 203
- Caswell et al. (1975) Caswell, J. L., Murray, J. D., Roger, R. S., Cole, D. J., & Cooke, D. J. 1975, A&A, 45, 239
- Chen & Slane (2001) Chen, Y., & Slane, P. O. 2001, ApJ, 563, 202
- Chen et al. (2004) Chen, Y., Su, Y., Slane, P. O., & Wang, Q. D. 2004, ApJ, 616, 885
- Claussen et al. (1997) Claussen, M. J., Frail, D. A., Goss, W. M., & Gaume, R. A. 1997, ApJ, 489, 143
- Clifton & Lyne (1986) Clifton, T. R., & Lyne, A. G. 1986, Nature, 320, 43
- Drury et al. (1994) Drury, L. O., Aharonian, F. A., & Voelk, H. J. 1994, A&A, 287, 959
- Ellison et al. (2010) Ellison, D. C., Patnaude, D. J., Slane, P., & Raymond, J. 2010, ApJ, 712, 287
- Enomoto et al. (2002) Enomoto, R., et al. 2002, Nature, 416, 823
- Fich et al. (1989) Fich, M., Blitz, L., & Stark, A. A. 1989, ApJ, 342, 272
- Finley & Ögelman (1994) Finley, J. P., & Ögelman, H. 1994, ApJ, 434, L25
- Frail et al. (1996) Frail, D. A., Goss, W. M., Reynoso, E. M., Giacani, E. B., Green, A. J., & Otrupcek, R. 1996, AJ, 111, 1651
- Fujita et al. (2009) Fujita, Y., Ohira, Y., Tanaka, S. J., & Takahara, F. 2009, ApJ, 707, L179
- Gabici & Aharonian (2007) Gabici, S., & Aharonian, F. A. 2007, ApJ, 665, L131
- Gabici et al. (2008) Gabici, S., Casanova, S., & Aharonian, F. A. 2008, in AIP Conf. Ser. 1085, High Energy Gamma-ray Astronomy, ed. F. A. Aharonian, W. Hofmann, & F. Rieger (New York: AIP), 265
- Gaisser et al. (1998) Gaisser, T. K., Protheroe, R. J., & Stanev, T., 1998 ApJ, 492, 219
- Green et al. (1997) Green, A. J., Frail, D. A., Goss, W. M., & Otrupcek, R. 1997, AJ, 114, 2058
- Hewitt & Yusef-Zadeh (2009) Hewitt, J. W., & Yusef-Zadeh, F. 2009, ApJ, 694, L16
- Hewitt et al. (2009) Hewitt, J. W., Yusef-Zadeh, F., & Wardle, M. 2009, ApJ, 706, L270
- Higashi et al. (2008) Higashi, Y., et al. 2008, ApJ, 683, 957
- Hughes et al. (2000) Hughes, J. P., Rakowski, C. E., & Decourchelle, A. 2000, ApJ, 543, L61
- Kamae et al. (2006) Kamae, T., Karlsson, N., Mizuno, T., Abe, T., & Koi, T. 2006, ApJ, 647, 692
- Kargaltsev et al. (2007a) Kargaltsev, O., Pavlov, G. G., & Garmire, G. P. 2007a, ApJ, 670, 643
- Kargaltsev et al. (2007b) Kargaltsev, O., Pavlov, G. G., & Garmire, G. P. 2007b, ApJ, 660, 1413
- Kassim & Weiler (1990) Kassim, N. E., & Weiler, K. W. 1990, ApJ, 360, 184
- Kassim et al. (1991) Kassim, N. E., Weiler, K. W., & Baum, S. A. 1991, ApJ, 374, 212
- Katagiri et al. (2005) Katagiri, H., et al. 2005, ApJ, 619, L163
- Koyama et al. (1997) Koyama, K., Kinugasa, K., Matsuzaki, K., Nishiuchi, M., Sugizaki, M., Torii, K., Yamauchi, S., & Aschenbach, B. 1997, PASJ, 49, L7
- Koyama et al. (1995) Koyama, K., Petre, R., Gotthelf, E. V., Hwang, U., Matsuura, M., Ozaki, M., & Holt, S. S. 1995, Nature, 378, 255
- Lazendic et al. (2005) Lazendic, J. S., Slane, P. O., Hughes, J. P., Chen, Y., & Dame, T. M. 2005, ApJ, 618, 733
- Lazendic et al. (2004) Lazendic, J. S., Wardle, M., Whiteoak, J. B., Burton, M. G., & Green, A. J. 2004, arXiv:astro-ph/0409302
- Lee et al. (2008) Lee, S., Kamae, T., & Ellison, D. C. 2008, ApJ, 686, 325
- Manchester et al. (2005) Manchester, R. N., Hobbs, G. B., Teoh, A., & Hobbs, M. 2005, AJ, 129, 1993
- Mattox et al. (1996) Mattox, J. R., et al. 1996, ApJ, 461, 396
- Mori (2009) Mori, M. 2009, Astropart. Phys., 31, 341
- Morlino et al. (2009) Morlino, G., Amato, E., & Blasi, P. 2009, MNRAS, 392, 240
- Odegard (1986) Odegard, N. 1986, AJ, 92, 1372
- Pavlov et al. (2004) Pavlov, G. G., Sanwal, D., & Teter, M. A. 2004, in IAU Symposium, Vol. 218, Young Neutron Stars and Their Environments, ed. F. Camilo & B. M. Gaensler, 239
- Radhakrishnan et al. (1972) Radhakrishnan, V., Goss, W. M., Murray, J. D., & Brooks, J. W. 1972, ApJS, 24, 49
- Rando et al. (2009) Rando, R., et al. 2009, arXiv:0907.0626
- Reynolds (1998) Reynolds, S. P. 1998, ApJ, 493, 375
- Reynolds (2008) Reynolds, S. P. 2008, ARA&A, 46, 89
- Reynolds & Moffett (1993) Reynolds, S. P., & Moffett, D. A. 1993, AJ, 105, 2226
- Reynoso & Mangum (2000) Reynoso, E. M., & Mangum, J. G. 2000, ApJ, 545, 874
- Reynoso & Mangum (2001) Reynoso, E. M., & Mangum, J. G. 2001, AJ, 121, 347
- Rodriguez Marrero et al. (2008) Rodriguez Marrero, A. Y., Torres, D. F., de Cea del Pozo, E., Reimer, O., & Cillis, A. N. 2008, ApJ, 689, 213
- Shaver et al. (1985) Shaver, P. A., Salter, C. J., Patnaik, A. R., van Gorkom, J. H., & Hunt, G. C. 1985, Nature, 313, 113
- Slane et al. (2002) Slane, P., Chen, Y., Lazendic, J. S., & Hughes, J. P. 2002, ApJ, 580, 904
- Slane et al. (1999) Slane, P., Gaensler, B. M., Dame, T. M., Hughes, J. P., Plucinsky, P. P., & Green, A. 1999, ApJ, 525, 357
- Slane et al. (2001) Slane, P., Hughes, J. P., Edgar, R. J., Plucinsky, P. P., Miyata, E., Tsunemi, H., & Aschenbach, B. 2001, ApJ, 548, 814
- Torres et al. (2003) Torres, D. F., Romero, G. E., Dame, T. M., Combi, J. A., & Butt, Y. M. 2003, Phys. Rep., 382, 303
- Wardle & Yusef-Zadeh (2002) Wardle, M., & Yusef-Zadeh, F. 2002, Science, 296, 2350
- Warren et al. (2005) Warren, J. S., et al. 2005, ApJ, 634, 376
- White et al. (2005) White, R. L., Becker, R. H., & Helfand, D. J. 2005, AJ, 130, 586
- Whiteoak & Green (1996) Whiteoak, J. B. Z., & Green, A. J. 1996, A&AS, 118, 329
- Wilner et al. (1998) Wilner, D. J., Reynolds, S. P., & Moffett, D. A. 1998, AJ, 115, 247
- Yamauchi et al. (1998) Yamauchi, S., Koyama, K., Kinugasa, K., Torii, K., Nishiuchi, M., Kosuga, T., & Kamata, Y. 1998, Astronomische Nachrichten, 319, 111
- Zirakashvili & Aharonian (2010) Zirakashvili, V. N., & Aharonian, F. A. 2010, ApJ, 708, 965