Gamma-ray excess from a stacked sample of high- and intermediate-frequency peaked blazars observed with the MAGIC telescope
Abstract
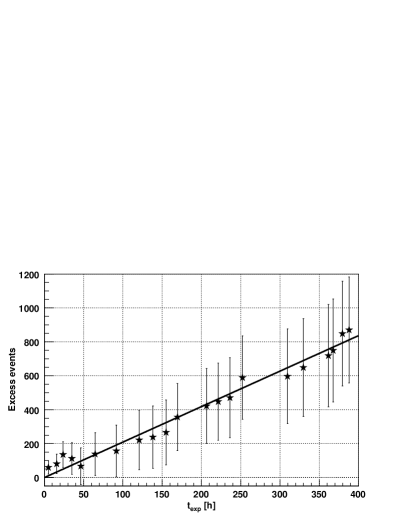
Between 2004 and 2009 a sample of 28 X-ray selected high- and intermediate-frequency peaked blazars with a X-ray flux larger than 2 at 1 keV in the redshift range from 0.018 to 0.361 was observed with the MAGIC telescope at energies above 100 GeV. Seven among them were detected and the results of these observations are discussed elsewhere. Here we concentrate on the remaining 21 blazars which were not detected during this observation campaign and present the 3 sigma (99.7 %) confidence upper limits on their flux. The individual flux upper limits lie between 1.6 % and 13.6 % of the integral flux from the Crab Nebula. Applying a stacking method to the sample of non-detections with a total of 394.1 hours exposure time, we find evidence for an excess with a cumulative significance of 4.9 standard deviations. It is not dominated by individual objects or flares, but increases linearly with the observation time as for a constant source with an integral flux level of 1.5 % of that observed from the Crab Nebula above 150 GeV.
1 INTRODUCTION
MAGIC (Major Atmospheric Gamma-ray Imaging Cherenkov) is currently a system of two 17 m telescopes located atop the Roque de los Muchachos on the Canary Island of La Palma at 2200 m a. s. l. The observations refered to in this study were obtained during the years 2004 - 2009 when MAGIC was still a single-dish telescope. Its 234 tessellated parabolic mirror allows observations of VHE (Very High Energy) -rays between 50 GeV and 10 TeV.
One key goal of the MAGIC telescope project is to determine the properties of extragalactic VHE sources, among which the high-frequency peaked BL Lacertae objects are the most numerous. Blazars are a subclass of radio-loud AGN and belong to the most extreme and powerful objects in the universe. They are characterized by a non-thermal broad-band continuum emission which is highly variable on time scales from years down to minutes (Albert et al., 2007; Aharonian et al., 2007a).
The spectral energy distribution (SED) of blazars is characterized by two bumps in a Fν representation. The first component peaks at energies between IR and hard X-rays, and is assumed to originate from leptonic synchrotron radiation. The maximum of the second peak lies in the -ray energy regime. The origin of this peak can be explained by different and partially concurring models either relying on inverse Compton scattering of electrons (Maraschi et al., 1992; Dermer & Schlickeiser, 1993; Sikora et al., 1994) or proposing hadronic interactions inside the jet (Mannheim, 1993; Muecke & Protheroe, 2001). In the case the synchrotron peak occurs at energies above Hz, (according to Nieppola et al., 2006) these blazars are called HBLs (high-frequency peaked BL Lacertae objects) and for peak energies of Hz IBLs (intermediate BL Lacertae objects).
As of April 2010, altogether 29 blazars were established as VHE sources (24 of them HBLs including M87 as ’misaligned’ blazar)111cf. http://wwwmagic.mppmu.mpg.de/rwagner/sources/ for an up-to-date list., compared to six HBLs, when the MAGIC telescope began its regular observations in December 2004. The sample presented here comprises 21 X-ray selected objects which were not detected in the VHE regime prior to the MAGIC observations. Nine of the objects were already observed between December 2004 and February 2006 and the upper limits of these observations are reported in Albert et al. (2008a). As there have been improvements within the MAGIC analysis, the data of these objects were re-analyzed and the new results are presented in this work. Since no significant detection was attained, upper limits on a 3 (99.7 %) confidence level will be presented.
None of the observed sources showed any variability on diurnal timescales in the VHE regime. Assuming a positive detection in the case of a flaring state, the observations presented here provide a means of investigating the baseline emission of these objects. Therefore, a stacking method applied to the blazar sample can reveal such an emission below the sensitivity limit for each individual object. Together with VERITAS (Benbow, 2009) this is the second stacking analysis which turns out to be successful in the VHE -ray regime. Former experiments like HEGRA failed in detecting a significant signal in a stacking analysis due to their limited sensitivity (cf. for instance Mannheim et al., 1996).
2 BLAZAR SAMPLE
We selected blazars from the compilations from Donato et al. (2001) and Costamante & Ghisellini (2002). Additionally, some objects were chosen based on the synchrotron peak luminosity from Nieppola et al. (2006) and one from the sedentary survey by Giommi et al. (2005).
The main selection criteria are the measured X-ray flux at 1 keV and the distance of the objects. According to Stecker et al. (1996), the synchrotron flux in the X-ray regime is connected to the flux in the VHE regime by
| (1) |
assuming comparable synchrotron and Compton peak luminosities. Therefore objects with high X-ray fluxes are promising candidates for TeV emission. As the absorption of -rays within the extragalactic background light (EBL, see e.g. Kneiske & Dole, 2010) is energy dependent, it is particularly important in the VHE regime to avoid strong attenuation of -rays by limiting the redshift range. According to Kneiske & Dole (2010), at a redshift of , the expected cutoff energy lies well above 200 GeV, allowing MAGIC to observe still with its highest sensitivity. Therefore all objects with a maximum redshift where considered. The energy threshold of the observations increases with the zenith distance . Accounting for this effect, the selection of sources with higher ()during culmination should be limited to . The increasing effect of EBL absorption should, however, imprint itself by a net steepening on the spectrum of the stacked excess.
All criteria are described in detail below. They have been chosen to enhance the probability to detect the sources, hence we selected objects with high fluxes and inverse Compton peaks as well as allowing for the lowest possible energies to be measured with MAGIC.
Compared to Albert et al. (2008a), the selection criteria have been extended. The reason is the enhancement of the sample by taking a wider redshift or zenith distance range into account and including sources whose fitted synchrotron peak flux is high enough even if they show a lower X-ray flux level at 1 keV. The sample is divided into four parts:
-
•
I. X-ray selected HBLs obtained from Donato et al. (2001) and Costamante & Ghisellini (2002): (i) redshift , (ii) X-ray flux , and (iii) zenith distance during culmination. Assuming the same luminosities at 1 keV as at 200 GeV (following the argumentation of Stecker et al., 1996)), the X-ray flux corresponds to a -ray flux at 200 GeV of . This criterion applies to 15 sources including nine sources already observed during cycle 1 of regular MAGIC observations. The sources are listed in Table 1.
-
•
II. Two HBLs obtained from the same compilations taking a wider range in declination and a lower maximum of the redshift into account: 1ES 0033+59.5 and RXS J1136.5+6737. Selection criteria: (i) redshift , (ii) X-ray flux , and (iii) during culmination.
-
•
III. Intermediate BL Lacs taken from Nieppola et al. (2006) with high peak luminosities at the synchrotron peak. Selection criteria: (i) redshift , (ii) synchrotron peak frequency , (iii) flux at the peak , and (iv) zenith angle during culmination. This is valid for three sources: B2 1215+30, PKS 1424+240, and B3 2247+381. All of them can also be found in Donato et al. (2001) but with an X-ray flux at 1 keV below 2 . B2 1215+30 is listed there as LBL. In return it is included in the TeV candidate list in Costamante & Ghisellini (2002).
-
•
IV. One HBL from the sedentary survey (Giommi et al., 2005) with the same selection criteria as applied for point one of the sample: 1RXS J044127.8+150455.
As several other blazars fulfilling these selection criteria were already detected with MAGIC or other VHE instruments, a post-priori selection was done using only the objects which were not yet detected in the VHE regime in advance of the MAGIC observations leaving 21 objects as discussed herein. All blazars in the MAGIC AGN observation program that fulfill these selection criteria either have been detected (or were known in advance) or they are listed here as non-detections.
Table 1 lists all sources in the sample with relevant parameters. In case of multiple flux or spectral slope measurements the mean value is displayed.
| Object | Season | z | log()aaFitted peak frequency from Nieppola et al. (2006) in units of log(Hz). | bbFlux at peak frequency extracted from Nieppola et al. (2006) in units of . | ccFlux and photon spectral index at 1 keV. | ccFlux and photon spectral index at 1 keV. | Cat.ddCompilation where the object appears (C: Costamante & Ghisellini (2002); D: Donato et al. (2001); N: Nieppola et al. (2006); G: Giommi et al. (2005)). The catalog from which the object was selected is marked with a dagger. | Sel. |
|---|---|---|---|---|---|---|---|---|
| [] | crit.eeSelection criteria which are met by the object. | |||||||
| 1ES 0033+595 | 08/2006 – 07/2008 | 0.086ffTentative redshift. | 18.9 | 2.0 | 5.66 | – | C†, N | II |
| 1ES 0120+340 | 08 – 09/2005 | 0.272 | 18.3 | 2.5 | 4.34 | 1.93 | C, D†, G, N | I |
| 1ES 0229+200ggKnown VHE blazar (as of April 2010) due to a detection after the MAGIC observation period. | 08 – 11/2006 | 0.140 | 19.5 | 1.6 | 2.88 | – | C†, N | I,II |
| RX J0319.8+1845ggKnown VHE blazar (as of April 2010) due to a detection after the MAGIC observation period. | 12/2004 – 01/2006 | 0.190 | 17.0 | 0.4 | 1.76 | 2.07 | D†, G, N | I |
| 1ES 0323+022 | 09 – 12/2005 | 0.147 | 19.9 | 6.3 | 3.24 | 2.46 | C, D†, G, N | I,II |
| 1ES 0414+009ggKnown VHE blazar (as of April 2010) due to a detection after the MAGIC observation period. | 12/2005 – 01/2006 | 0.287 | 20.7 | 10.0 | 5.00 | 2.49 | C, D†, G, N | I |
| 1RXS J044127.8+150455 | 10 – 12/2007 | 0.109 | – | – | 4.74 | 2.10 | G† | IV |
| 1ES 0647+250 | 02 – 03/2008 | 0.203ffTentative redshift. | 18.3 | 3.2 | 6.01 | 2.47 | C†, D, N | I |
| 1ES 0806+524ggKnown VHE blazar (as of April 2010) due to a detection after the MAGIC observation period. | 10 – 12/2005 | 0.138 | 16.6 | 1.6 | 4.91 | 2.93 | C, D†, N | I,II |
| 1ES 0927+500 | 12/2005 – 02/2006 | 0.188 | 21.1 | 5.0 | 4.00 | 1.88 | D†, G, N | I |
| 1ES 1011+496ggKnown VHE blazar (as of April 2010) due to a detection after the MAGIC observation period. | 03 – 04/2006 | 0.212 | 16.7 | 1.3 | 2.15 | 2.49 | C, D†, N | I |
| 1ES 1028+511 | 03/2007 – 02/2008 | 0.361 | 18.6 | 1.3 | 4.42 | 2.50 | C, D†, G, N | I |
| RGB J1117+202 | 01/2007 – 03/2008 | 0.140 | – | – | 6.93 | 1.90 | C†, D, G | I,II |
| RX J1136.5+6737 | 02/2007 | 0.135 | 17.6 | 1.3 | 3.17 | 2.39 | C, D†, G, N | II |
| B2 1215+30 | 03/2007 – 03/2008 | 0.237 | 15.6 | 1.3 | 1.59 | 2.65 | C, D, N†hhThe objects chosen from Nieppola et al. (2006) are also listed in Donato et al. (2001), but with a X-ray flux lower than 2 . | III |
| 2E 1415.6+2557 | 04/2005 – 04/2008 | 0.237 | 19.2 | 3.2 | 3.26 | 2.25 | C, D†, G, N | I |
| PKS 1424+240ggKnown VHE blazar (as of April 2010) due to a detection after the MAGIC observation period. | 05/2006 – 02/2007 | 0.160ffTentative redshift. | 15.7 | 1.0 | 1.37 | 2.98 | D, N†hhThe objects chosen from Nieppola et al. (2006) are also listed in Donato et al. (2001), but with a X-ray flux lower than 2 . | III |
| RX J1725.0+1152 | 04/2005 – 04/2009 | 0.018ffTentative redshift. | 15.8 | 2.0 | 3.60 | 2.65 | C, D†, N | I,II |
| 1ES 1727+502 | 05/2006 – 05/2007 | 0.055 | 17.4 | 1.3 | 3.36 | 2.61 | C, D†, N | I,II |
| 1ES 1741+196 | 07/2006 – 04/2007 | 0.083 | 17.9 | 1.0 | 1.92iiMean X-ray flux of multiple measurement in Donato et al. (2001) below 2 . | 2.04 | C, D†, N | I,II |
| B3 2247+381 | 08 – 09/2006 | 0.119 | 15.6 | 1.0 | 0.60 | 2.51 | D, N†hhThe objects chosen from Nieppola et al. (2006) are also listed in Donato et al. (2001), but with a X-ray flux lower than 2 . | III |
Note. — List of objects in the sample of X-ray selected blazars with their observation time windows, redshifts and X-ray measurements.
3 OBSERVATIONS AND DATA ANALYSIS TECHNIQUE
The observations presented here were carried out between December 2004 and April 2009 with a total amount of observation time of 490.0 hours. After quality selection (removing low quality data runs from the analysis) 394.1 hours were used for the analysis or 18.8 hours per source on average. The main reason to discard data from the analysis is a low event rate after image cleaning which is primarily influenced by the weather conditions.
Most of the data were taken in wobble mode. In this mode the pointing position of the telescope is displaced by from the source position. In order to get a well-balanced coverage inside the camera, the wobble position is changed regularly to the opposite (with respect to the source position). Signal and background events are then determined from the same shower images with respect to the source position and to three symmetric OFF positions, respectively, all at the same distance to the camera center. Part of the data of RX J0319.8+1845, 2E 1415.6+2557 and RX J1725.0+1152 were taken in ON mode where the pointing position of the telescope is centered on the object in the sky. For these observations dedicated OFF observations have been used for the background estimation.
The data were processed with the software package MARS (Bretz, 2005) using an automated analysis pipeline. Details can be found in Bretz & Wagner (2003), Bretz & Dorner (2008), and Albert et al. (2008b). Furthermore, the arrival time information of neighboring pixels was taken into account (Aliu et al., 2009).
For the separation of signal and background events, dynamic cuts on the distribution of image parameters are applied. The image parameters are moments up to third order in the light distribution of the shower images (Hillas, 1985). The background suppression is done by means of a parabolic cut in AREA (Riegel et al., 2005) and a cut in . The latter parameter is the squared angular distance between the source position and the reconstructed shower origin determined with a refined DISP method (Lessard et al., 2001) taking into account the timing information of the showers. The -cut used in this analysis is which is a somewhat smaller value than usually used for the Crab Nebula, but provides a better background rejection for weak point sources. The chosen value for corresponds to a signal region in the camera plane with a diameter of 2.8 camera pixels. The optical point spread function of the MAGIC telescope during the campaign was smaller than 16.0 mm corresponding to a diameter of 1.1 pixels, well within this area. A large sample of objects spanning a long time of observations has to be treated with a robust analysis. The usage of dynamic cuts provides such an analysis on the expense of sensitivity (cf. Section 4.1).
The statistical significance for any excess is calculated from the distribution of signal and background events making use of Eq. 17 in Li & Ma (1983).
Concerning the stacking method as described in Sections 4.4 and 4.5, the distributions have been summed up to retrieve the stacked signal plot. The differential energy spectrum is then calculated from all excess events using average values for the effective collection area and a Monte Carlo correction factor (spill-over correction), weighted each with the exposure time . The same method has been applied to a data set of the Crab Nebula (cf. Section 4.1) demonstrating its feasibility.
4 RESULTS OF THE MAGIC OBSERVATIONS
During the observation campaign no significant detection of any individual object could be achieved. The results can be found in Table 3. None of the objects showed flaring activity in the VHE band on a significant level on diurnal timescales within the observation time windows. Flaring activity is defined here as an offset of 3 standard deviations from the mean measured -rate for each object. However, flux variations by a factor three would still prevent an individual object of the sample of being detected with high significance. In this Section we present the upper limits obtained for all 21 objects.
Three of the objects were partially observed during an optical high state within a target of opportunity campaign. The trigger criterion was an increase in the optical flux of the core of more than 50 %. The objects are 1ES 0033+595, RGB J1117+202, and B2 1215+30. Significant activity or variability in the VHE -ray regime could not be detected.
4.1 Crab Nebula Observations
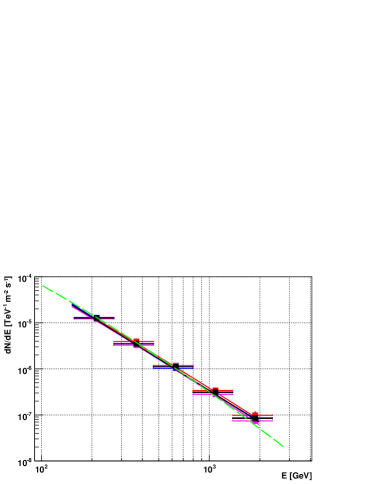
For a comparative analysis a sample of the Crab Nebula data has been used spanning a time range from Oct 2005 to Jan 2008. Three data sets have been chosen to account for the three different hardware conditions during the blazar observations: 300 MHz readout system without and with optical splitters and 2 GHz readout system, later on referred to as 300 MHz, 300 MHzOS and 2 GHz systems, respectively. The distribution of the subsamples have been matched to the one of the blazar sample; the overall observation time after quality selection is . The individual values as well as the combined result can be found in table 2. The energy spectrum can be fitted with a log parabola (according to Eq. 2 in Albert et al., 2008c) accounting for the flattening of the spectrum towards the inverse Compton peak:
| (2) |
with ,
and .
The distribution and the energy spectrum have been calculated in the very same way as for the blazar sample by stacking the three individual Crab Nebula samples.
The integral flux above 150 GeV is determined to
. It will be used for comparison with the integral upper limits derived from the blazars. Figure 1 displays the energy spectrum of the stacked excess of the Crab Nebula in comparison to the published spectrum.
The integral flux above 150 GeV amounts to 91 % of that determined in Albert et al. (2008c). A comparison to previous measurements of experiments like HEGRA, H.E.S.S or Whipple is difficult because of the higher energy threshold of these measurements (above 400 GeV). Due to the hardening of the Crab spectrum towards the peak below 100 GeV a simple extrapolation of the power-law spectra found there, overestimates the flux at 150 GeV leading to integral flux ratios of % above 150 GeV (cf. Aharonian et al., 2000, 2006; Grube, 2007).
| Season | FADC | texp | Excess | Backgr. | Sign. | ||
|---|---|---|---|---|---|---|---|
| system | [h] | [°] | events | events | [GeV] | ||
| 10/2005 - 03/2006 | 300 MHz | 3.8 | 6 – 37 | 967 | 209 | 36.0 | 165 |
| 09/2006 - 01/2007 | 300 MHzOS | 8.1 | 7 – 43 | 2086 | 523 | 51.0 | 165 |
| 02/2007 - 01/2008 | 2 GHz | 7.3 | 8 – 30 | 2133 | 455 | 53.5 | 165 |
| Combined | – | 19.1 | 6 – 43 | 5188 | 1188 | 82.2 | 165 |
Note. — Observations of the Crab Nebula used for a performance test of the stacking method and comparison to the flux upper limits of the blazars. The final spectrum (cf. Eq. 2) is obtained as combination of all the subsamples.
The standard MAGIC integral sensitivity is 1.6 % of the Crab Nebula flux above 280 GeV for detecting a signal with 5 in 50 hours (Aliu et al., 2009). Including lower energies in the integral sensitivity determination, the value increases. The analysis presented in this work has an integral sensitivity above 150 GeV of 3.8 % of the Crab Nebula flux. This is mainly due to the long-term characteristics of the observations, because the analysis is aimed at a robust and conservative treatment of the data; in addition, also data before the installation of the 2 GHz system are considered, where the standard MAGIC sensitivity above 280 GeV is also less with 1.9 % of the Crab Nebula flux.
4.2 Upper Limits
The upper limits (U.L.) on the excess rates are calculated on a confidence level of 3 (99.7 %) using the method from Rolke et al. (2005). Integral flux upper limits above a given energy are then calculated from them. The integral flux for each source is given above the energy threshold of the analysis, which is defined as the maximum of the differential distribution vs of simulated -showers surviving all cuts. The integral fluxes are also compared to the integral flux of the Crab Nebula above the individual thresholds.
The energy estimation for each source was done based on Monte Carlo simulated events following a power-law distribution with for a power law . This was done in order to fit better the average spectral slope for the blazars in the VHE regime. For the integral upper limit calculation the same input spectrum () was used. The resulting upper limits vary between 1.6 % and 13.6 % of the Crab Nebula flux above the individual energy threshold. The energy thresholds lie between 120 GeV and 230 GeV, due to differences in the distributions of the individual data samples. The Monte Carlo simulations have been chosen to match exactly the distribution of each data sample. The results of the spectral analysis can be found in Table 3, too.
| Object | Excess | Backgr. | Scale | Sign. | aaPeak response energy for a power law spectrum with | U.L. | U.L. | |||
|---|---|---|---|---|---|---|---|---|---|---|
| [h] | [°] | events | events | [GeV] | c.u.bbIntegral flux above given in units of the flux of the Crab Nebula (crab units, c.u.) | f.u.ccIntegral flux above given in flux units f.u. = | ||||
| 1ES 0033+595 | 5.2 | 31 – | 41 | 60.0 | 331.0 | 0.33 | 2.8 | 170 | 9.7 | 2.4 |
| 1ES 0120+340 | 10.7 | 6 – | 18 | 20.7 | 437.3 | 0.33 | 0.9 | 120 | 8.2 | 3.1 |
| 1ES 0229+200 | 8.0 | 8 – | 37 | 55.0 | 572.0 | 0.33 | 2.0 | 120 | 13.6 | 5.1 |
| RX J0319.8+1845 | 11.2 | 10 – | 31 | –23.4 | 631.4 | 0.59 | –0.7 | 120 | 1.6 | 0.6 |
| 1ES 0323+022 | 11.4 | 26 – | 46 | –45.3 | 751.3 | 0.33 | –1.5 | 170 | 6.9 | 1.7 |
| 1ES 0414+009 | 18.2 | 28 – | 36 | 71.3 | 1020.7 | 0.33 | 1.9 | 170 | 7.7 | 1.9 |
| 1RXS J044127.8+150455 | 26.9 | 13 – | 36 | 18.3 | 1825.7 | 0.33 | 0.4 | 120 | 3.2 | 1.2 |
| 1ES 0647+250 | 29.2 | 3 – | 32 | 64.3 | 1797.7 | 0.33 | 1.3 | 120 | 4.3 | 1.6 |
| 1ES 0806+524 | 17.5 | 24 – | 36 | 17.0 | 752.0 | 0.33 | 0.5 | 140 | 7.2 | 2.2 |
| 1ES 0927+500 | 16.7 | 21 – | 26 | 28.3 | 702.7 | 0.33 | 0.9 | 140 | 5.6 | 1.7 |
| 1ES 1011+496 | 14.5 | 21 – | 29 | 89.0 | 590.0 | 0.33 | 3.1 | 140 | 6.9 | 2.1 |
| 1ES 1028+511 | 37.1 | 22 – | 36 | 65.7 | 2312.3 | 0.33 | 1.2 | 140 | 3.3 | 1.0 |
| RGB J1117+202 | 14.9 | 8 – | 38 | 25.7 | 804.3 | 0.33 | 0.8 | 120 | 5.3 | 2.0 |
| RX J1136.5+6737 | 14.8 | 39 – | 46 | 22.7 | 954.3 | 0.33 | 0.6 | 230 | 5.7 | 0.9 |
| B2 1215+30 | 16.1 | 1 – | 41 | 119.0 | 995.0 | 0.33 | 3.2 | 120 | 9.3 | 3.5 |
| 2E 1415.6+2557 | 57.4 | 3 – | 36 | 7.6 | 3805.4 | 0.54 | 0.1 | 120 | 3.5 | 1.3 |
| PKS 1424+240 | 20.0 | 5 – | 36 | 51.7 | 1210.3 | 0.33 | 1.3 | 120 | 8.2 | 3.1 |
| RX J1725.0+1152 | 32.0 | 17 – | 35 | 70.0 | 1859.0 | 0.38 | 1.4 | 140 | 4.2 | 1.3 |
| 1ES 1727+502 | 6.1 | 21 – | 36 | 31.0 | 302.0 | 0.33 | 1.5 | 140 | 11.8 | 3.6 |
| 1ES 1741+196 | 11.8 | 9 – | 40 | 98.7 | 731.3 | 0.33 | 3.1 | 120 | 9.6 | 3.6 |
| B3 2247+381 | 8.3 | 10 – | 36 | 21.7 | 490.3 | 0.33 | 0.8 | 140 | 5.2 | 1.6 |
Note. — Results of the analysis. The upper limits span a range of 1.6 - 13.6 % of the Crab Nebula flux above the corresponding energy threshold.
Discovery of VHE -rays from RX J0319.8+1845 and 1ES 0806+524 has recently been reported by the VERITAS collaboration (Acciari et al., 2009; Ong & Fortin, 2009), as well as from PKS 1424+240 which was confirmed by the MAGIC collaboration in a campaign independent of the observations presented here (Acciari et al., 2010; Teshima, 2009). The measured VHE flux for the latter source was significantly higher than in previous observations with the MAGIC telescope. 1ES 0229+200 and 1ES 0414+009 have been detected by the H.E.S.S. telescope array in 2006 (Aharonian et al., 2007b) and 2009 (Hofmann & Fegan, 2009), respectively. However, since the observations presented here were each performed in advance of the detections mentioned above, the inclusion of these sources in the stacking method is justified. The later detections show that the X-ray selection of possible targets is a reasonable approach.
In order to compare the measured integral fluxes with the upper limits presented here they are extrapolated to the individual energy thresholds as reported in Table 3. In all cases except for PKS 1424+240 the upper limits are compatible with the extrapolated reported integral fluxes.
4.3 Significance Distribution
Taking a look at the calculated significances of the blazar sample it is evident that most of the individual objects show positive values. Plotting the distribution of the significances, the mean value is not located at 0 as expected for sky regions where no -rays are expected to originate.
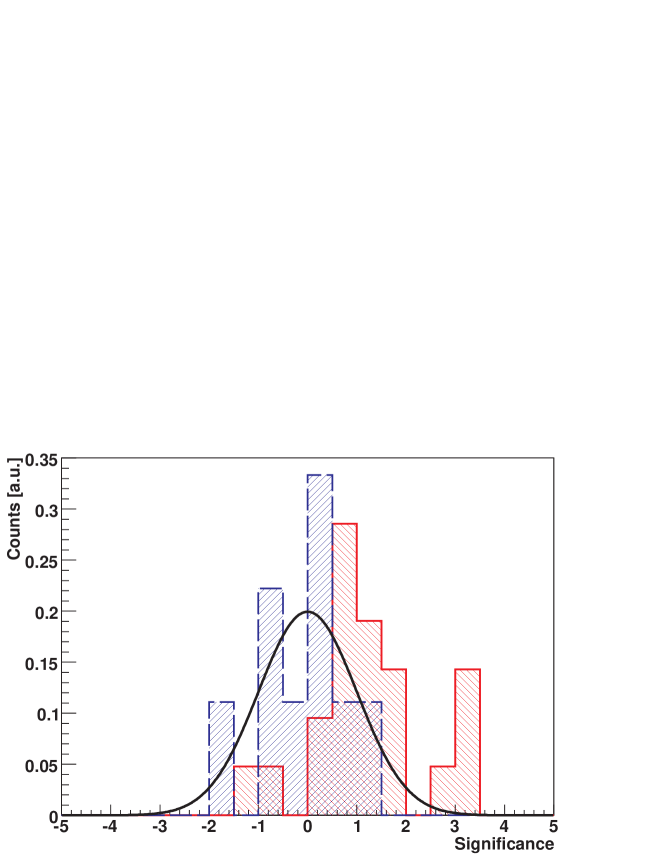
In Figure 2 the significance distribution for the blazar sample is shown together with the result of a cross-check as described below. As the number of individual samples is different for both distributions they have been normalized to one. The blazar sample distribution has a mean value of 1.231.17 while the cross-check sample has 0.080.85. This result can be expected due to the fact that our sample is biased by the selection toward potential VHE -ray emitters.
In order to test if the positive signal in the blazar sample originates from a systematic effect of the observations or analysis chain, we also cross-checked this result with data sets obtained as OFF pointings associated to different ON source observations not treated in this paper. These data sets were taken under similar conditions as the blazars covering the whole range of of the blazar sample and processed with the very same analysis chain. The OFF observations were analyzed in wobble mode with respect to two fake source positions in the camera displaced by 0.4°from the camera center. Table 4 gives a list of these observations and results. Although the fit parameters of Gaussian fits to both distributions do not permit any conclusive statement, a Kolmogorov-Smirnov test of the compatibility of the blazar with the cross-check sample gives a probability of 1.56 %. For the Gaussian distributions the test returns 3.42 % and 77.03 % for the compatibility of the blazar and the cross-check sample with the standard Gaussian, respectively. The cross-check sample is 7 times smaller than the blazar sample, thus systematic effects in the analysis can only largely be ruled out as possible explanation for the shift in the blazar distribution.
| Sample | Season | Excess | Backgr. | Sign. | |||
|---|---|---|---|---|---|---|---|
| [h] | [°] | events | events | ||||
| 1 | 06 – 07/2006 | 5.4 | 34 – | 43 | –1.3 | 335.3 | –0.1 |
| 2 | 07/2006 | 3.1 | 6 – | 29 | 4.3 | 107.7 | 0.4 |
| 3 | 11/2006 | 1.9 | 37 – | 47 | 19.0 | 255.0 | 1.0 |
| 4 | 01/2007 | 3.3 | 49 – | 56 | –24.7 | 149.7 | –1.8 |
| 5 | 04/2007 | 2.8 | 11 – | 27 | –9.7 | 139.7 | –0.7 |
| 6 | 05/2007 | 1.3 | 28 – | 37 | 2.0 | 76.0 | 0.2 |
| 7 | 05/2007 | 7.3 | 29 – | 36 | –20.7 | 356.7 | –1.0 |
| 8 | 01 – 08/2008 | 17.9 | 22 – | 38 | 7.0 | 1041.0 | 0.2 |
| 9 | 02 – 04/2008 | 9.3 | 22 – | 26 | 18.0 | 548.0 | 0.7 |
Note. — Data samples used for the cross-check analysis. They were chosen to give a good coverage of the distributions and the different night sky background conditions of the blazar sample.
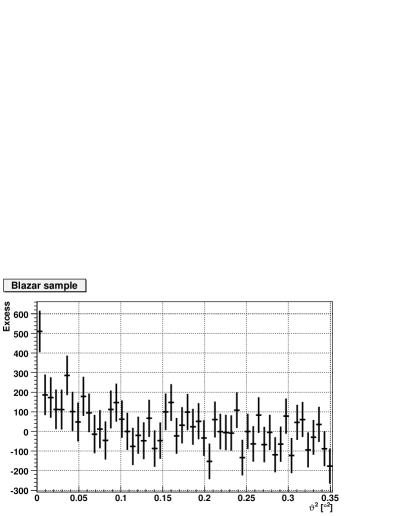
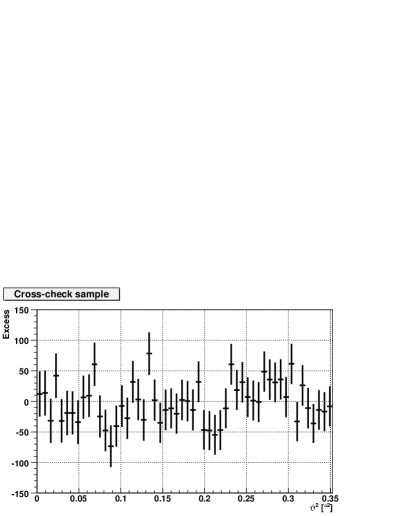
4.4 Stacking Analysis
Even if none of the sources was detected in a single observation, a cumulative signal search seems promising. For this reason the -plots of the individual analyses have been stacked producing one plot for the whole set containing 394.1 hours of data (cf. Section 3). Figure 3 shows the result, a significance of 4.9 standard deviations with 870 excess and 22876 background events. About 30 % of the stacked excess comes from blazars now known as VHE -ray emitters. Without these sources the stacked excess amounts to 608 excess events with a significance of 3.8 indicating that there are other emitters contained in the sample. Figure 4 underlines this finding. As expected, the stacked -plot of the cross-check analysis containing no -signal gives a significance of 0.1 with 6 excess and 3009 background events, the result is shown in Figure 3 as well.
 |
 |
4.5 Energy Spectrum
From the combined excess a differential energy spectrum can be calculated. The differential energy spectrum for one source is calculated binwise by dividing the product of the number of excess events Nexc,i and the spill over factor ai by the product of effective collection area Aeff,i and exposure time texp. In order to derive an energy spectrum of the stacked excess, the mean values of ai and Aeff,i weighted with the observation time have to be taken:
| (3) | |||||
| (4) |
with n being the number of objects to be stacked and the energy bin i. The differential quotient for each bin can then be calculated as
| (5) |
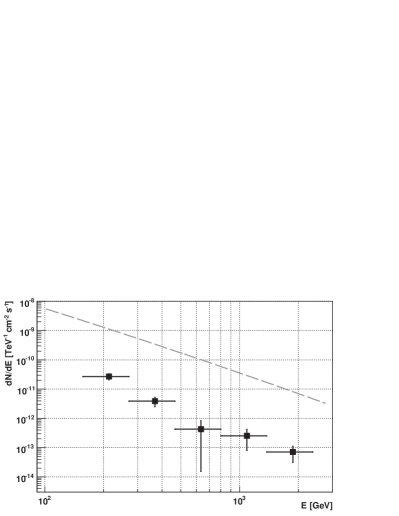
with the energy bin width Ei. The mean energy spectrum in the observer’s frame for all 21 blazars considered in the stacking analysis can be well described by a power law,
| (6) |
with . The differential flux at 200 GeV corresponds to 1.9 % of the one of the Crab Nebula. The integral flux above 150 GeV is determined as corresponding to 1.5 % of the integral Crab Nebula flux above 150 GeV.
On average, each blazar contributes with (2.10.3)/h excess events to the cumulative excess as is illustrated in Figure 4. The objects are ordered in right ascension.
In Figure 5 the measured spectrum is shown.
5 DISCUSSION
The positive mean significance distribution indicates that the X-ray selected blazars studied here constitute a fairly representative sample of generic VHE emitters, as suggested by Costamante & Ghisellini (2002). The recent discoveries of individual blazars from the sample indeed corroborate this finding. The next generation of Cherenkov experiments – MAGIC-II, H.E.S.S. 2, and later on the Cherenkov Telescope Array (CTA, Wagner et al., 2009) – will therefore have good chances to detect an increasing fraction of all known X-ray blazars.
5.1 Gamma-ray Background
At 200 GeV, the attenuation caused by the EBL is negligible, according to the model of Kneiske & Dole (2010), so the calculation of the broad-band spectral index between 1 keV and 200 GeV can be done with the observed VHE energy spectrum. The mean energy flux at 200 GeV is calculated from the fit to . This value is compared to the mean X-ray energy flux at 1 keV for all sources, weighted with their individual observation time, which is 3.74 corresponding to a flux of . The ratio of X-ray (1 keV) to -ray (200 GeV) flux is
| (7) |
resulting in a broad-band spectral index .
The result suggests that during quiescence the X-ray luminosity is higher than the VHE -ray luminosity above 200 GeV. Here, we tacitly assume that the X-ray data, which are not contemporaneous with the -ray data, are representative of baseline emission as well. Note, that the X-ray as well as the VHE data are an average over the whole blazar sample considered here and that flux variations commonly observed with the X-ray band do not influence across eight orders of magnitude. A simple estimation of by inferring the error of the average value at 1 keV of the sample and the error of the energy spectrum at 200 GeV results in . With the newly found X-ray to -ray spectral index of one can infer the luminosity function of VHE blazars from their X-ray luminosity function, avoiding the bias toward flares. Assuming equal X-ray and VHE -ray luminosities, HBLs already fail to explain the extragalactic diffuse -ray background (Kneiske & Mannheim, 2008).
5.2 Spectral energy distribution
As no flaring activity has been seen on diurnal scales nor on longer time scales, the cumulative signal of the high-peaked blazars in this sample can be accounted as an upper limit on their baseline emission in VHE -rays, although variability on flux scales below the sensitivity limit of MAGIC may not be excluded.
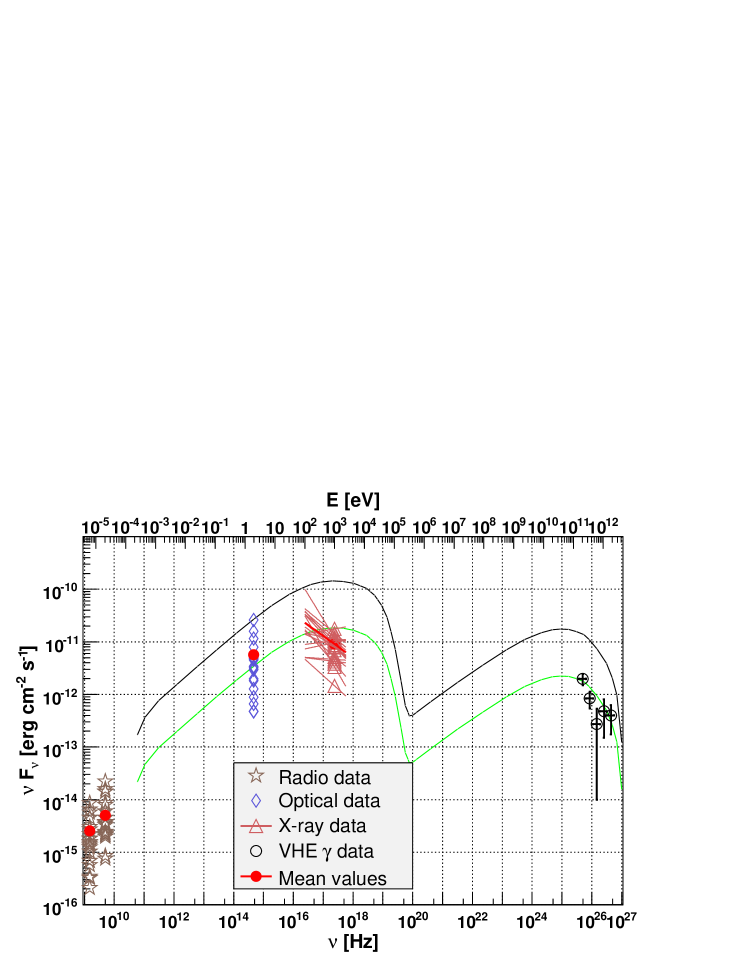
The SED for the blazar sample is determined by taking archival data in the radio and X-ray bands (1.4 GHz, 5 GHz, and 1 keV) if available as well as contemporaneous optical data in the R-Band (640 nm) taken with the KVA telescope. The collected data are shown in Figure 6. In the VHE regime also the deabsorbed spectrum as already shown in Figure 5 is displayed. From the mean values in optical and X-rays and the mean X-ray spectral index one can infer an average synchrotron peak energy of the sample below 1 keV.
For a simple comparison the measured spectral energy distribution of the HBL 1ES 1959+650 is drawn. 1ES 1959+650 is a well known VHE blazar which was observed in a historic low emission state in a multiwavelength campaign in 2006 (Tagliaferri et al., 2008). The differential energy spectrum measured by MAGIC in the VHE regime follows a power law with a photon index . The SED of 1ES 1959+650 can be well fitted with a one-zone synchrotron self-Compton model, which is also plotted in Figure 6. To guide the eye, the SED is also scaled down to the lowest energy bin of the VHE spectrum of the blazar sample.
6 CONCLUSIONS
In the course of the MAGIC observational program during 2004 - 2009, a major part was spent on X-ray bright BL Lacertae objects. For 21 non-detections upper limits on the integral flux ranging between 1.6 % and 13.6 % of the Crab Nebula flux could be determined. Applying a stacking method to the individual non-detections we found an average VHE emission of the sample of X-ray selected blazars at the 4.9 significance level above 100 GeV. It turns out out that the mean VHE -ray flux is significantly lower than in archival X-ray measurements. The two-point spectral index between 1 keV and 200 GeV is 1.090.04.
References
- Acciari et al. (2009) Acciari, V., Aliu, E., Arlen, T., et al. 2009, ApJ, 690, L126
- Acciari et al. (2010) Acciari, V., Aliu, E., Arlen, T., et al. 2010, ApJ, 708, L100
- Aharonian et al. (2000) Aharonian, F., Akhperjanian, A. G., Barrio, J. A. et al. 2000, ApJ, 539, 317
- Aharonian et al. (2006) Aharonian, F., Akhperjanian, A. G., Bazer-Bachi, A. R. et al. 2006, A&A, 457, 899
- Aharonian et al. (2007a) Aharonian, F., Akhperjanian, A. G., Bazer-Bachi, A. R. et al. 2007a, ApJ, 664, L71
- Aharonian et al. (2007b) Aharonian, F., Akhperjanian, A. G., Barres de Almeida, U. et al. 2007b, A&A, 475, L9
- Albert et al. (2007) Albert, J., Aliu, E., Anderhub, H., et al. 2007, ApJ, 669, 862
- Albert et al. (2008a) Albert, J., Aliu, E., Anderhub, H., et al. 2008a, ApJ, 681, 944
- Albert et al. (2008b) Albert, J., Aliu, E., Anderhub, H., et al. 2008b, Nucl. Instrum. Meth., A594, 407
- Albert et al. (2008c) Albert, J., Aliu, E., Anderhub, H., et al. 2008c, ApJ, 674, 1037
- Albert et al. (2008d) Albert, J., Aliu, E., Anderhub, H., et al. 2008d, Science, 320, 1752
- Aliu et al. (2009) Aliu, E., Anderhub, H., Antonelli, L. A., et al. 2009, Astropart. Phys., 30, 293
- Benbow (2009) Benbow, W. 2009, arXiv:0908.1412
- Bretz (2005) Bretz, T. 2005, in AIP Conf. Proc. 745, 730
- Bretz & Dorner (2008) Bretz, T. & Dorner, D. 2008, AIP Conference Proceedings, 1085, 664
- Bretz & Wagner (2003) Bretz, T. & Wagner, R. 2003, in Proc. of the 28th ICRC, Tsukuba, Japan, 5, 2947
- Costamante & Ghisellini (2002) Costamante, L. & Ghisellini, G. 2002, A&A, 384, 56
- Dermer & Schlickeiser (1993) Dermer, C. D. & Schlickeiser, R. 1993, ApJ, 416, 458
- Donato et al. (2001) Donato, D., Ghisellini, G., Tagliaferri, G. & Fossati, G. 2001, A&A, 375, 739
- Giommi et al. (2005) Giommi, P., Piranomonte, S., Perri, M., Padovani, P. 2005, A&A, 434, 385
- Grube (2007) Grube, J. 2007, in Proc. of the 30th ICRC, Merida, Mexico, 2, 691
- Hillas (1985) Hillas, A. M. 1985, Proc. of the 19th ICRC, La Jolla, USA, 3, 445
- Hofmann & Fegan (2009) Hofmann, W. & Fegan, S. 2009, ATel 2293, 1
- Kneiske & Dole (2010) Kneiske, T. M. & Dole, H. 2010, arXiv:1001.2132
- Kneiske & Mannheim (2008) Kneiske, T. M. & Mannheim, K. 2008, A&A, 479, 41
- Lessard et al. (2001) Lessard, R. W., Buckley J. H., Connaughton, V. & Le Bohec, S. 2001, Astropart. Physics, 15, 1
- Li & Ma (1983) Li, T. & Ma, Y. 1983, ApJ, 272, 317
- Mannheim (1993) Mannheim, K. 1993, A&A, 269, 67
- Mannheim et al. (1996) Mannheim, K., Westerhoff, S., Meyer, H., Fink, H.-H. 1996, A&A, 315, 77
- Maraschi et al. (1992) Maraschi, L., Ghisellini, G., & Celotti, A. 1992, ApJ, 397, L5
- Muecke & Protheroe (2001) Muecke, A. & Protheroe, R. J. 2001, Astropart. Phys., 15, 121
- Nieppola et al. (2006) Nieppola, E., Tornikoski, M., Valtaoja, E. 2006, A&A, 445, 441
- Ong & Fortin (2009) Ong, R. A. & Fortin, P. 2009, ATel 2272, 1
- Riegel et al. (2005) Riegel, B., Bretz, T. et al. 2005, Proc. of the 29th ICRC, Pune, India, 5, 215
- Rolke et al. (2005) Rolke, W., Lopez, A., Conrad, J. & James, F. 2005, Nucl. Instrum. Meth., A551, 493
- Sikora et al. (1994) Sikora, M., Begelmann, M. C. & Rees, M. J. 1994, ApJ, 421, 153
- Stecker et al. (1996) Stecker, F. W., de Jager, O. C. & Salamon, M. H. 1996, ApJ, 473, L75
- Tagliaferri et al. (2008) Tagliaferri, G., Foschini, L., Ghisellini, G. et al. 2008, ApJ, 679, 1029
- Teshima (2009) Teshima, M. 2009, ATel 2098, 1
- Wagner et al. (2009) Wagner, R. M., Lindfors, E., Sillanpää, E. J., et al. 2009, arXiv:0912.3742