Stellar collisions in accreting protoclusters: a Monte Carlo dynamical study
Abstract
We explore the behaviour of accreting protoclusters with a Monte Carlo dynamical code in order to evaluate the relative roles of accretion, two body relaxation and stellar collisions in the cluster evolution. We corroborate the suggestion of Clarke & Bonnell that the number of stellar collisions should scale as (independent of other cluster parameters, where is the number of stars in the cluster and the rate of mass accretion) and thus strengthen the argument that stellar collisions are more likely in populous (large N) clusters. We however find that the estimates of Clarke & Bonnell were pessimistic in the sense that we find that more than of the stellar collisions occur within the post-adiabatic regime as the cluster evolves towards core collapse, driven by a combination of accretion and two-body relaxation. We discuss how the inclusion of binaries may reduce the number of collisions through the reversal of core collapse but also note that it opens up another collisional channel involving the merger of stars within hard binaries; future Nbody simulations are however required in order to explore this issue.
keywords:
celestial mechanics, stars: formation, galaxies: star clusters1 Introduction
Bonnell, Bate & Vine (1998) first pointed out that star clusters should shrink, in response to adiabatic accretion of gas onto their stars, and conducted Nbody experiments to illustrate this process. They also hypothesised that, in the process, cluster cores should be driven to such high densities that the stars there could physically collide, and proposed this as a formation mechanism for massive stars. An attractive feature of this scenario is that it avoids a well known problem with conventional (accretion) models for star formation which predict that the effect of radiation pressure on dust in the accretion flow can be problematical once stars exceed around . It is likely, however, that the original arguments against the formation of massive stars by accretion are most severe in spherical geometry (Wolfire & Casinelli 1987) and pilot simulations demonstrate that high stellar masses () are attainable through accretion in more realistic (disc) geometry (Yorke & Sonnhalter 2002). The recent identification of flattened structures around high mass protostars (Cesaroni et al 2006) lends further credence to the idea that accretion is a viable formation mechanism for many massive stars. The question that remains unanswered - and which this paper attempts to explore - is whether there are ever astrophysical environments in which one would expect the collisional formation of massive stars to be important?
Following the original suggestion of Bonnell et al 1998, Bonnell & Bate (2002) pursued hydrodynamical simulations of the shrinkage of cluster cores due to mass loading (in this case modeling accretion, from gas initially within the cluster, onto a dynamically cold population of cluster stars). They found however, that they were unable to pursue the calculation into the regime of physical collisions unless the nominal radius of each star was increased by an order of magnitude. More recently, Clarke & Bonnell (2008) presented physical arguments as to what limits the maximum density attainable in clusters subject to adiabatic accretion and used these arguments to try and define the parameters of accreting clusters in which stellar collisions might be expected.
In this paper we conduct a further study of accretion onto stellar clusters, using a Monte Carlo dynamical code. A Monte Carlo code is well suited to this problem since it follows the secular evolution of clusters that are subject to processes occurring over many dynamical times, rather than following the trajectories of individual stars in their orbits. In the present case, the two (secular) processes that are modeled are a) the addition of gas onto the stars and b) the diffusion of stellar orbits as a result of two-body relaxation. The latter process is modeled by random selection and perturbation of neighbouring particles as described in Freitag & Benz (2001,2002) and in Section 2 below. The mean (smooth) potential of the cluster is however spherically symmetric so that gravitational forces are easily computed from the enclosed mass. This means that the code avoids the (potentially ) expense of calculating pairwise forces over N particles and hence can readily be used for integrating systems of much higher N than is possible via direct Nbody integration. This is particularly useful in the present problem where our initial estimates (Clarke & Bonnell 2008) suggested that stellar collisions are only likely to occur in relatively high N systems.
It should however be stressed at the outset that this study is highly idealised in a number of respects: i) it treats a spherical cluster of equal mass stars which all accrete zero momentum gas at a constant rate, ii) it omits binaries and three body dynamical interactions and iii) it assumes the gaseous mass reservoir originates outside the cluster and that of the gas accreted ends up on the stars, rather than as a distributed gaseous component within the cluster (see Bonnell et al 1998 for a discussion of the case where the infalling gas also forms a distributed component). Each of the above simplifications can be relaxed in future studies, building on previous research into non-accreting clusters; the goal of the present work is to set out an analytic framework for understanding this simplest case (verified through numerical simulations) and to use this to further explore how the incidence of stellar collisions depends on cluster parameters. We note that since the simulations described here can be uniquely specified by two dimensionless numbers (the initial ratios of the two-body relaxation and collision time-scales to the mass accretion time-scale), it is a simple matter to apply the results to other physical situations (e.g. a cluster of black holes intercepting a spherical accretion flow).
The structure of the paper is as follows. In Section 2 we describe the evolution of accreting proto-clusters, clarifying the expected properties in the adiabatic regime and explaining the circumstances under which clusters embark on adiabatic shrinkage and how this is modified by two-body relaxation. In Section 3 we briefly describe the Monte Carlo code and the simulations undertaken. Section 4 discusses the results and Section 5 contains some estimates of how these results would be likely to be modified if the dynamical role of binary heating had been included. Section 6 presents conclusions and indicates further necessary research directions.
2 Outline of the problem
The rate of collisions per unit volume in a stellar system is given by
| (1) |
where and are the stellar mass and radius, is the velocity dispersion and the number density (Binney & Tremaine 1988).
Collisional formation of massive stars during the pre-main sequence stage implies a value for of per Myr. For physically realistic , (i.e. on the order of solar values) and a velocity dispersion on the order of 10km/s, this requires that clusters attain (albeit briefly) extremely high densities of around stars pc-3. This value exceeds those encountered in even the densest regions of observed Galactic clusters (such as the Arches Cluster: see Table 4 in Stolte et al 2006) by more than two orders of magnitude and argues that such dense conditions, if ever encountered, must represent a short-lived evolutionary stage. Other effects that would render such dense stellar concentrations hard to observe include heavy extinction (if the cluster were still deeply embedded in its natal gas) or the fact that an ultra-dense core may be too small to resolve in distant clusters (Trager et al 1995).
A mechanism for producing such ultra-dense conditions (Bonnell et al 1998) involves the shrinkage of a cluster in response to the accretion of material onto its constituent stars. If one can neglect evolution due to two-body dynamical effects (see below) then the only agent of evolutionary change is the cluster’s response to mass gain. In the limit that the time-scale for mass doubling (henceforth ) is long compared with the cluster dynamical time () this mass gain is adiabatic and in this case adiabatic invariance requires that the cluster radius shrinks according to in response to mass gain. 111 This result can be readily derived in several ways: either by considering the (conserved) angular momentum of individual particle orbits or else by considering the re-virialisation of a cluster whose kinetic energy is reduced, and magnitude of potential energy increased, through the incremental addition of zero momentum gas. Note in the latter derivation that mass must be added incrementally (i.e. a small mass gain per dynamical time) in order to attain the strong shrinkage predicted - in the limit that mass is added instantaneously, by contrast, revirialisation only results in shrinkage by up to a factor two, however much mass is added.
Adiabatic shrinkage under mass accretion thus results in a dramatic increase in cluster density: the number density scales as while the mass density as . It thus needs to be borne in mind that extreme conditions can result from relatively small (order unity) changes in the cluster mass. The over-all time-scale for shrinkage (and possible production of a core where collisions are important) is just as defined above. It will also be useful to note that the cluster velocity dispersion rises more mildly with mass (i.e. as ) and we therefore find that stellar encounters generally remain in the gravitationally focused regime even when the cluster is dense enough for collisions to occur.
The adiabatic requirement () can be recast as an upper limit on the rate of accretion onto a cluster, i.e. where is the cluster velocity dispersion. Although we use the term ‘cluster’ to describe our stellar system throughout this paper, we note that the shrinking adiabatic system can in fact be the core of a larger cluster, in which gas accretes radially on to the core from a reservoir in the outer cluster. In the case that free falling gas dominates the mass of the outer cluster, the adiabatic condition requires that the velocity dispersion in the core be larger than the free-fall velocity of the inflowing gas. Once this (not implausible) condition is attained, the core can decouple as an adiabatically shrinking sub-system.
In Section 4.2 and below we discuss the range of initial cluster parameters and accretion rates that fall in the adiabatic regime. The steep rise in density with added mass, and the consequent reduction in the dynamical time-scale, means that any cluster which satisfies the adiabatic condition at the onset of shrinkage will satisfy this condition ever more amply as the collapse proceeds. However, the reduction of the dynamical time is associated with a proportional reduction in the two-body relaxation time-scale (which, to within a logarithmic factor, scales as crossing times) and so, at some point in the collapse, two-body relaxation is likely to occur on a time-scale that is comparable with the shrinkage time-scale . From this point on it is not possible to regard the cluster evolution as being collisionless; Clarke & Bonnell made the (pessimistic) assumption that this evolutionary point marks the end of the era of opportunity for stellar collisions, since they argued that thereafter the core would be inflated by two-body scattering. The viability of collisions in this case depends on the number of collisions that are possible before this point; evidently this favours high N clusters since the relative smoothness of the potential implies that such clusters can collapse by a large factor before two-body effects become important.
In what follows, we explore this issue with a Monte Carlo dynamical code with the aim a) of refining our initial estimates of how far the cluster can collapse in the adiabatic regime and b) pursuing the evolution into the subsequent regime that is driven by two-body relaxation.
3 The simulations
3.1 The Monte Carlo dynamical code
All simulations described here are performed using ME(SSY)**2, a Monte Carlo dynamical code that is fully described in Freitag & Benz (2001, 2002) and Freitag (2008). 222The code is available online at http://www.ast.cam.ac. uk/research/repository/freitag/MODEST_MonteCarlo/MESSY_ Download.html. In this code the cluster is approximated as a set of spherical shells of zero thickness (henceforth termed ‘particles’) which represent a layer of one or more stars that share the same stellar properties (mass) , orbital parameters (kinetic energy and angular momentum) and phase. The phase and radial position of this particle in its orbit is not continuously evolved, since the particle does not represent a particular set of stars but instead the set of stars that at any time have this particular set of orbital properties. The cluster is set up (and always remains) in a state of dynamical equilibrium so that in the absence of the perturbations described below, the particles conserve their individual angular momenta and energies. The code only follows the evolution that results from changes on time-scales that are much longer than a typical stellar orbital period.
One of these processes is diffusive relaxation whereby the orbital properties represented by Monte Carlo particles are slowly perturbed in a way that mimics the cumulative effect of small angle deflections from other stars. This is implemented by randomly selecting pairs of nearby particles and effecting a two body encounter between them that changes their orbital properties ( kinetic energy and angular momentum). Each is then given a random phase and placed in a corresponding position on its orbit. The justification for this is that several dynamical times will have elapsed before two-body interactions have any effect on the overall cluster, so that the particle has time to ‘forget’ its previous phase.
The other process included in the code is the accretion of gas; in these simplest calculations, all particles share the same mass at a given time and gain mass at a uniform rate. Since the accreted gas is assumed to have zero momentum, the kinetic energy of each particle is reduced appropriately by gas accretion. As particles change their masses, kinetic energies and angular momenta as a result of accretion and diffusive relaxation it is necessary to re-assign their radii within the cluster and hence to take account of secular changes in the smooth component of the cluster potential. This latter is easily computed given the assumption of spherical symmetry. Monte Carlo codes thus generically avoid the problem encountered by direct Nbody integration codes which require the computation of the potential and force resulting from pair-wise forces. Consequently Monte Carlo codes represent a highly computationally efficient method for following the evolution of large N systems over a large number of dynamical times.
3.2 Simulation properties
We model a cluster as a spherical system of equal mass point masses distributed according to a Plummer law, i.e. with density profile (see e.g. Binney & Tremaine 1988). The initial isotropic velocity dispersion is scaled so as to ensure a state of virial equilibrium; the Monte Carlo code enforces a state of global virial equilibrium throughout, as is to be expected in the case of adiabatic accretion (i.e. accretion on a time-scale much longer than the dynamical time-scale). The only two evolutionary processes followed by the code are those of mass accretion and two body relaxation. Thus, a given simulation can be scaled so as to describe an entire family of clusters and accretion rates, provided that they have the same initial ratio of the mass accretion time-scale to the two body relaxation time-scale. In addition, however, we trace the incidence of stellar collisions, through post-processing of the densities and velocity dispersions yielded by the Monte Carlo code. It should be emphasised, however, that the collisions are not implemented in the code, but merely recorded. The incidence of collisions breaks the degeneracy between models with the same initial ratio of two body relaxation time-scale to mass accretion time-scale, and introduces a second dimensionless number, the ratio of the initial collision timescale to the mass accretion time-scale.
4 Results

4.1 Cluster density evolution
Figure 1 depicts the evolution of various Lagrange radii (each individually tracing the location of a point containing a fixed fraction of the cluster mass) as a function of the total cluster mass. This plot illustrates the two key phases of cluster evolution. At early stages of the collapse, the Lagrange radii track the expected result for adiabatic accretion, i.e. : the cluster evolution is self-similar, so that the initial Plummer sphere is mapped onto successively more compact Plummer distributions as the mass increases. However at later times (when the mass has increased by a factor for this particular simulation) deviations from self-similarity become apparent: the inner Lagrange radii start to decline more rapidly, while the decline of larger Lagrange radii starts to flatten out and then increase again. This latter behaviour may be readily understood as being a consequence of two-body relaxation. The diffusion terms in the Monte Carlo code have the effect of transferring energy outwards through the cluster, and correspond, in a real cluster, to the integrated effects of two body encounters. (This inexorable outward transfer of energy is a consequence of the negative heat capacity of self-gravitating systems such that energy loss from the core, and associated shrinkage and revirialisation, results in an increase in the core’s kinetic energy (‘temperature’). This then drives a further departure from thermal equilibrium; this process is sometimes termed the ‘gravothermal catastrophe’.) The ultimate consequence of such transfer, in a cluster consisting of single stars, is ‘core collapse’ whereby the central regions attain nominally infinite densities (see discussion in Section 5 of the role of three-body effects in averting this outcome). The time-scales for the latter stages of core collapse are short and thus negligible mass is accreted during this stage (hence the near vertical evolution in Figure 1 at late times). To first order, then, the evolution can be divided into an adiabatic regime (where two body effects are negligible) followed by a core collapse regime, wherein accretion is negligible. Needless to say, this is an over-simplification and the Monte Carlo code is needed to follow the transition between these regimes correctly. Nevertheless, we will use such a simple conceptual framework in order to find analytical scalings for collision frequencies, for comparison with our numerical data. Finally, we note that the over-all evolutionary time-scale is set by the time-scale for mass addition, ; since the density is such a steep function of total mass in the adiabatic regime (), the end of the adiabatic regime/core collapse is achieved during the time that the cluster mass increases only by a factor of order unity. The mass doubling time-scale, thus sets the over-all evolutionary clock.
All the clusters modeled have a qualitatively similar evolution to that shown in Figure 1. What however does depend on initial conditions is the collapse factor in the adiabatic regime (see Figure 2). One can derive this dependence on cluster parameters by exploiting the self-similar nature of the collapse in the adiabatic regime. We expect two-body relaxation to cause significant deviations from adiabatic collapse at the mass scale () at which the two-body relaxation time-scale, , becomes comparable with the mass doubling time-scale and have verified numerically that this is indeed the case. The former is given by:
| (2) |
where is the cluster radius and ln is the Coulomb logarithm, where and for a system of single masses (Freitag et al 2006). The mass doubling time-scale is given by
| (3) |
Thus, since shrinks as during the evolution and we are considering the cases where both and are constant, we obtain
| (4) |
and
| (5) |
Thus if we define the initial ratio of these time-scales as :
| (6) |
then we expect the ratio, to evolve as:
| (7) |
Consequently we expect the mass scale where (i.e. mass shrinkage and two body relaxation occur on the same time-scale) to satisfy:
| (8) |
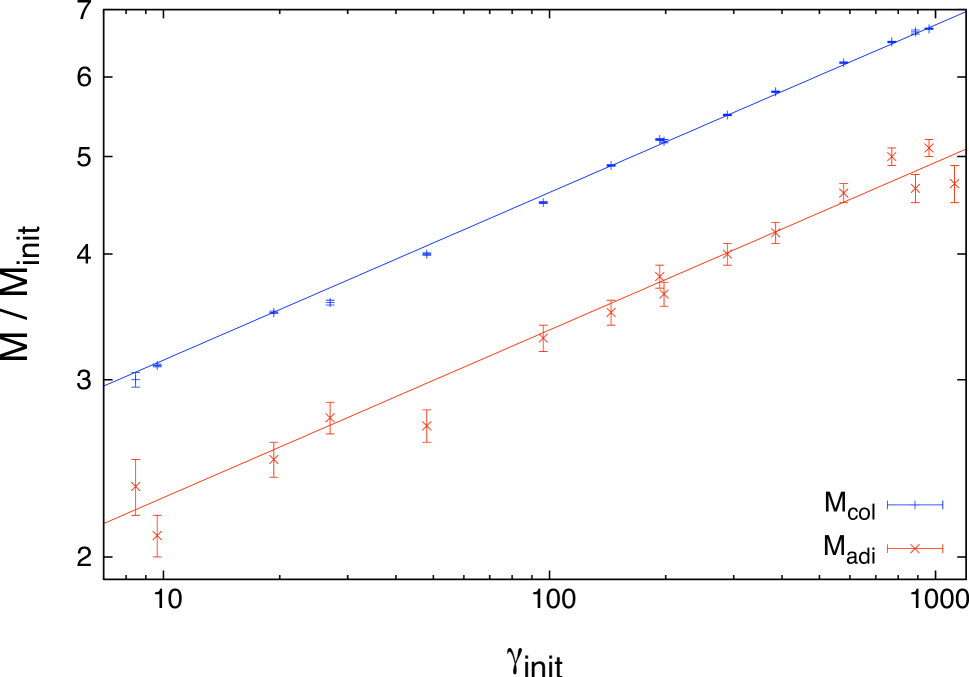
In Figure 2 we plot two mass scales as a function of : the lower points denote estimates of the mass scale at which adiabatic collapse ends (based on visual estimates of where the Lagrangian radii start to deviate significantly from the scaling) while the upper points instead represent the mass gained at the point of core collapse. Both quantities are parallel to the line with slope and therefore correspond to lines of constant (equation (8)). Note that the lower points correspond to : this is consistent with a picture in which two body effects first become significant at but where, in common with purely stellar dynamical calculations (e.g. Freitag & Benz 2001), this does not start to manifestly affect the evolution of the Lagrangian radii until several relaxation time-scales have elapsed.
We again note the rather modest mass gains that are required even to reach the point of core collapse and that the majority (around ) of the mass is added to the cluster in the adiabatic regime. Nevertheless the fact that the remaining of the mass is added after the end of the adiabatic regime emphasises that the latter phases of the cluster evolution are driven by a mixture of accretion and two body effects and that it is only in the final stages of core collapse that it becomes an essentially stellar dynamical problem.
4.2 Collisions in the adiabatic regime
It is straightforward to show, given the scalings of velocity and density with mass given above, together with an expression for the collision rate in the gravitationally focused regime (i.e. equation (1) when dominated by the first term in brackets), that the number of collisions per mass doubling time-scale scales as . 333Strictly the scaling is as , but the former term quickly comes to dominate with increasing , as shown by Figure 8. Since we have shown above that the mass added in the adiabatic regime scales as it then follows that the total number of collisions in the adiabatic regime is , where is the number of collisions expected in the first mass doubling time, i.e. the product of the initial collision rate () and . In the gravitationally focused regime the collision cross section scales as the product of the gravitational radius ( where is the stellar mass) and the stellar radius (), so that the collision rate per star is the product of this cross section with the number density and velocity dispersion; the total collision rate is times this value. Putting all this together we find and We also see that scales as and thus that the total number of collisions in the adiabatic regime () scales as . Applying the virial condition ( and ) we then find that we are left with the predicted scaling
| (9) |
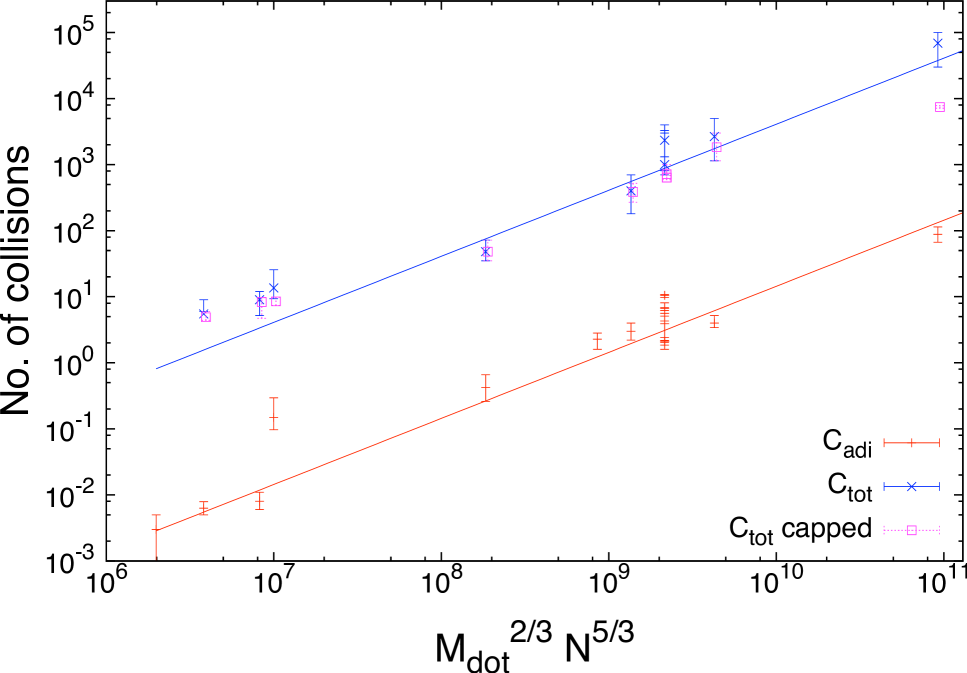
Although and both change during the simulation, we assume that their ratio is invariant (although in higher mass stars, the stellar radius is a rather weaker function of stellar mass). Thus we are left with the result that depends on only two parameters ( and ): notably neither the total cluster mass nor radius appear in this expression. The lower set of points in Figure 3 illustrate that this predicted scaling with and is indeed reproduced by the simulations.
Having established this scaling, it is instructive now to plot the total number of collisions in the adiabatic regime in the plane of accretion rate versus , since (for fixed ) these are the only cluster parameters that affect . Such a plot is shown in Figure 4. The crosses represent simulations annotated by the total number of collisions in the adiabatic regime as obtained by post-processing (note that some points here correspond to more than one point on Figure 2, since fixing and does not fix ; in these cases the label shows average collision number). The lines represent contours of constant predicted with numerical values fit to the results of Figure 3. Figure 4 shows that in general these fits are quite good predictors of the total number of collisions in the adiabatic regime. Figure 4 also indicates a couple of restrictions on input parameters. We have already noted (Section 2) that the adiabatic condition implies that the initial cluster velocity dispersion is such that . The minimum value of as a function of is shown on the top horizontal axis. These minimum velocity dispersions are rather low and rise only very mildly with ; thus we see that clusters with realistic velocity dispersions ( a few km/s) will undergo adiabatic shrinkage even in the case that is as high as Myr.
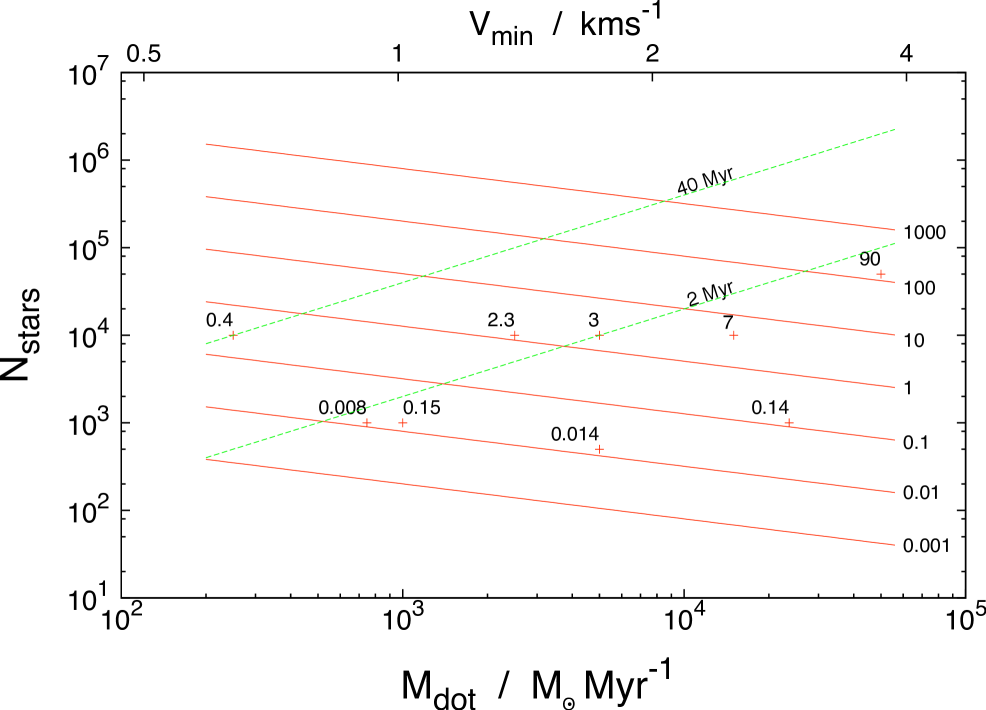
Figure 4 also shows two lines such that the over-all system evolution time-scale () is and Myr, on the assumption that the cluster initially consists of stars of mass . These two time-scales bracket the main sequence lifetimes of stars that are supernova progenitors and producers of powerful winds. If star formation in the cluster (in the absence of collisions) leads to stars in this mass range then at some point in the range Myr we expect supernova/stellar wind feedback to halt accretion and thus (unless the cluster is already well on the way to core collapse) further cluster shrinkage would halt at that point. The positions of these lines therefore imply that rapid cluster shrinkage (occurring on less than the time-scale for feedback to be effective) is associated with the lower right hand part of the diagram. We therefore see that significant numbers of collisions in the adiabatic regime are only produced in clusters that are vigorously accreting at the uncomfortably high rate of Myr-1 (which corresponds to of order a per cent of the entire galactic star formation rate). If such conditions were ever realised, the optimal cluster scale for producing a significant number of collisions in a short time would be .
4.3 Collisions in the post-adiabatic regime: the path to core collapse
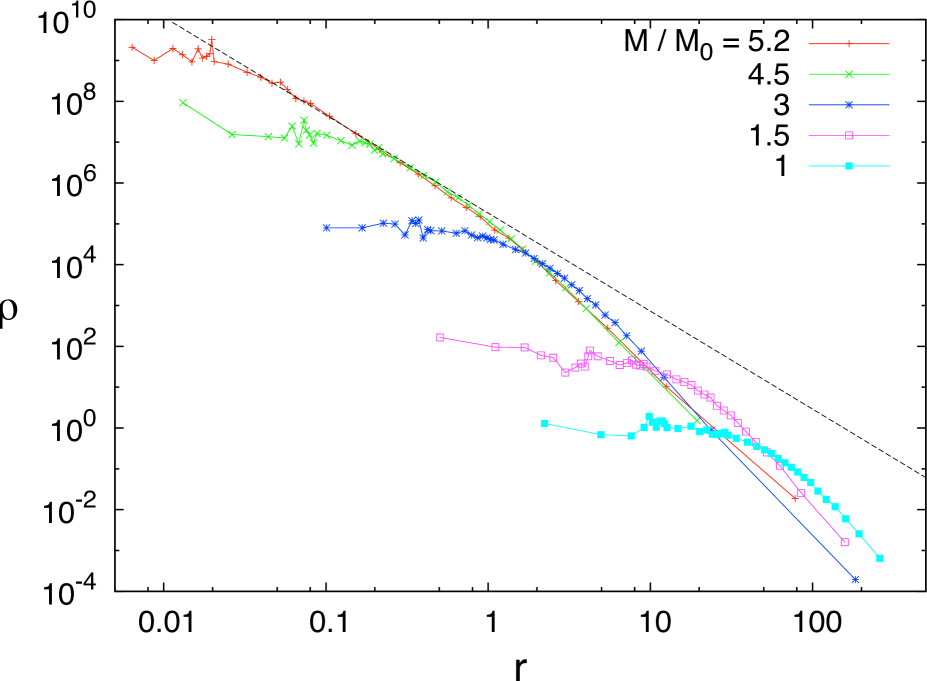
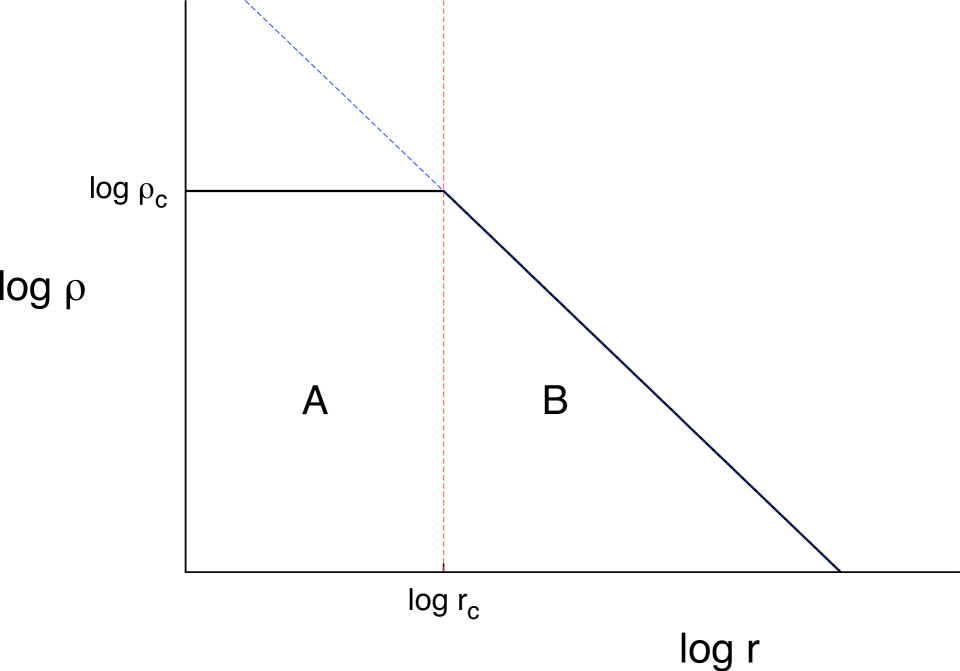
Figure 5 depicts snapshots of the cluster density profile: the right hand profile represents the initial Plummer sphere and the next two profiles are essentially scaled copies of this profile, illustrating that, as expected, the cluster evolves homologously in the adiabatic regime. The left hand two profiles however illustrate the development of a power law profile at intermediate radii with a slope of . This structure is characteristic of the density profile expected during core collapse (see Lynden-Bell & Eggleton 1980 for analytical arguments in favour of this power law profile outside the cluster core). Figure 6 is a schematic depiction of the evolution of the profile during core collapse: the point separating the ‘core’ 444Note that the ‘core’ that develops during core collapse should not be confused with the ‘core’ of the initial Plummer profile. and ‘halo’ (regimes A and B) evolves along the line shown: the core density rises during the approach to core collapse () but the fraction of mass contained in the core () falls during this period.
This behaviour turns out to be an important factor in limiting the total number of collisions during core collapse to finite values. We can estimate whether we expect this quantity to be convergent by noting that the remaining time to core collapse () can be expressed as a multiple of the instantaneous two body relaxation time-scale as core collapse is approached. Given the scaling of two body relaxation time-scale with the core mass and radius () and given the evolution of the core density along the locus (Figure 6) we can show that . We can also show that the total number of collisions during core collapse is dominated by those occurring in the vicinity of and that the total collision rate scales as . This then implies that scales as . Integrating this with respect to one sees that the predicted total number of collisions that are yet to occur in the remaining time () to core collapse is a (weak) positive power of - i.e. it is not expected to diverge as core collapse approaches (provided that does not fall indefinitely as core collapse is approached). This is consistent with our finding that the total number of collisions recorded is not arbitrarily sensitive to the fineness of the time sampling in the approach to core collapse. Nevertheless it is worth noting that the collision rate is strongly peaked towards the final phases of core collapse.
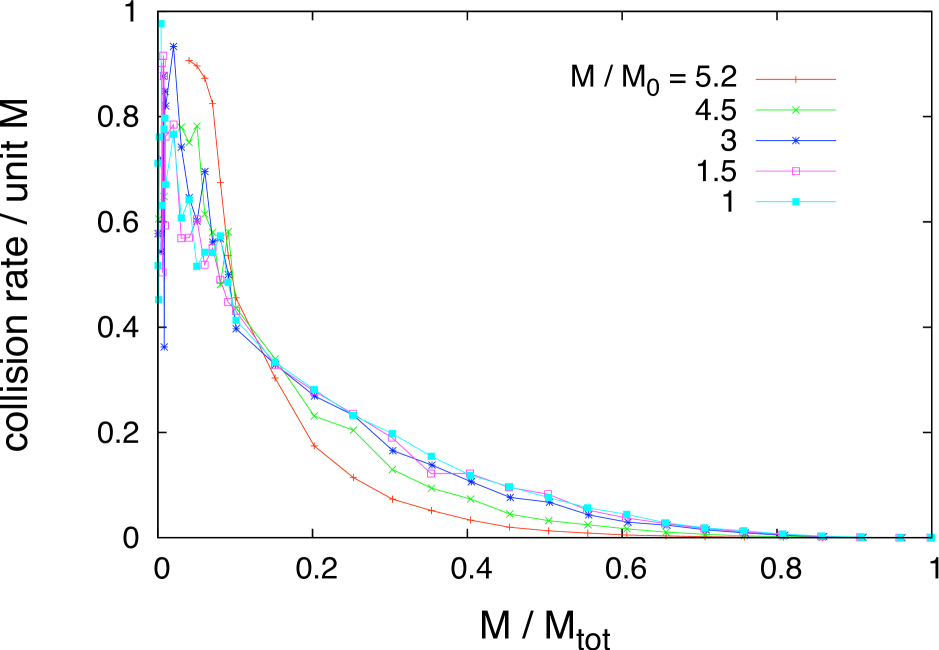
Figure 7 depicts the spatial location of where collisions are expected to occur, with the area under the curve depicting the total number of collisions occurring in any given mass range. Evidently, most of the collisions occur in the inner of the mass, which is consistent with the fact that it is only the Lagrangian radii enclosing less than of the mass that are involved in core collapse (see Figure 1). This concentration of collisions within a small mass fraction of the cluster has prompted us to examine whether the total number of collisions recorded are independent collision events or whether they represent multiple collisions of a given set of stars. In what follows we sometimes refer to ‘capped’ collision rates which have been obtained by limiting the total number of collisions in a Lagrangian shell to the number of stars in that shell. Simulations for which the uncapped rate is significantly larger than the capped rate are those where we expect a collisional runaway to be occurring in the core. The actual numbers become particularly unreliable once one enters a regime where stars are typically undergoing multiple collisions given that we at no stage feed back into the calculation the effects of any collisions that are expected to occur. Nevertheless the existence of simulations where the capped and uncapped values are quite different is a useful indicator of the regions of parameter space where we expect multiple collisions to be occurring.
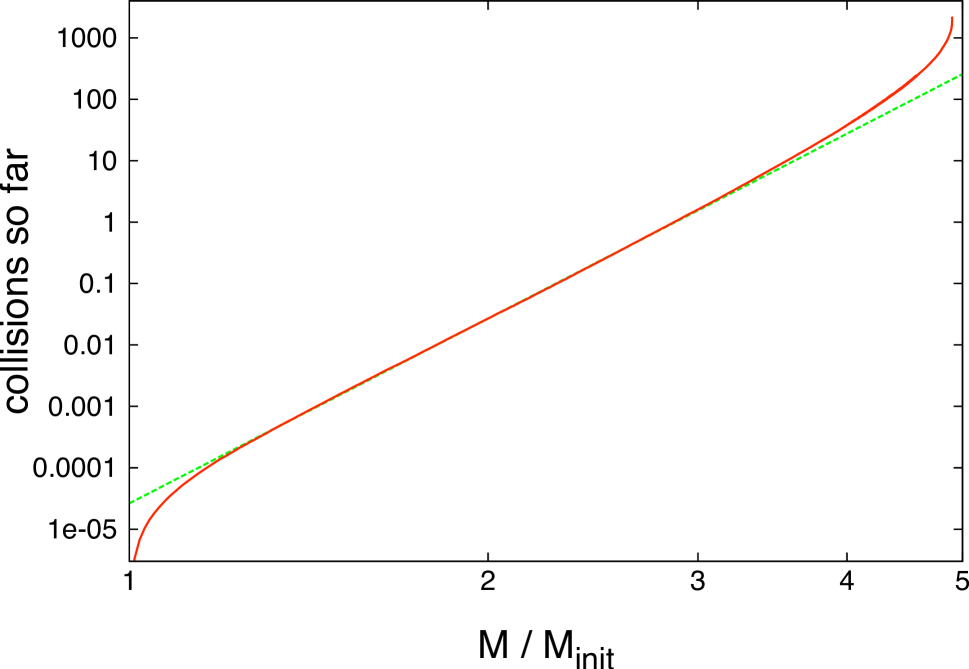
The upper points in Figure 3 represent the (capped and uncapped) numbers of collisions at the point of core collapse for the simulations for which the lower points denote the number of collisions during the adiabatic regime. We see that the total number of collisions follows exactly the same () scaling as the number of collisions in the adiabatic regime, but offset by a factor of about . We have already noted that, in the adiabatic regime, the number of collisions should scale as and that the mass increases by a further during post-adiabatic evolution. Thus our finding that the total number of collisions in the post-adiabatic regime (en route to core collapse) is around times higher than in the adiabatic regime is roughly consistent with an extrapolation of the number of adiabatic collisions to take account of the extra mass accreted. The reason for this can be discerned from Figure 1, which is a simulation in which the outer Lagrangian radii start to deviate from self-similar (adiabatic) shrinkage at a mass gain of factor whereas core collapse occurs at a mass gain factor of . We see that for most of the intervening interval, the deviation of the inner Lagrangian radii (where most of the collisions occur) from the adiabatic tracks is rather mild and only shows an abrupt downturn at the very end. The consequences of this evolution for the collision history is depicted in Figure 8; although the end of the adiabatic regime (defined as where the Lagrangian radii first start to deviate from adiabatic evolution) occurs at a mass gain factor of , the total number of collisions continues to rise as until a mass gain factor of (where ): at this point there is a further rise in the number of collisions by about a factor three in the last stages of core collapse.
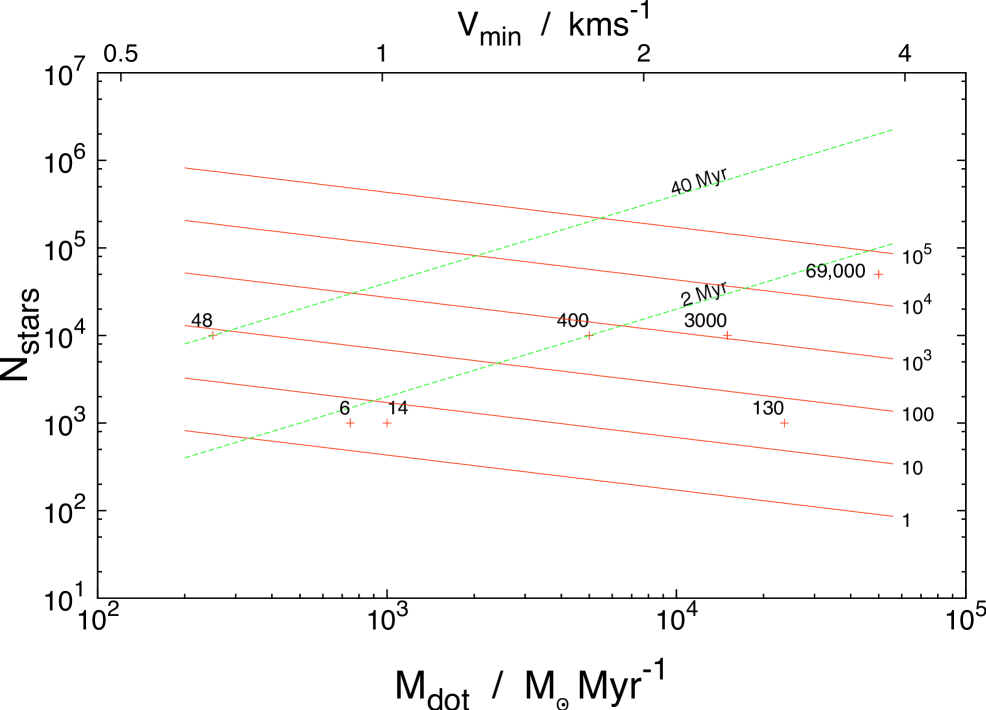
From an empirical point of view, therefore, we see that the previous assumption of Clarke & Bonnell (2008) that collisions only occur in the adiabatic regime was pessimistic; such collisions only represent of the total number expected in the case that the cluster evolves all the way to core collapse. This is shown in Figure 9, which is similar to Figure 4 but with an over-all increase in the number of collisions by a factor (the figures recorded in Figure 9 are uncapped; we see from Figure 3 that the capped and uncapped numbers start to diverge - indicating a regime of multiple collisions locally - at the stage that the total number of collisions is greater than a few hundred). This factor makes a critical difference to our assessment of whether there are environments in which we expect an astrophysically interesting number of collisions. We see from Figure 9 that we now expect many tens of collisions in clusters numbering more than a few thousand stars and with accretion rates exceeding /Myr. Both the threshold accretion rate and the threshold values are an order of magnitude lower than in the case that one counts only collisions in the adiabatic regime; 555As one would expect given the scaling of the number of collisions with and (equation (9)): we can use equation (3) (assuming that ) to show that the accretion rate at which, say, there are collisions within Myr scales as the power of the boost factor ( in this case). Thus the required accretion rates and values of fall from Myr-1 and to Myr-1 and respectively in particular, the required accretion rate is now more astronomically plausible.
5 Averting core collapse and the role of binaries
We have seen above that the generation of a large number of collisions requires that the cluster shrinkage can proceed well into the post-adiabatic regime. For the example shown in Figure 8, less than of the total collisions have occurred at the point that stellar dynamical relaxation effects first become significant (i.e. ) and a further few occur in a regime where the number of collisions continues to approximately follow the same scaling () as in the adiabatic regime. The rest of the collisions occur in a regime where the number of collisions then rises more steeply as a function of added mass, with around a half to two thirds of the total occurring in the final moments of core collapse.
We however need to be cautious about necessarily concluding that a real cluster will indeed follow this continued shrinkage of its inner regions. Although the Monte Carlo simulations contain a correct treatment of two-body relaxation (which is the driver of core collapse) they omit the effect of binary stars in re-inflating the cluster core. A well known effect in stellar dynamical simulations, which has come to be known as Heggie’s Law, is that the effect of interaction between hard binaries (i.e. those with an orbital velocity exceeding the cluster velocity dispersion) and other binaries and single stars is on average to transfer energy from the binary to the stars’ orbital motion in the cluster potential. In a situation where stars in the core are losing energy by two-body scattering to dynamically colder stars at larger radius, their consequent revirialisation in a more compact core configuration (i.e the process of core collapse) can be offset by the re-injection of energy from binary interactions (see, for example, the discussion in Chapter 9 of Heggie & Hut 2003). We therefore need to ask whether, given a realistic binary population, core collapse could be averted - or, more precisely (given that we don’t require core collapse to go right to completion in order to produce a significant number of stellar collisions) we need to ask at what stage in the collapse will the core be re-inflated by the effect of binaries.
In order to assess this issue, we will first consider the possible role of three-body binaries (i.e. those that are dynamically created in the cluster as a result of two stars becoming bound through transference of energy to a third body). This process requires that the three stars interact within an interaction volume of scale and is therefore favoured in small N systems where high stellar densities do not also imply large velocity dispersions (). Heggie & Hut (2003) estimate that core heating by three-body binaries is only important in cores containing less than stars. Our cores contain of the total number of stars in the cluster and so we only expect three-body binaries to be important in rather low systems (i.e. those totalling less than a few thousand stars). Since this is also the regime in which we do not expect a significant number of collisions (Figure 9) we conclude that three-body binaries have little bearing on the incidence of collisions in accreting clusters.
We now turn to primordial binaries, i.e. those binaries that are the product of the initial star formation process rather than being a consequence of later dynamical interactions in the cluster. We emphasise that we can only invoke the effect of hard binaries for the re-inflation of the cluster core, since soft binaries instead extract energy from the relative motion of stellar systems and are an energy sink rather than energy source. Given the parameters of the clusters we are considering and the expected rise in the core velocity dispersion en route to core collapse, the relevant hard-soft borderline for binaries totalling a few solar masses is of order an A.U.. Therefore it is only binaries of sub- A.U. separation in the post-adiabatic regime that can potentially avert core collapse. (Note, however, that since the binaries themselves are subject to adiabatic shrinkage, these hard binaries could evolve from binaries with initial separations of up to A.U.).
There are several conditions that need to be met in order for primordial binaries to be significant in offsetting core collapse but in the present case the critical one is that they must be able to deliver energy to the core at the rate required to counteract core collapse. The hard binary fraction () required to achieve this is given (Heggie & Hut 2003) by:
| (10) |
where is the Coulomb logarithm and is the ratio of the two-body relaxation time-scale in the core to the time remaining to core collapse (). We have estimated from the simulations and find that it is during the evolutionary phase when most of the collisions occur, in agreement with simple analytic estimates (Cohn 1980). This implies that the hard binary fraction that is required in order to offset core collapse is of the order of . This is within the range of realistic values for primordial fraction believed to apply in real clusters, suggesting that binaries may indeed play a significant role in some cases.
We do however note that if such a population of hard binaries did exist, 666Note that since we require of all our stars to be in hard binaries, the total energy contained in hard binaries is of order the binding energy of the core even if all the hard binaries are only modestly (less than an order of magnitude) harder than the hard-soft borderline. We would then satisfy another condition for binaries to re-inflate the core (see Chapter 9 of Heggie & Hut 2003) then one should also take into account the enhancement in collisions due to dynamical hardening of close pairs. Note that interactions that lead to mergers within binary pairs require the third star to approach within about a binary separation of the pair, as opposed to direct collisions which require stars to approach to within a stellar diameter. The (gravitationally focused) cross section for such interactions is thus much larger than for direct collisions and it is thus unsurprising, in situations where there are many hard binaries, that this should represent an important collision channel (Bonnell & Bate 2002, Gaburov et al 2008). Binary-binary interactions are also an important source of collisions in binary-rich clusters, with collisions due to such encounters dominating over those involving single stars at a binary fraction () fairly close to our required value of (Bacon et al 1996).
6 Conclusions
Our highly idealised exploration of the interplay between two-body relaxation, adiabatic accretion and collisions in young star clusters yields results that are qualitatively in line with the conclusions of Clarke & Bonnell (2008). The total number of stellar collisions scales as (independent of cluster mass, radius or velocity dispersion) and is thus strongly favoured in populous clusters. We see from Figure 9 that stellar collisions are likely to be important in populous clusters ( or more) provided that they are subject to accretion on a reasonable 777Here ‘reasonable’ implies a mass doubling time-scale of years if cluster shrinkage is required during the pre-main sequence stage; on the other hand a mass doubling time-scale of years would imply a super-Eddington luminosity for the accretion of dusty gas onto the constituent stars (Wolfire & Cassinelli 1987). The upper scale in Figure 9 indicates the minimum initial cluster velocity dispersion that is required for adiabatic accretion at the rate given by the corresponding figure on the lower scale. time-scale.
In contrast to the speculations of Clarke & Bonnell, however, we find that most () of the collisions are expected to occur after the point at which the two-body relaxation time-scale becomes comparable with the mass doubling time. We find that the evolution of Lagrangian radii starts to deviate from adiabatic collapse when the ratio () of two-body relaxation time-scale to mass doubling time-scale is about but that the number of collisions continues to grow as the th power of the added mass (as in the initial adiabatic phase) until drops to ; the total number of collisions rises by about an order of magnitude during this phase when is in the range to . Thereafter, the cluster undergoes the final stage of core collapse, boosting the total number of collisions by a further factor . We estimate that the shrinkage of the cluster core in our simulations would only be reversed if the cluster core contained a large fraction () of hard (sub A.U.) binaries and that in this case we might even find that the collision frequency was enhanced by mergers of stars within dynamically hardened binaries. This is an issue that needs to be explored by Nbody models of accreting clusters which include a significant hard binary population.
Another significant simplification in this work was its adoption of a single mass for all stars in the cluster, in contrast to realistic cluster initial mass functions. The presence of a primordial IMF leads to mass segregation as massive stars sink to the core through dynamical friction. For realistic IMFs these massive stars form a dynamically decoupled population at the cluster centre (Spitzer 1969). This has the effect of shortening the relaxation time in the core (e.g. Gürkan et al 2004) and also increasing the collisional cross-section, both of which can be expected to increase the collision rate; however, a full understanding of how this will affect our results, particularly when binaries are also involved, will require further investigation.
We have evidently arrived at the point where further progress requires the relaxation of the large number of restrictive assumptions listed in Section 1. This study has clarified the evolution of the idealised model and demonstrated that future work needs to focus on the role of binaries and mass segregation in the post-adiabatic regime.
Acknowledgements
The authors wish to thank H. Belkus for helpful feedback on the manuscript. OD is grateful for a grant provided by the Institute of Astronomy during part of this work.
References
- [] Bacon, D., Sigurdsson, S., Davies, M.B., 1996, MNRAS, 281, 830
- [] Binney, J., Tremaine, S., 1987, Galactic Dynamics. Princeton University Press
- [] Bonnell, I.A., Bate, M.R., 2002, MNRAS, 336, 659
- [] Bonnell, I.A., Bate, M.R., 2005, MNRAS, 362, 915
- [] Bonnell, I.A., Bate, M.R., Vine, S.G., 2003, MNRAS, 343, 413
- [] Bonnell, I.A., Bate, M.R., Zinnecker, H., 1998, MNRAS, 298, 293
- [] Clarke, C., Bonnell, I.A., 2008, MNRAS, 338, 1171
- [] Cesaroni, R., Galli, D., Lodato, G., Walmsley, M., Zhabg, Q., 2006, Nature, 444, 703
- [] Cohn, H., 1980, ApJ, 242, 765
- [] Freitag, M., 2008, Monte-Carlo Models of Collisional Stellar Systems, The Cambridge N-Body Lectures. Springer, Berlin
- [] Freitag, M., Benz, W., 2001, A & A, 375, 711
- [] Freitag, M., Benz, W., 2002, A & A, 394, 345
- [] Gaburov, E., Gualandris, A., Portegies Zwart, S., 2008, MNRAS, 384, 376
- [] Gürkan, M.A., Freitag, M., Rasio, F.A., 2004, ApJ, 604, 632
- [] Heggie, D. , Hut, P., 2003, The Gravitational Million-Body Problem, Cambridge University Press
- [] Lynden-Bell, D., Eggleton, P., 1980, MNRAS, 191, 483
- [] Spitzer, L. J., 1969, ApJ, 158, L139
- [] Stolte, A., Brandner W., Brandl, B., Zinnecker, H., 2006, AJ, 132, 253
- [] Trager, S., King, I., Djorgovski, S., 1995, AJ, 109, 218
- [] Wolfire, M.G., Cassinelli, J.P., 1987, ApJ, 319, 850
- [] Yorke, H., Sonnhalter, C., 2002, ApJ, 569, 846