77Se and 63Cu NMR studies of the electronic correlations in CuxTiSe2 ()
Abstract
We report 77Se and 63Cu nuclear magnetic resonance (NMR) investigation on the charge-density-wave (CDW) superconductor CuxTiSe2 ( and 0.07). At high magnetic fields where superconductivity is suppressed, the temperature dependence of 77Se and 63Cu spin-lattice relaxation rates follow a linear relation. The slope of vs T increases with the Cu doping. This can be described by a modified Korringa relation which suggests the significance of electronic correlations and the Se 4p- and Ti 3d-band contribution to the density of states at the Fermi level in the studied compounds.
1 Introduction
One of the central issues in condensed matter physics is to understand the interplay between diverse competing phases: for example, antiferromagnetism and superconductivity in the high- cuprates [1] and charge-density-wave (CDW) order and superconductivity in transition metal dichalcogenides [2]. Very recently, the CDW compound TiSe2 has been successfully doped by a Cu intercalation between adjacent layers [3]. This allows for tuning the electronic properties of CuxTiSe2 by controlling the Cu concentration . The Cu doping drives the system to a superconducting state around . In this regard, the CuxTiSe2 system provides a unique opportunity to study the competition between the CDW and superconducting phases in a controlled way.
The CuxTiSe2 compound has a layered structure with trigonal symmetry where the atoms are in octahedral coordination with Se. The Cu atoms occupy the positions between the TiSe2 layers which leads to an expansion of the lattice parameters [3]. The parent compound TiSe2 is one of the first CDW compounds, where a commensurate CDW at K with a wave vector was reported [2, 4]. The CDW transition is not driven by the nesting of a Fermi surface. Instead it is either due to a transition from a small indirect gap into a larger gap state with a slightly different location in the Brillouin zone or due to a particle-hole symmetry [3, 5]. The CDW transition in TiSe2 can be suppressed continuously by a Cu doping while superconductivity emerges with a maximum K at . The electronic structure has been investigated by band structure calculations and ARPES measurements [5, 6, 7, 8]. The remarkable feature is that the CDW order parameter competes microscopically with superconductivity in the same band and that the parent compound TiSe2 is a correlated semiconductor and the Cu doping enhances the density of states and raises the chemical potential.
Various measurements were also performed to further investigate the role of the Cu doping [9, 10, 11, 12, 14]. Thermal conductivity suggests that this system exhibits conventional s-wave superconductivity due to the absence of a residual linear term at very low temperatures [9]. The weak magnetic field dependence of thermal conductivity indicates a single gap that is uniform across the Fermi surface. Furthermore, it is suggested that the Se band is below the Fermi level and superconductivity is induced because of the Cu doping into the Ti bands [9]. An optical spectroscopy investigation on Cu0.07TiSe2 reveals that the compound has a low carrier density and has an anomalous metallic state because of the substantial shift of the screened plasma frequency [10]. This is corroborated by the temperature-independent Hall coefficient observed in heavily Cu-doped samples [11]. Raman scattering measurements as a function of doping suggest that the -dependent mode softening is associated with the reduction of electron-phonon couplings and the presence of a quantum critical point within the superconducting region [12].
In this paper we address the issue of electronic correlations in this system as a function of Cu doping using 77Se and 63Cu NMR. We studied two doping levels of CuxTiSe2 which exhibit CDW and/or superconductivity at zero field: ( K, K) and ( K). At high magnetic fields, superconductivity is suppressed and we find that the spin-lattice relaxation rate is described by a modified Korringa relation with a doping-dependent Korringa factor. The large values of the extracted interaction parameters signify the importance of electron-electron interactions and/or the Se p- and Ti d-band contribution for these materials. This is a key ingredient to the superconductivity for these compounds.
2 Experimental Details
Single crystals of CuxTiSe2 were grown by chemical iodine-vapor transport method and characterized by x-ray, transport, and susceptibility measurements [11]. The plate-like samples with average thickness of m along the -axis were cut in rectangular shapes with approximate dimensions . Parallel stacks of rectangular samples were placed in a rectangular-shaped copper coil for a better filling factor with the magnetic field B applied along the ab plane (parallel with the plates) for NMR measurements. Two doping levels () of CuxTiSe2 were studied under the same conditions. 77Se and 63Cu NMR spectra, Knight shift, and spin-lattice relaxation rates were obtained using a homebuilt NMR spectrometer equipped with a high homogeneity 15 T sweepable magnet. was measured by the recovery of the spin echo intensity as a function of time after saturation.
3 Results and Discussion

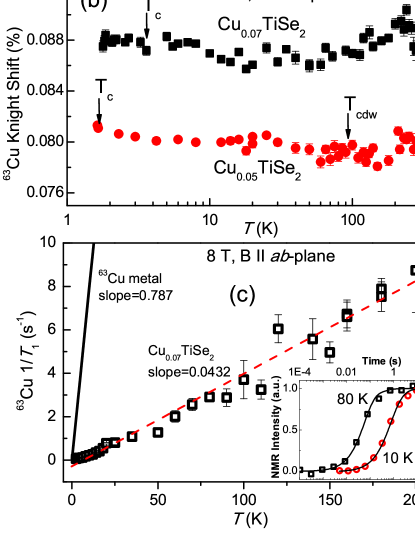
Figure 1(a) shows the representative 63Cu (spin-3/2, MHz/T, 69.1 % natural abundance) NMR spectrum. The 63Cu NMR spectrum consists of two peaks, which are assigned to the signals from the sample and copper coil as indicated in the figure. The symmetric, sharp spectral shape of the NMR signal indicates that the Cu site is not affected by CDW modulation. The insensitivity of 63Cu nuclei to an electronic state should be ascribed to the fact that the Cu atoms are located in between the TiSe2 layers which are bounded by van der Waals interaction. Quadrupolar effects are expected for Cu nuclei which occupies a site of non-cubic symmetry but the satellites are not observable. The quadrupole frequency for 63Cu is usually on the order of 20-30 MHz [13], thus the quadrupolar satellites are probably too broad and washed out due to disorder since Cu is dilute in this system. As such, the recovery of the longitudinal nuclear magnetization is appropriately fitted by the master equation for a spin-3/2 central transition using a single saturating pulse: [15] (see Fig.1(c) inset). The temperature dependence of 63Cu NMR Knight shift and spin-lattice relaxation rate at 8 T is summarized in Figures 1(b) and (c). The 63Cu Knight shift data exhibit very weak temperature dependence with % for and % for , whereas in comparison 63Cu metal has % [13]. There is no hint that its temperature dependence scales to the magnetic susceptibility. In addition, no anomalies are accompanied by the CDW transition. This might be due to the fact that the external field of 11.1 T fully suppresses the residual CDW state by shifting the chemical potential and/or changing the electronic density of states of Ti 3d bands. The 63Cu spin-lattice relaxation rate for varies linearly with temperature, obeying Korringa behavior with a slope approximately 1/18 times that of a pure 63Cu metal.
Since the Se atoms are located on the layers, they probe the Fermi surface and provide more information on electronic correlations in this material. Figure 2 displays temperature dependence of 77Se (spin-1/2, MHz/T, 7.5 % natural abundance) spectra and NMR shift of the compound at B=11.1 T. The 77Se NMR signal shows the symmetric, sharp spectral shape as well. The NMR shift is constant from 280 K to 150 K but increases monotonically upon further cooling. We note that the room temperature NMR shift for the CuxTiSe2 samples ( for and for ) are close to the reported NMR shift values of the selenide compounds TiSe2 () [16] and TaSe2 () [17].
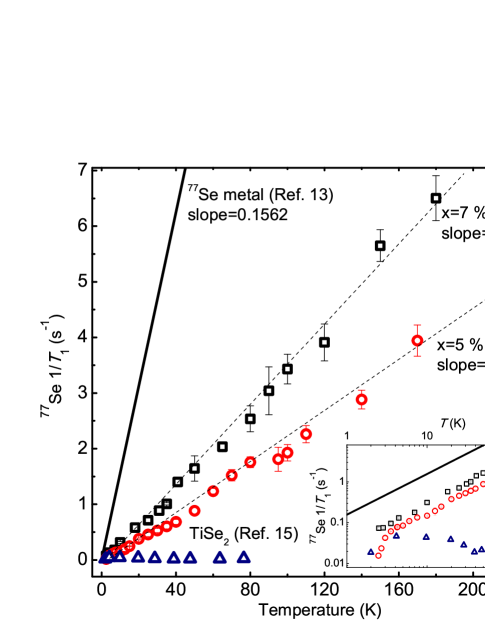
In Figure 3 we compare temperature dependence of of CuxTiSe2 () single crystals with that of a 77Se metal [13] and powdered TiSe2 [16]. A single-exponential fitting equation was used to extract the values from the magnetization recovery curves. It is apparent that an increase of the Cu doping concentration leads to an enhancement of the relaxation rate as well as an increase of the slope of the Korringa-like behavior. The inset of Fig. 3 shows the non-linear vs T behavior of the parent compound TiSe2 and the subsequent linear behavior upon Cu doping which suppresses the CDW state. In order to understand the underlying mechanism of the observed behaviors we invoke a model involving a Korringa factor due to the effect of electron-electron interaction in metals and alloy compounds developed by Moriya [18] and later refined by Narath and Weaver [19].
In simple metals, the dominant relaxation mechanism of nuclear spins is due to their interaction with conduction electron spins. This is given by the Korringa relation wherein only Fermi contact interaction is taken into account for noninteracting electrons. However electron-electron interactions cannot be neglected especially for metal alloys. The Coulomb interaction has an effect on the magnetic susceptibility which is proportional to the Knight shift Ks [18, 19]. The internal magnetic field experienced by a nucleus is given by where is the average internal magnetic field and is the fluctuating magnetic field. The nuclear spin lattice relaxation rate is a measure of the perpendicular fluctuating magnetic field given by . In metals with strictly non-interacting electron gas, the relaxation rate is proportional to the temperature and square of the Knight shift [18], known as the Korringa relation:
| (1) |
where , are the nuclear and electron gyromagnetic ratios, respectively. Moriya modified the Korringa relation by incorporating the factor that includes the effect of a -function-potential electron-electron interaction [18]:
| (2) |
where the Korringa factor is a function of the interaction parameter , a measure of electron-electron interaction. Here and from the free electron approximation with where is a constant, n is the number of electrons, q is the wavevector, and , are the Fermi energy and wave number, respectively [18]. The value of ranges from 0 to 1. For , which gives us Eqn.(1). A corrected version was later formulated by Narath appropriate for alkali and noble metals where the function potential has a non-zero interaction range less than the atomic radius [19].
Before delving into the Korringa factor calculation, we note that the orbital shift contribution cannot, in the present case, be accurately separated from the spin part. Typically, the orbital contribution can be unambiguously determined in the superconducting state where the spin part of the shift vanishes at low temperature due to pairing. However, access of NMR in the superconducting state, believed to be of BCS type [9], is hampered by the low upper critical field ( T) [3] of these compounds. We can however make some estimates based on the NMR data from the parent compound TiSe2 [16]. The total NMR shift can be expressed as:
| (3) |
where is the s-electron contact term, is the p-electron core polarization term, is the Van Vleck orbital contribution, and is the chemical shift. Experimental estimates from a previous 77Se NMR study on TiSe2 [16] at room temperature yield , , thus the temperature-independent part is 0.071%. Since Cu doping into the TiSe2 layers increases the density of states (DOS) at the Fermi level, this will increase and , but the terms and should be unaffected since they do not depend on DOS. We can then estimate the spin-part of the total shift for CuxTiSe2 system to be approximately (). This gives us the high temperature Knight shift values of 0.07% for () and 0.079% for () doping level (see Table 1).
| CuxTiSe2 | (Moriya) | (Narath) | |||
|---|---|---|---|---|---|
| [16] | 0.0005 | 0.03 | 0.0401 | 0.955 | 0.99 |
| 0.0259 | 0.07 | 0.382 | 0.535 | 0.812 | |
| 0.0363 | 0.079 | 0.42 | 0.505 | 0.782 |
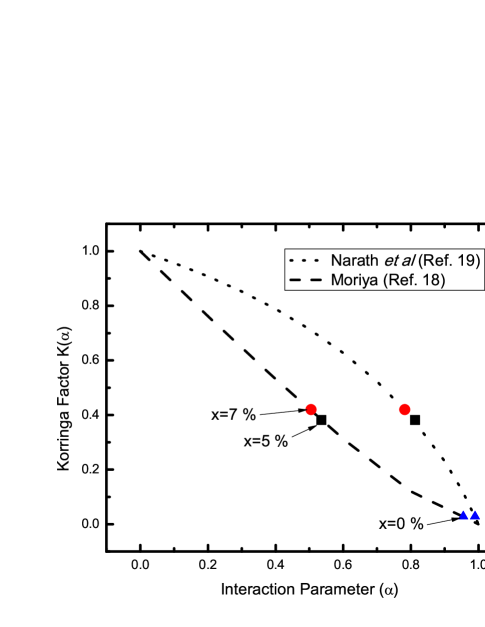
The Korringa factors for CuxTiSe2 () system were calculated using Eqn.(2). By comparing our data to the enhanced Korringa factor versus interaction parameter calculated from Ref.[18] [see Fig. 4], we are able to determine the interaction parameter . The calculated values of and are summarized in Table 1. First we revisit the 63Cu data in Fig.1 which yield , for % and , for a pure 63Cu metal. The fact that indicates that the exchange enhancement in the Cu metal is more dominant than in the Cu0.07TiSe2 compound. For the 77Se data, , for % and , for % doping. The large value of highlights the significance of electron-electron interactions. In comparison, data from the parent compound TiSe2 [16] at room temperature (see Table 1) yield , . The small value of for TiSe2 may suggest strong ferromagnetic correlations [20] but this compound is viewed as a correlated semiconductor which may warrant its deviation from this theoretical interpretation [21]. For CuxTiSe2 system, the result indicates that Cu intercalation monotonically increases the exchange-enhancement in the Se site. In addition to correlation effects, the contribution of the density of states (DOS) should also be considered in the observed relaxation behavior. Here CuxTiSe2 compounds evolve into better metals as evidenced by decreasing resistivity and increasing susceptibility as Cu doping is increased [3, 11]. This points to the fact that increasing Cu content introduces carriers into the TiSe2 conduction band, increasing the DOS at the Fermi level [3] thereby enhancing the relaxation rates in agreement with our experimental data.
4 Conclusion
We have presented 77Se and 63Cu NMR studies of CuxTiSe2 (). We find that 63Cu Knight shift shows weak variations with temperature and the spin-lattice relaxation rate follows a modified Korringa relation. The observed Korringa factor was discussed in terms of Moriya’s exchange-enhanced relaxation model and density of states contribution. Our results suggest that enhanced electronic correlations and Se p- and Ti d-band play a key role in inducing superconductivity in the CuxTiSe2 compounds.
5 Acknowledgement
This work is supported by the US National Science Foundation (NSF) DMR grant 0602859, Priority Research Center Program (2009-0093817) and Basic Science Research Program (2009-0077376) of Korea NRF, and the National Basic Research Program for China 2006CB922005. The experiments were performed at the National High Magnetic Field Laboratory which is supported by NSF DMR-0084183, by the State of Florida, and by the Department of Energy.
References
References
- [1] Imada M, Fujimori A and Tokura Y 1998 Rev. Mod. Phys. 70 1039
- [2] Wilson J A, Di Salvo F J and Mahajan S 1975, Adv. Phys. 24 117
- [3] Morosan E, Zandbergen H W, Dennis B S, Bos G W G, Onose Y, Klimczuk T, Ramirez A P, Ong N P and Cava R J Nature Phys. 2 544
- [4] Di Salvo F J, Moncton D E and Waszczak J V 1976 Phys. Rev. B 14 4321
- [5] Qian D, Hsieh D, Wray L, Xia Y, Wang N L, Morosan E, Cava R J and Hasan M Z 2007 Phys. Rev. Lett. 98 117007
- [6] Jeong T and Jarlborg T 2007 Phys. Rev. B 76 153103
- [7] Jishi R A and Alyahyaei H M 2008 Phys. Rev. B 78 144516
- [8] Zhao J F, Ou H W, Wu G, Xie B P, Zhang Y, Shen D W, Wei J, Yang L X, Dong J K, Arita M, Namatame H, Taniguchi M, Chen X H and Feng D L 2007 Phys. Rev. Lett. 99 146401
- [9] Li S Y, Wu G, Chen X H and Taillefer L 2007 Phys. Rev. Lett. 99 107001
- [10] Li G, Hu W Z, Qian D, Hsieh D, Hasan M Z, Morosan E, Cava R J and Wang N L 2007 Phys. Rev. Lett. 99 027404
- [11] Wu G, Yang H X, Zhao L, Luo X G, Wu T, Wang G Y and Chen X H 2007 Phys. Rev. B 76 024513
- [12] Barath H, Kim M, Karpus J F, Cooper S L, Abbamonte P, Fradkin E, Morosan E and Cava R J 2008 Phys. Rev. Lett. 100 106402
- [13] Carter G C, Bennett L H and Kahan D J (eds) 1977 Metallic Shifts in NMR (Oxford: Pergamon)
- [14] Budko S L, Canfield P C, Morosan E, Cava R J and Schmiedeshoff G M 2007 J. Phys.: Condens. Matter 19 176230
- [15] Narath A 1967 Phys. Rev. 162 320
- [16] Dupree R, Warren W W Jr and DiSalvo F J 1977 Phys. Rev. B 16 1001
- [17] Borsa F and Torgeson D R 1976 Bull. Am. Phys. Soc. 21 262
- [18] Moriya T 1963 J. Phys. Soc. Japan 18 516
- [19] Narath A and Weaver H T 1968 Phys. Rev. 175 373
- [20] Shastry B S and Abrahams E 1994 Phys. Rev. Lett. 72 1933
- [21] Lee H O and Choi H Y 2000 Phys. Rev. B 62 15120