An Optimized Data Structure for High Throughput 3D Proteomics Data: mzRTree
Abstract
As an emerging field, MS-based proteomics still requires software tools for efficiently storing and accessing experimental data. In this work, we focus on the management of LC-MS data, which are typically made available in standard XML-based portable formats. The structures that are currently employed to manage these data can be highly inefficient, especially when dealing with high-throughput profile data. LC-MS datasets are usually accessed through 2D range queries. Optimizing this type of operation could dramatically reduce the complexity of data analysis. We propose a novel data structure for LC-MS datasets, called mzRTree, which embodies a scalable index based on the R-tree data structure. mzRTree can be efficiently created from the XML-based data formats and it is suitable for handling very large datasets. We experimentally show that, on all range queries, mzRTree outperforms other known structures used for LC-MS data, even on those queries these structures are optimized for. Besides, mzRTree is also more space efficient. As a result, mzRTree reduces data analysis computational costs for very large profile datasets.
keywords:
proteomic data formats , R-tree; profile data, scalability, massive dataset1 Introduction
Mass spectrometry-based proteomics [1] plays an ever-increasing role in different biological and medical fields, but, as an emerging field, it still requires reliable tools for the storage, exchange and analysis of experimental data. Over the last years, it has become available a wide range of technologies which can generate a huge quantity of data potentially able to address relevant questions, e.g., to identify proteins in a biological sample, to quantify their concentration, to monitor post-translational modifications, to measure individual protein turnover, to infer on interactions with other proteins, transcripts, drugs or molecules. The technology is quickly advancing but, without efficient bioinformatics tools, high-throughput proteomics data handling and analysis are difficult and error-prone. Therefore, a major challenge facing proteomic research is how to manage the overwhelming amount of data in order to extract the desired information. This holds especially for high-throughput quantitative proteomics, since it needs highly informative, high-resolution profile data, in order to achieve reliable quantifications. Moreover, the data hostage held by different instrument proprietary formats slows down the evolution of proteomics, mainly because comparisons among different experiments, or analytical methods, often become unfeasible.
In order to facilitate data exchange and management, the Human Proteome Organization (HUPO) [2] established the Proteomics Standards Initiative (PSI). HUPO-PSI released the Minimum Information About a Proteomics Experiment (MIAPE) reporting guidelines [3] and proposed mzData [4], which, as mzXML [5], is an eXtensible Markup Language (XML) based data format, developed to uniform data. Recently, merging the best features of each of these formats, the HUPO introduced mzML as a unique data format [6]. XML-based data formats are characterized by intuitive language and a standardized structure. At the state of art, the adoption of these formats is widespread among the proteomics research groups, also thanks to the extensive support of instrument and database searching vendors, and the availability of converters from proprietary data formats. In spite of their success, the currently adopted formats suffer from some limitations [7]: the impossibility to store raw data [8]; the lack of information on the experimental design, necessary for regulatory submission; the lack of scalability with respect to data size, a bottleneck for the analysis of profile data. Above all, the 1-dimensional (1D) data indexing provided by these formats considerably penalizes the analysis of datasets embodying an inherent 2-dimensional (2D) indexing structure, such as Liquid Chromatography-MS (LC-MS) ones.
LC-MS provides intensity data on a 2D domain, since LC separates proteins along retention time dimension (temporal index) based on their chemical-physical properties, while MS separates proteins based on their mass over charge ( index) ratios. Minimizing the computational time to access these huge datasets plays a key role in the progress of LC-MS data mining, and can be of help also in a variety of other MS techniques, since MS experiments usually have a “temporal” index related to the experimental time at which the MS acquisition takes place (e.g., a scan in mzXML). Therefore, MS data can be accessed by means of either an range, or a temporal range, or a combination of them, defining different range queries. On LC-MS data, these accesses provide respectively chromatograms, spectra, and peptide data, whereas on generic MS data, they provide a set of sub-spectra belonging to the specified range. An elevated number of range queries are required during data analysis, thus optimizing them would significantly improve computational performance.
Most research groups develop, often in a sub-optimal way, intermediate data structures optimized for accesses on a privileged dimension, depending on the downstream analysis. For instance, accredited software packages like Maspectras [9] or MapQuant [10] make use of the method-specific intermediate data structures Chrom and OpenRaw, respectively: the former is optimized for a chromatogram based access, the latter for a spectra based access. In a recent work [11] Khan et al. provide evidence that the use of a spatial indexing structure, namely the kd-tree, is suitable for handling large LC-MS datasets and supporting the extraction of quantitative measurements. The authors emphasize the effectiveness of the kd-tree for performing analyses based on range queries but they do not compare explicitly the range query performance of the kd-tree with that attainable by other known data structures. Moreover, their experimental assessment is carried out only on centroid datasets and does not consider profile data, which, as the literature often remarks [8], are the most informative, especially for quantitative analysis, but also the most challenging to handle. For this reason the objective of this work would rather be to develop a data structure to efficiently access profile data.
Here, we present a novel data structure, called mzRTree, for high-throughput LC-MS profile datasets, which combines a hybrid sparse/dense matrix representation of the data and a scalable index based on the R-tree [12]. We show experimentally that mzRTree supports efficiently both 1D and 2D data accesses. In particular, mzRTree significantly outperforms Chrom and OpenRaw on small and large peptide range queries, yielding in some cases orders of magnitude improvements. Furthermore, it still ensures best performance on the accesses for which the other data structures are optimized, i.e., chromatograms for Chrom and spectra for OpenRaw. The experiments also provide evidence that mzRTree is more space efficient than Chrom and OpenRaw, and exhibits good scalability on increasing dataset densities.
2 The mzRTree Data Structure
Let us conceptually view an LC-MS dataset as a matrix, where the rows are indexed by retention times, the columns by values, and the entries are intensity values. A generic entry is denoted as , where and are the row and column indices, and is the intensity value.
We store using a hybrid sparse/dense matrix representation, as follows. First, we evenly subdivide the matrix into strips of consecutive rows, where is a user defined parameter. Then, each strip is in turn partitioned into a number of bounding boxes (BBs), each corresponding to a distinct range of values. In our implementation, each BB corresponds to approximately Da, and is set in such a way to ensure that each strip fits in the main memory (RAM). A BB is characterized by four coordinates, namely: top-rt (resp., bottom-rt), which is the smallest (resp., largest) retention time of the BB’s nonzero intensity entries; and left-mz (resp., right-mz), which is the smallest (resp., largest) value of the BB’s nonzero intensity entries. The BBs of a strip are stored consecutively in a file, and each strip is saved in a distinct file so that it can be efficiently loaded in the main memory during a range query. If half or more of the entries in a BB have nonzero intensity, then the BB is stored in the file using a dense matrix representation. Otherwise, a sparse representation is used storing the nonzero intensity entries in row-major order, indicating for each such entry the column ( value) and the intensity, and separating successive rows through special characters. In this fashion, each BB occupies a space proportional to the number of nonzero intensity entries it contains.
A range query operation on takes as input two retention times , , and two values, , , and returns all entries in such that and . Accesses to chromatograms, spectra or peptide data can be easily expressed through range queries. In order to support efficient range query operations, we use an index implemented through a tree structure based on the R-tree [12, 13], which is a well known spatial data structure for managing geometric data.
Let and be two integer parameters, and let be the set of nonempty BBs (i.e., BBs which contain at least one nonzero-intensity entry). Denote by the cardinality of . Our index consists of a balanced search tree whose leaves are associated with disjoint subsets of forming a partition of . The number of children of each internal node is proportional to d (the root, if internal, may have a smaller number of children) and each leaf is associated with a subset of size proportional to of BBs in (the root, if a leaf, may have less than BBs). Each internal node of the tree is associated to the smallest submatrix of D which contains all BBs associated with its descendant leaves.
The execution of a range query requires to traverse all root-leaf paths ending in leaves associated with BBs that intersect the rectangle defined by the query, and to return all entries of interest. The complexity of a range query depends on the height of the tree, hence on the parameters and , and on the mapping of the BBs to the leaves. As for the choice of the partition parameters and , when dealing with massive datasets, which must be kept in secondary memory, it is convenient to impose that each node of the tree (except, possibly, the root) occupies a constant fraction of the minimal unit that can be transferred between the secondary memory and the RAM. Instead, for what concerns the mapping of the BBs to the leaves, several heuristics have been proposed in the literature (see [13] for relevant references).
In our implementation, we set and , and the actual structure of the tree is recursively defined as follows, based on ideas in [12]. If , the tree consists of a single leaf associated with the set ; otherwise, is partitioned into six groups, , for , as follows. contains the BBs with smallest top-rt; contains the BBs in with smallest left-mz; contains the BBs in with largest bottom-rt; contains the BBs in with largest right-mz; contains the BBs in with smallest left-mz; and contains the remaining BBs. The six groups are associated with the subtrees rooted at the children of the root, which are recursively organized in a similar fashion. Each leaf is thus associated with up to BBs, and it stores, for each of its BBs, the four coordinates (top-rt, bottom-rt, left-mz, right-mz) and a pointer to the file where the BB is stored together with the relative offset within the file. It can be easily shown that the height of the tree is proportional to .
We call mzRTree the whole data structure, which includes the actual data (i.e., the bounding boxes) stored in the files, and the tree index described above. We developed a Java implementation of mzRTree, which includes a method to build an mzRTree starting from an input dataset provided in mzXML format [5], and a method to perform a generic range query111The Java code implementing mzRTree is available for download at http://www.dei.unipd.it/mzrtree..
3 Experimental Results and Discussion
In this section, we evaluate and discuss mzRTree performance compared to Chrom and OpenRaw, which are two existing data structures used by Maspectras [9] and MapQuant [10] software packages and optimized for chromatograms and spectra based accesses, respectively. Specifically, we focused our analysis on the time required for a range query, the time required for building up the data structure, and the required hard disk space. Furthermore, we verified mzRTree scalability for what concerns range query times using datasets of increasing density, where the density of a dataset is defined as the ratio of the number of retention time and value pairs associated with nonzero intensities to the overall number of retention time and value pairs.
We compared mzRTree, Chrom and OpenRaw on seven LC-MS datasets, named EXP1, EXP2, ART1, ART2, ART3, ART4 and ART5, which are described below. The EXP1 dataset consists of real profile data from a controlled mixture of ICPL-labeled proteins acquired in enhanced profile mode for survey scans to gain higher mass accuracy using a Finnigan LTQ linear ITMS (Thermo Electron) equipped with HPLC-NSI source. The EXP2 is a real profile dataset acquired with a Waters ESI TOF Microchannel plate LCT Premier available on the PeptideAtlas public database. The ART1, ART2 and ART3 datasets have been generated by the LC-MS simulator LC-MSsim [14] using as input some peptide sequences from bovine serum albumin (UniprotKB: P02769), human apotransferrin (UniprotKB: P02787) and rabbit phosphorylase b (UniprotKB: P00489). Finally, the ART4 and ART5 datasets have been generated artificially by the following procedure: for each dataset, the user specifies some input parameters, namely, the number of spectra (i.e., the total number of retention times), the range and resolution, and the density d; then, each spectrum is populated by assigning nonzero intensity values to positions corresponding to values drawn from a uniform distribution until the density of the spectrum is ; clearly, if each spectrum has density , then the final dataset will have density . ART4 and ART5 are useful to evaluate the scalability of our data structure although they are not meaningful from a biological standpoint.
The characteristics of the aforementioned datasets are summarized in Table 1. Notice that the resolution shown in Table 1 is not the original data resolution (i.e., the instrumental resolution) but it is a suitable resolution, not smaller than the original one, which has been adopted in our data representation for uniformity with the other data representations used for comparison in the experiments. In particular, the Chrom files we used, adopted a Da resolution: this resolution is higher than the maximum resolution achievable by the instruments used to acquire the experimental data. Therefore, our choice is conservative in the sense that it does not require any binning and, consequently, does not cause any loss of information.
| EXP1 | EXP2 | ART1 | ART2 | ART3 | ART4 | ART5 | |
| type | real | real | artificial | artificial | artificial | artificial | artificial |
| range | |||||||
| spectra number | |||||||
| resolution | |||||||
| density | |||||||
| mzXML file size |
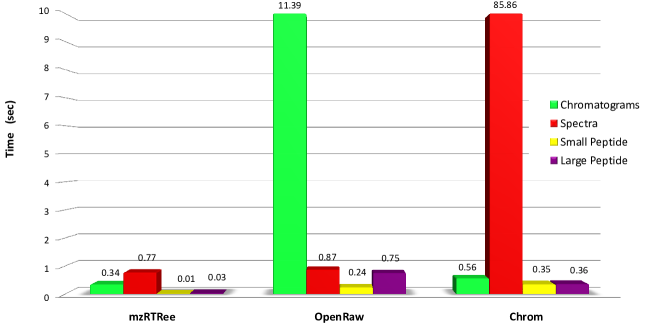
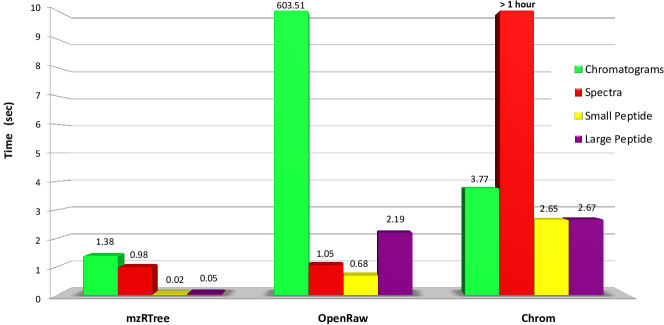
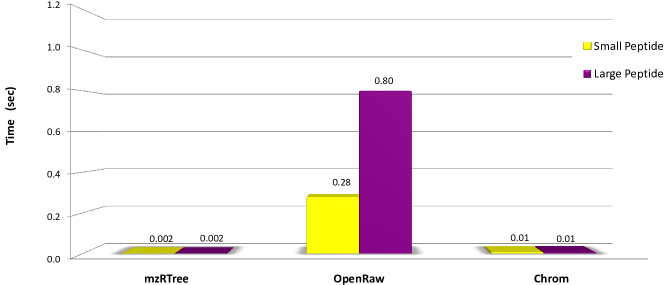
We compared mzRTree, Chrom and OpenRaw on four kinds of range queries: a rectangle covering all the retention times and a Da range in the dimension (chromatograms); a rectangle covering the entire dimension and retention times (spectra); a rectangle of Da and retention times (small peptide); a rectangle of Da and retention times (large peptide). We estimated the performance for each kind of range query summing the access times required to perform ten range queries spanning the whole dataset in order to avoid any local advantage. More precisely, we evaluated separately the time required for loading the internal variables used by each data structure every time it is invoked (load time) and the time actually needed to perform only the range query (access time). To reduce random variability, we computed both access and load times averaging over ten experimental repetitions. It is worth to notice that a spectra range query is more time consuming than a chromatograms range query, since the number of distinct values is typically much bigger than the number of retention times. Results on access times for the EXP1 and EXP2 datasets are shown in Figures 1 and 2, respectively. As the figures clearly show, mzRTree achieves the best performance on all kinds of range queries for both the smaller size and density dataset EXP1 and the larger size and density dataset EXP2. Furthermore, Figure 3 illustrates the access times for ten peptides in EXP1 using small and large peptide range queries, whose bounds refer to peptides actually identified by the Mascot search engine. mzRTree significantly outperforms Chrom and OpenRaw on small and large peptide range queries, and still ensures best performance on the accesses for which the other data structures are optimized, i.e., chromatograms for Chrom and spectra for OpenRaw.
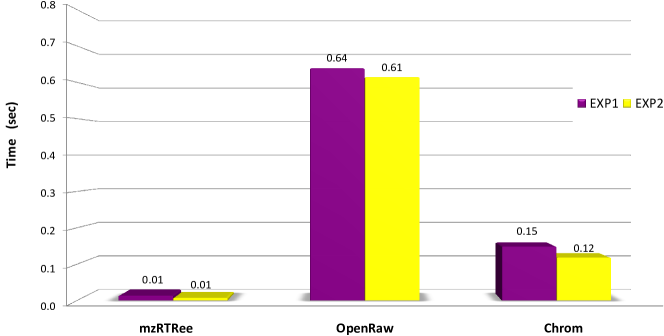
The load time required by the three data structures is shown in Figure 4 for EXP1 and EXP2 datasets: we note that the load time is mainly independent of dataset features, and mzRTree still achieves the best performance. Since loading is required every time the data structures are invoked, it is convenient to perform many consecutive range queries in order to amortize its cost: the higher the load time, the more the range queries needed to amortize it.
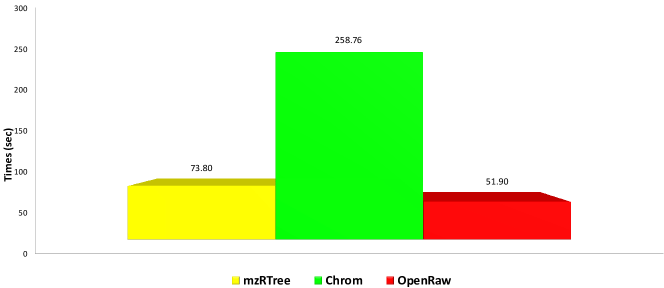
Even if the data structure creation takes place just once, we also estimated the creation time for mzRTree, Chrom and OpenRaw on EXP1. Notice that while mzRTree and Chrom creation starts from the mzXML file, the OpenRaw creation starts from the .RAW file, requiring the instrument vendor’s software to be licensed and installed on the computer. We chose EXP1 because its size is small enough to fit in RAM, thus all three data structures evenly work at their best condition. As shown in Figure 5, mzRTree features an efficient creation time, even if OpenRaw reaches the best performance. However, notice that OpenRaw is advantaged since it starts from binary data instead of Base64 encoded data.
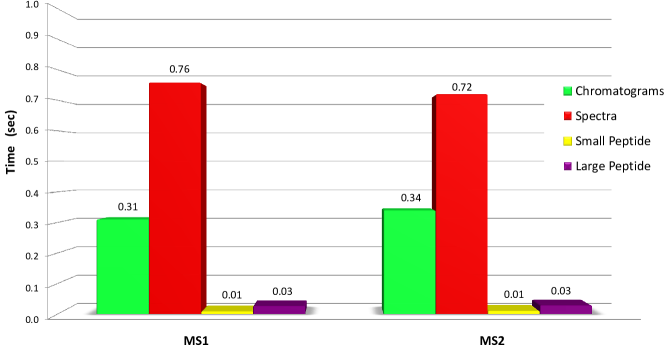
In Table 2 we provide the comparison of the space reduction using mzRTree, Chrom and OpenRaw compared to the mzXML hard disk space, which we chose as reference. mzRTree requires the smallest amount of space, hence it allows for cheaper storage and easier sharing of proteomics datasets. Besides, mzRTree storage requires at least less hard disk space than XML based data formats, since mzRTree stores binary data instead of Base64 encoded data: it is a considerable amount of space saved, when taking into account RAID systems and backup systems. Observe that, since, for the sake of simplicity, we are ignoring MS level-two spectra, the space savings for the first two datasets are notably larger than 30%; however, this is not the case of the third dataset, which consists only of level-one spectra. Anyway, mzRTree can efficiently handle also tandem data; the user only needs to create the data structure for every MS/MS level of interest. Figure 6 shows that mzRTree provides efficient access times on tandem MS data for all kind of range queries, attaining for MS level data the same performance as for MS level data.
| mzXML | EXP1 | EXP2 | ART4 |
|---|---|---|---|
| mzRTree | |||
| Chrom | |||
| OpenRaw |
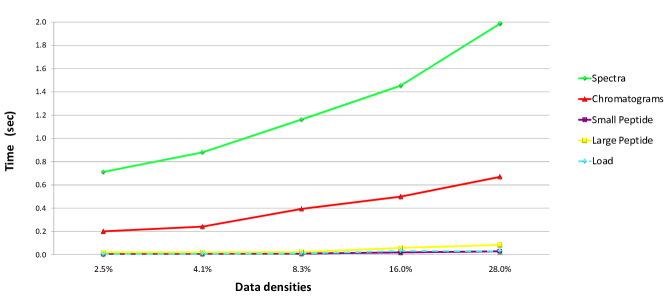
To test mzRTree scalability on increasing dataset densities and sizes we performed different range queries on the artificial datasets ART1, ART2, ART3, ART4 and ART5. Results are illustrated in Figure 7, which shows that mzRTree is fairly scalable as regards access and load time: as data density increases by a factor , the access time increases only by a factor in the worst case, while the load time is almost constant.
These results and the inherent scalability of the underlying R-tree structure suggest that mzRTree is suitable for high density/large size proteomics data, such as profile data, considered as the most informative and hence the most suitable to tackle quantification aims [7, 8]. At present, profile data size reaches some GB, but it is expected to further increase, as far as instrument accuracy and resolution increase: even a narrow range of values can be challenging to manage when analyzing these data. Thus, the adoption of mzRTree for data storage could make profile data accessible for analysis purposes: it prevents out-of-memory errors, often occurring with huge profile proteomics datasets, and reduces the need for (and the costs of) extraordinary computational infrastructures and their management. Actually, profile data are often the only data source rich enough to carry on a meaningful analysis, e.g., in quantitative proteomics based on stable isotope labelling. However, costs involved with profile data handling often outweigh their benefits. mzRTree could revert this relationship.
4 Conclusions
In this paper we proposed mzRTree, a scalable and memory efficient spatial structure for storing and accessing LC-MS data, which features efficient construction time and faster range query performance, compared to other known and widely used data structures.
Several research questions remain open. The efficiency of mzRTree depends on several design choices, including the degree of the internal nodes and the way the bounding boxes are mapped to the leaves of the tree. The design space for mzRTree should be fully explored in order to identify the best choices. Moreover, when dealing with huge raw datasets mzRTree may not fit in RAM. In that case, the tree must reside on hard disk and the size of the internal nodes should be adapted to match the minimum block size used in disk-RAM data movements. Other solutions based on indexing structures alternative to the R-tree employed by mzRTree (e.g., those surveyed in [13], including the kd-tree used in [11]) should be considered and compared to mzRTree. Finally, it is interesting and potentially useful to investigate effective ways to further integrate all additional information needed for regulatory submission into mzRTree.
5 Acknowledgements
A special thank to Juergen Hartler for providing us with the ICPL datasets and with code for Chrom, to Piero De Gol for his informatics support. We would like to thank also the anonymous referees for their useful comments, which helped us improving the presentation. This study was supported by funding of both the CARIPARO 2008/2010 “Systems biology approaches to infer gene regulation from gene and protein time series data” project and the University of Padova Strategic Project STPD08JA32 “Algorithms and Architectures for Computational Science and Engineering”.
References
- [1] R. Aebersold, M. Mann, Mass spectrometry-based proteomics., Nature 422 (6928) (2003) 198–207. doi:10.1038/nature01511.
- [2] S. Orchard, L. Montechi-Palazzi, E. W. Deutsch, P.-A. A. Binz, A. R. Jones, N. Paton, A. Pizarro, D. M. Creasy, J. Wojcik, H. Hermjakob, Five years of progress in the standardization of proteomics data 4th annual spring workshop of the HUPO-proteomics standards initiative, Proteomics 7 (19) (2007) 3436–3440. doi:10.1002/pmic.200700658.
- [3] C. F. Taylor, N. W. Paton, K. S. Lilley, P.-A. Binz, R. K. Julian, A. R. Jones, W. Zhu, R. Apweiler, R. Aebersold, E. W. Deutsch, M. J. Dunn, A. J. R. Heck, A. Leitner, M. Macht, M. Mann, L. Martens, T. A. Neubert, S. D. Patterson, P. Ping, S. L. Seymour, P. Souda, A. Tsugita, J. Vandekerckhove, T. M. Vondriska, J. P. Whitelegge, M. R. Wilkins, I. Xenarios, J. R. Yates, H. Hermjakob, The minimum information about a proteomics experiment (MIAPE), Nature Biotechnology 25 (8) (2007) 887–893. doi:10.1038/nbt1329.
- [4] The mzData standard, http://www.psidev.info/index.php?q=node/80#mzdata.
- [5] P. G. A. Pedrioli, J. K. Eng, R. Hubley, M. Vogelzang, E. W. Deutsch, B. Raught, B. Pratt, E. Nilsson, R. H. Angeletti, R. Apweiler, K. Cheung, C. E. Costello, H. Hermjakob, S. Huang, R. K. Julian, E. Kapp, M. E. McComb, S. G. Oliver, G. Omenn, N. W. Paton, R. Simpson, R. Smith, C. F. Taylor, W. Zhu, R. Aebersold, A common open representation of mass spectrometry data and its application to proteomics research, Nature Biotechnology 22 (11) (2004) 1459–1466. doi:10.1038/nbt1031.
- [6] E. Deutsch, mzML: A single, unifying data format for mass spectrometer output, Proteomics 8 (14) (2008) 2776–2777. doi:10.1002/pmic.200890049.
- [7] S. M. Lin, L. Zhu, A. Q. Winter, M. Sasinowski, W. A. Kibbe, What is mzXML good for?, Expert review of proteomics 2 (6) (2005) 839–845. doi:10.1586/14789450.2.6.839.
- [8] L. Martens, A. I. Nesvizhskii, H. Hermjakob, M. Adamski, G. S. Omenn, J. Vandekerckhove, K. Gevaert, Do we want our data raw? including binary mass spectrometry data in public proteomics data repositories., Proteomics 5 (13) (2005) 3501–3505. doi:10.1002/pmic.200401302.
- [9] J. Hartler, G. G. Thallinger, G. Stocker, A. Sturn, T. R. Burkard, E. Körner, R. Rader, A. Schmidt, K. Mechtler, Z. Trajanoski, MASPECTRAS: a platform for management and analysis of proteomics LC-MS/MS data., BMC bioinformatics 8 (2007) 197+. doi:10.1186/1471-2105-8-197.
- [10] K. C. Leptos, D. A. Sarracino, J. D. Jaffe, B. Krastins, G. M. Church, MapQuant: open-source software for large-scale protein quantification., Proteomics 6 (6) (2006) 1770–1782. doi:10.1002/pmic.200500201.
- [11] Z. Khan, J. S. Bloom, B. A. Garcia, M. Singh, L. Kruglyak, Protein quantification across hundreds of experimental conditions., Proceedings of the National Academy of Sciences of the United States of America 106 (37) (2009) 15544–15548. doi:10.1073/pnas.0904100106.
- [12] A. Guttman, R-trees: a dynamic index structure for spatial searching, Proceedings of the 1984 ACM SIGMOD international conference on Management of data 14 (2) (1984) 47–57. doi:10.1145/971697.602266.
- [13] J. S. Vitter, External memory algorithms and data structures: dealing with massive data, ACM Computing Surveys 33 (2) (2001) 209–271. doi:10.1145/384192.384193.
- [14] O. S. Trieglaff, N. Pfeifer, C. Gropl, O. Kohlbacher, K. Reinert, LC-MSsim - a simulation software for liquid chromatography mass spectrometry data, BMC Bioinformatics 9 (2008) 423+. doi:10.1186/1471-2105-9-423.