Isospin Constraints on the Parametric Coupling Model for Nuclear Matter
Abstract
We make use of isospin constraints to study the parametric coupling model and the properties of asymmetric nuclear matter. Besides the usual constraints for nuclear matter - effective nucleon mass and the incompressibility at saturation density - and the neutron star constraints - maximum mass and radius - we have studied the properties related with the symmetry energy. These properties have constrained to a small range the parameters of the model. We have applied our results to study the thermodynamic instabilities in the liquid-gas phase transition as well as the neutron star configurations.
I Introduction
The search for an effective nuclear matter theory has been one of the main goals of nuclear physics (see, for instance, the pioneering work of Fetter and Walecka Fetter_71 ). The advances in experimental data acquisition has played an essential role on the improvement of nuclear models. One of the most required parameters to constrain symmetric nuclear matter models, the incompressibility blaizot , has had many contributions since the non-linear Boguta and Bodmer model BB was proposed as an alternative to the Walecka model wal . The derivative coupling models proposed by Zimanyi and Moszkowski were also inspired to correct distortions in the incompressibility and effective nucleon mass determinations ZM .
In this work we make use of the so called parametric coupling model (PCM) taurines which describes nuclear matter with density dependent coupling constants. The PCM, presented in the next section has appeared in the literature after a first attempt to unify Walecka and ZM models in an unique model delfino . The PCM was successful in reproducing the results obtained in the Walecka wal , ZM ZM and exponential coupling models koepf and even more successful in reproducing nuclear matter and neutron star main properties using special choices for the free parameters that define the density dependence of the coupling constants. The PCM has been used to study a wide range of problems, specially the nuclear matter compression modulus veronica , the inclusion of strange meson fields razeira and the hadron-quark phase transition marranghello ; grohmann .
Presently, an important issue in nuclear physics is to constrain the nuclear matter equation of state (EOS) from compact star properties or from laboratory measurements such as the ones planned for the next-generation of exotic radioactive beam facilities at CSR/China, FAIR/Germany, RIKEN/Japan, SPIRAL2(GANIL)/France or the planned Facility of Rare Isotope Beams/USA, where the high density behavior of the symmetry energy will be further studied experimentally. While saturation properties of symmetric nuclear matter such as the saturation density, binding energy and incompressibility are quite well settled, properties of asymmetric nuclear matter, such as the density dependence of the symmetry energy are much less constrained.
Many authors have recently tested nuclear models, both phenomenological brown00 ; typel01 ; horo01 ; chen05 ; stei05 ; li08 ; cente09 ; chen09 ; pieka09 ; danie09 ; JunXu_09 , variational stei05 or microscopic li08 ; isaac09 such as the Brueckner-Hartree-Fock formalism, in order to impose constraints or verify their compatibility with data coming from heavy ion collisions, giant monopole resonances or isobaric analog states. In particular, recent experimental constraints from isospin diffusion in heavy-ion collisions (HIC) give for the slope parameter of the symmetry energy the value L = 8825 MeV and for the isospin incompressibility coefficient MeV li08 ; chen05 . The latter is in agreement with the value of MeV predicted by the independent measurement of the isotopic dependence of the giant monopole resonance in Sn isotopes garg07 ; li07 and the value MeV obtained from the study of neutron skins cente09 . On the other hand isoscaling in HIC favors MeV shetty07 and nucleon emission ratios favor MeV famiano06 .
The main goal of the present work is to constrain even more the free parameters in the PCM by studying the symmetry energy and its density dependence through its slope and its second derivative with respect to the density. We try to establish some correlations between the symmetry energy and its density derivatives with quantities with astrophysical interest such as the crust-core crossing density, the density at muon and at strangeness onset, the maximum star mass, and the threshold star mass for direct Urca urca .
II Parametric Coupling Model
We first study the nuclear matter properties within the PCM. This model is based on the Walecka model wal . However, in order to correct the values of the effective nucleon mass and incompressibility of symmetric nuclear matter at saturation density, Taurines et. al. taurines have introduced parametric couplings. They are introduced in a similar way as Zimanyi and Moszkowski included the derivative couplings in their models. Here we briefly describe the model and the reader is addressed to Ref. taurines for further details. The PCM Lagrangian density reads
where
| (2) |
and
| (3) |
In the equations above, represents the baryon fields that can be summed over the whole baryon octet. The baryon fields are coupled to the meson fields , and . The electron and muon fields appear as and must be introduced for the description of stellar matter.
 |
 |
The parametric couplings restore the Walecka model for , the ZM1 model for and , the ZM3 model for and , and exponential coupling model for .
The and coupling constants are chosen to reproduce the binding energy MeV at the saturation density fm-3. We fix the isovector coupling constant, to fit the symmetry energy, MeV, at the same saturation density.
 |
We will work with four versions of the PCM: a) varying the scalar parameter with the vector parameter and isovector parameter (Model-S); b) varying the scalar and vector parameters while keeping the isovector parameter (Model-SV); c) varying all three parameters (Model-SVI) and d) varying the scalar and isovector parameters while keeping the vector parameter (Model-SI). We expect to verify the nuclear matter main properties dependence on the coupling constants. We will also consider the parametrization a) SI2 with , and b) SVI2 while, in both cases, we vary . These last two choices will allow us to explore the isovector degree of freedom while choosing reasonable properties for the isoscalar channel, namely for symmetric nuclear matter.
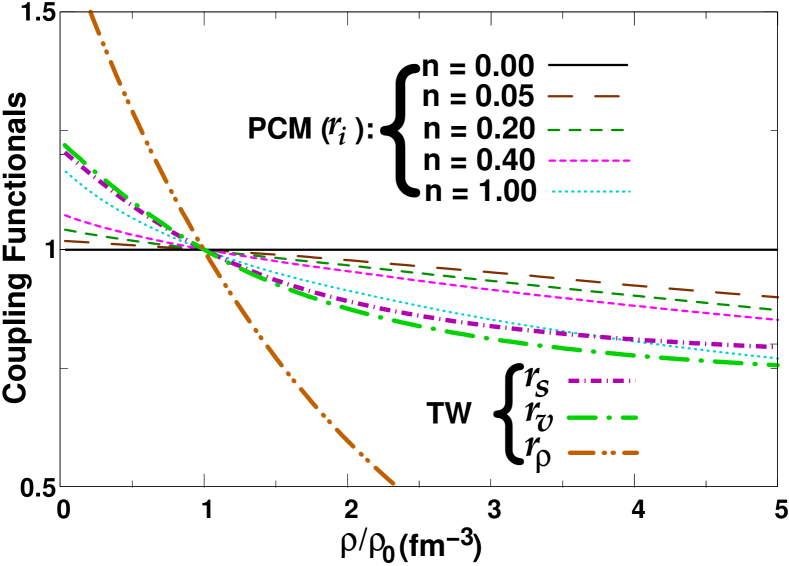
In Fig. 1, we represent the meson couplings , and , as a function of the parameter for all models. We plot the couplings for models S and SI in one figure and the ones of models SV and SVI in the other. Since the values of the and couplings are first chosen to reproduce symmetric nuclear matter data and only after this choice we establish the value of , the scalar and vector coupling constants are the same for the pairs of models S, SI and SV, SVI. These two couples of models differ only in the isovector channel. It is seen that for models S and SI the parameter has stabilized at a constant value for . For the models SV and SVI this occurs only for . The and parameters stabilize only for , however, saturation properties of symmetric nuclear matter restrict the accepted values to . In all four different versions of the model, has a stable result which essentially does not differ from and the changes from are very small. The density dependence of the coupling constants can be examined from Fig.2, where we have plotted .
The greater the value of the stronger the density dependence and the reduction of the effective coupling constant value at higher densities. In order to compare the results obtained with PCM, we have also plotted, in the same figure, the density dependence of the relative TW couplings tw . The behavior of is similar to the one obtained with PCM for . The same does not occur for which has a much faster decrease with density.
We have included hyperons in the present model for the high density EOS in the inner regions of a neutron star. Since the discussion of the hyperon coupling constants is not the aim of this work, we just fix the hyperon-meson coupling constants to . In order to study neutron stars we must also include the Baym-Pethick-Sutherland (BPS) EOS for densities below the neutron drip line BPS .
 |
III Symmetry Energy
 |
 |
 |
 |
In Tables 1-4 we give some of the properties of the models under study: the symmetry energy slope , the symmetry energy incompressibility , the symmetry term of the incompressibility of the nuclear EOS , where , the effective nucleon mass , the onset density of strangeness , the onset density of muons , the threshold density for the direct Urca process and the mass of a star with central density equal to , , the mass and radius of the stable star configuration with maximum mass.
The slope is within the experimental constraints 55 MeV MeV for all parametrizations considered. In the S and SV models the slope has a quite large value, though never below 95 MeV. The variation of L as the free parameter increases is shown in Fig.3. It is seen that decreases with the increase of , starting at MeV and stabilizing at MeV for S and SV models, at MeV for the SI model, and at MeV for SVI.
A value of in the interval [-400, -675] MeV puts very strong restrictions. According to some authors pieka09 ; piek07 ; sagawa07 however, it is difficult to determine the experimental value of accurately which may suffer from the same ambiguities already encountered in earlier attempts to extract the incompressibility coefficient of infinite nuclear matter from finite-nuclei extrapolations. We, therefore, do not rule out models with values of larger than -400 MeV. In fact, in isaac09 the properties of several relativistic and Skyrme models which reproduce the ground state properties of stable and unstable nuclei or the properties of nuclear or neutron matter have been compared and it was shown that a large number of models have MeV.
| K | R | ||||||||||||
|---|---|---|---|---|---|---|---|---|---|---|---|---|---|
| (MeV) | (MeV) | (MeV) | (MeV) | (MeV) | () | () | (km) | ||||||
| 0.00 | 111.42 | 105.67 | 566 | -970 | -2068.27 | 0.537 | 0.1025 | 0.244 | 0.109 | 0.194 | 0.77 | 2.58 | 12.61 |
| 0.05 | 101.35 | 35.74 | 310 | -601 | -87.60 | 0.650 | 0.0969 | 0.282 | 0.109 | 0.210 | 0.71 | 2.11 | 10.68 |
| 0.10 | 98.22 | 13.39 | 224 | -490 | 195.97 | 0.737 | 0.0952 | 0.309 | 0.110 | 0.221 | 0.68 | 1.79 | 9.50 |
| 0.20 | 96.60 | 2.55 | 212 | -336 | 529.01 | 0.798 | 0.0950 | 0.330 | 0.111 | 0.229 | 0.68 | 1.54 | 9.31 |
| 0.40 | 95.92 | -2.15 | 218 | -312 | 603.79 | 0.833 | 0.0951 | 0.339 | 0.111 | 0.234 | 0.68 | 1.48 | 9.58 |
| 1.00 | 95.57 | -3.95 | 224 | -310 | 626.67 | 0.850 | 0.0951 | 0.345 | 0.112 | 0.236 | 0.68 | 1.49 | 9.91 |
| K | R | ||||||||||||
|---|---|---|---|---|---|---|---|---|---|---|---|---|---|
| (MeV) | (MeV) | (MeV) | (MeV) | (MeV) | () | () | (km) | ||||||
| 0.00 | 111.42 | 105.67 | 566 | -970 | -2068.27 | 0.537 | 0.1025 | 0.244 | 0.109 | 0.194 | 0.77 | 2.58 | 12.61 |
| 0.05 | 90.00 | 1.05 | 310 | -564 | -86.28 | 0.650 | 0.0970 | 0.284 | 0.107 | 0.213 | 0.69 | 2.11 | 10.69 |
| 0.10 | 82.34 | -38.77 | 224 | -402 | 355.86 | 0.737 | 0.0954 | 0.314 | 0.107 | 0.229 | 0.65 | 1.80 | 9.50 |
| 0.20 | 77.90 | -64.01 | 212 | -340 | 520.91 | 0.798 | 0.0952 | 0.339 | 0.107 | 0.248 | 0.65 | 1.55 | 9.26 |
| 0.40 | 76.25 | -74.09 | 218 | -323 | 596.36 | 0.833 | 0.0952 | 0.354 | 0.106 | 0.264 | 0.67 | 1.48 | 9.44 |
| 1.00 | 75.78 | -78.79 | 224 | -322 | 625.09 | 0.850 | 0.0954 | 0.366 | 0.106 | 0.278 | 0.69 | 1.49 | 9.53 |
| K | R | ||||||||||||
|---|---|---|---|---|---|---|---|---|---|---|---|---|---|
| (MeV) | (MeV) | (MeV) | (MeV) | (MeV) | () | () | (km) | ||||||
| 0.00 | 111.42 | 105.67 | 566 | -970 | -2068.27 | 0.537 | 0.1025 | 0.244 | 0.109 | 0.194 | 0.77 | 2.58 | 12.61 |
| 0.05 | 108.29 | 83.26 | 458 | -848 | -1190.65 | 0.554 | 0.0938 | 0.254 | 0.108 | 0.197 | 0.77 | 2.42 | 11.96 |
| 0.10 | 105.84 | 63.78 | 360 | -751 | -611.36 | 0.570 | 0.0861 | 0.263 | 0.108 | 0.199 | 0.73 | 2.26 | 11.31 |
| 0.20 | 102.40 | 36.71 | 276 | -560 | 47.68 | 0.600 | 0.0793 | 0.281 | 0.108 | 0.204 | 0.69 | 1.96 | 10.06 |
| 0.40 | 99.00 | 12.42 | 195 | -336 | 483.72 | 0.649 | 0.0727 | 0.310 | 0.108 | 0.212 | 0.63 | 1.39 | 8.70 |
| 1.00 | 96.66 | -1.99 | 159 | -165 | 685.86 | 0.710 | 0.0699 | 0.342 | 0.109 | 0.221 | 0.62 | 0.83 | 9.00 |
| K | R | ||||||||||||
|---|---|---|---|---|---|---|---|---|---|---|---|---|---|
| (MeV) | (MeV) | (MeV) | (MeV) | (MeV) | () | () | (km) | ||||||
| 0.00 | 111.42 | 105.67 | 566 | -970 | -2068.27 | 0.537 | 0.1025 | 0.244 | 0.109 | 0.194 | 0.77 | 2.58 | 12.61 |
| 0.05 | 98.18 | 45.03 | 458 | -562 | -83.73 | 0.554 | 0.0940 | 0.254 | 0.106 | 0.198 | 0.75 | 2.42 | 11.96 |
| 0.10 | 88.05 | -0.74 | 360 | -443 | 351.78 | 0.570 | 0.0863 | 0.265 | 0.105 | 0.203 | 0.68 | 2.26 | 11.31 |
| 0.20 | 74.84 | -57.56 | 276 | -364 | 525.89 | 0.600 | 0.0795 | 0.286 | 0.102 | 0.214 | 0.64 | 1.97 | 10.07 |
| 0.40 | 64.58 | -98.07 | 195 | -286 | 602.54 | 0.649 | 0.0731 | 0.323 | 0.100 | 0.239 | 0.59 | 1.40 | 8.65 |
| 1.00 | 61.13 | -104.91 | 159 | -231 | 626.04 | 0.710 | 0.0704 | 0.374 | 0.098 | 0.293 | 0.57 | 0.66 | 8.67 |
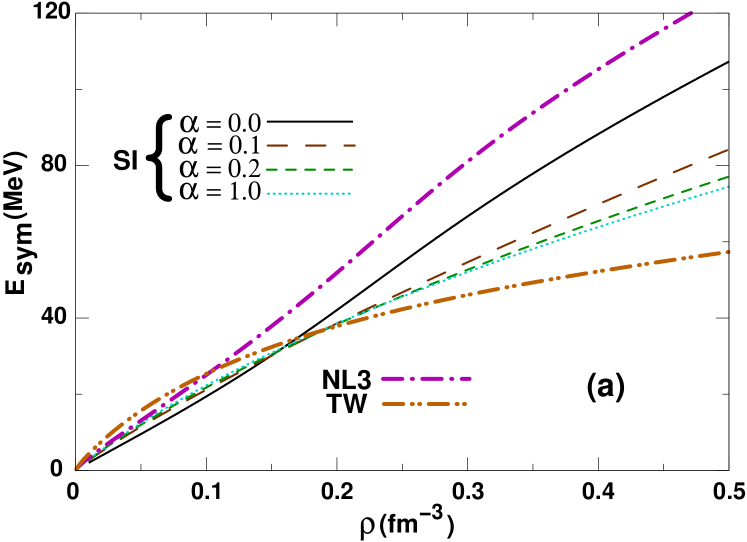
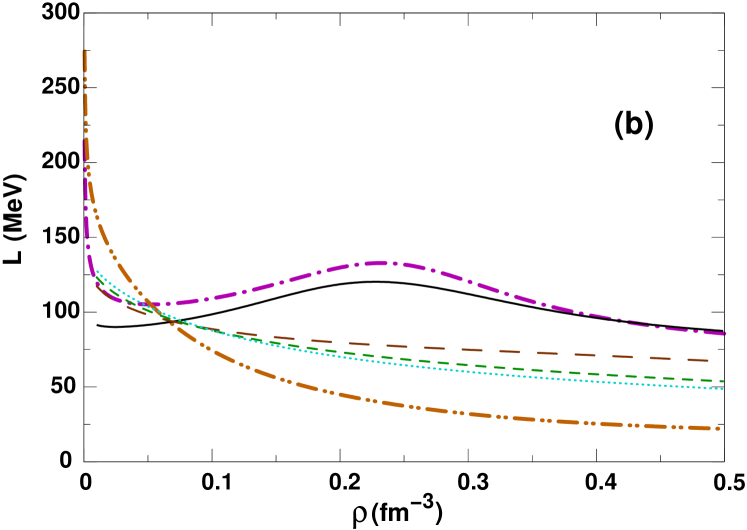
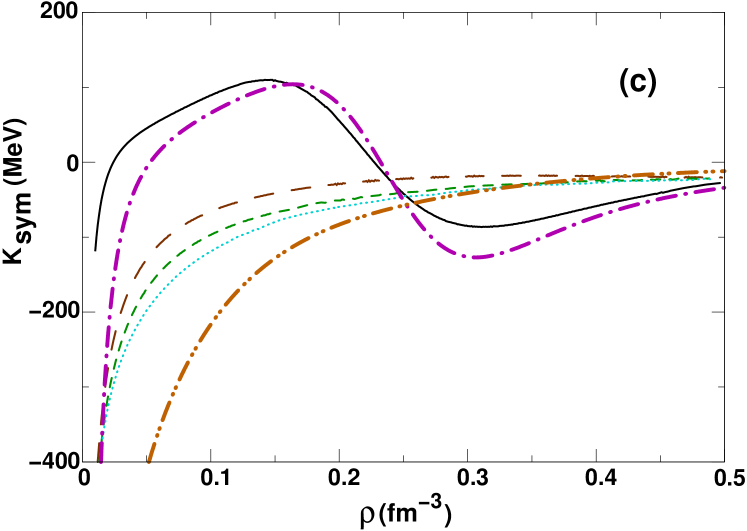
For reference, in Fig. 4 we plot for the different parametrizations considered the symmetry energy (a), its slope (b) and the incompressibility (c), for model SI. We also include the corresponding curves obtained with the non-linear Walecka model parametrization NL3 nl3 and density dependent relativistic hadronic model TW tw . Varying and between 0 and 1, we go from the hard symmetry energy behavior of NL3 to the soft TW behavior. Similar conclusions are taken for the slope and the incompressibility: as we increase the behavior of our parametric model changes from a NL3-like to a TW-like behavior.
 |
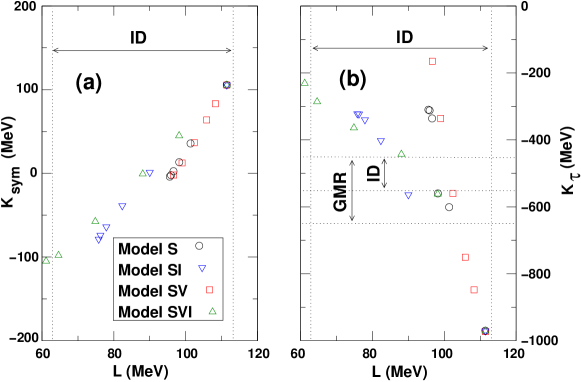
In order to compare the predictions of the different parametrizations under study and the experimental constraints on and we plot for all the models and versus the slope in Fig. 5. It is seen and show a linear correlation with as also discussed in isaac09 . We have checked that in fact this correlation also exists for the ratio which enters the definition of . We include the constraints obtained from isospin diffusion (ID) in heavy-ion collisions chen05 ; li08 , isotopic behavior of the giant monopole resonance (GMR) in Sn isotopes garg07 ; li07 and neutron skin studies (NS) cente09 . The models which better satisfy the constraints are: S and SI, with and SVI, with . Model SV only presents values with good agreement with and for . So far we have considered the S, SV, SI and SVI versions of the PCM in which two, one or none of the parameters has been set to zero, while the remaining ones have been set equal. In the next sections we still keep this analysis to impose some constraints on the parameter choice, using neutron stars observations. We finally vary the parameters independently and choose two sets which give excellent values not only for and but also for and neutron star maximum masses.
IV Thermodynamical Instabilities
The system is unstable against phase separation keeping volume and temperature constant, if the free energy curvature matrix
| (4) |
is negative chomaz03 . Stability implies that the free energy density is a convex function of the densities and . In the present section, we define the free energy with no leptons or hyperons.
Since we are interested in studying the spinodal curve of the two-fluid nuclear system, it is enough to evaluate the zero of the smallest eigenvalue of , where
and where the relevant eigenvectors are
with chomaz03 ; Avancini-06 .
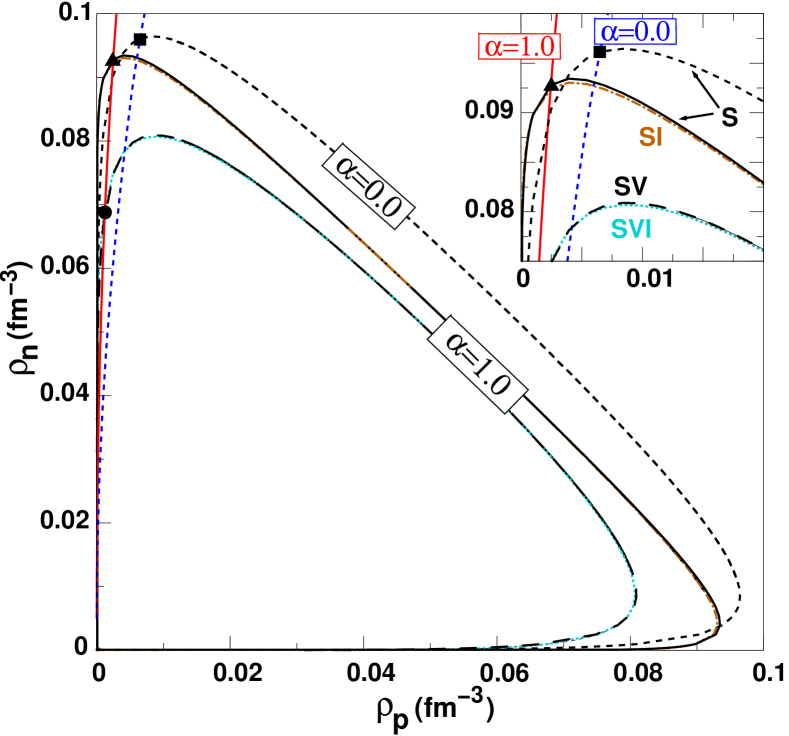
The thermodynamic spinodal, defined by the condition determines the instability regions of the system and is plotted in Fig. 6 for the models under discussion. We point out that, for symmetric matter, all the models have the same density, binding energy and symmetry energy at saturation but different incompressibilities and effective nucleon masses. The model with the largest incompressibility (S, ) has the largest spinodal and the ones with the smallest incompressibility (SV and SVI, ) have the smallest spinodal. The point of the spinodal with corresponds to the minimum of the pressure of symmetric nuclear matter, when the incompressibility is zero. Since we impose that the pressure is zero for all models at the same density, the saturation density is 0.16 fm-3, the incompressibility of the models with a larger curvature will become zero at a larger density. We notice that the effect of the parameter is very small and only seen for very asymmetric matter, when it slightly reduces the spinodal.
In Fig. 6 we also plot the -equilibrium EOS for and for model SVI with . The crossing of the -equilibrium EOS with the thermodynamical spinodal instability line gives a prediction for the transition density approximately 15% larger than the value obtained from a Thomas-Fermi calculation of the pasta phase pasta . Therefore, we determine the crust-core transition density from the crossing between the EOS and the spinodal and expect that our estimation of the transition density will define an upper bound of the correct transition density pethick95 between the crust and the core of a neutron star. It is seen that quite different predictions are obtained within PCM for the transition density both because the spinodals have a different behavior for neutron rich matter and the EOS for -equilibrium stellar matter also differ when varying from 0 to 1. Even if the EOS do not differ considerably for different parameters, the values of the density and isospin asymmetries at the crossing of the EOS with the spinodal are found to be quite different, though always with low proton densities. In Fig. 6 we only plot the EOS for and for SVI. We have obtained for the transition densities: fm-3 (), fm-3 (models S and SI with ) and fm-3 (models SV and SVI with ). The values of given in Tables 14 show a decrease of with the decrease of the slope , contrary to the results of isaac09 . However, we have to take these values with care because we are not only varying the slope but also the incompressibility while imposing the same saturation density for all models. As a consequence, the extension of the spinodal region grows with and it is this correlation that is reflected in the data of Tables 1-4. In the next section we calculate the transition density for a selected set of parameters and then we will be able to obtain a correlation between and similar to the one obtained in isaac09 .
V Neutron Star Constraints
 |
 |
Besides heavy ion experiments, we can make use of astrophysical observations of neutron stars to stablish some constraints on the PCM and its free parameters. We therefore obtain the EOS of -equilibrium matter, including the presence of hyperons, and integrate the Tolman-Oppenheimer-Volkoff equation for a spherical compact star in hydrostatic equilibrium TOV1 ; TOV2 in order to obtain the family of stars which correspond to each parametrization considered.
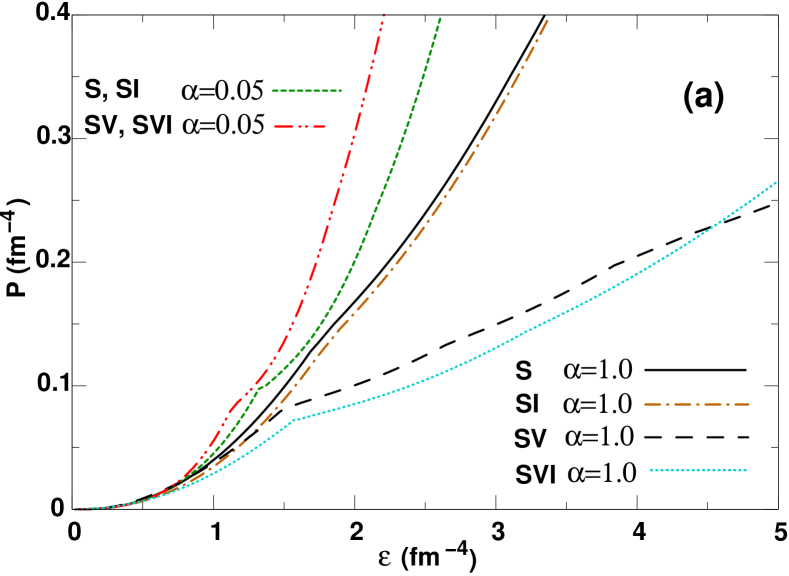
The different EOS are shown in Fig.7a) for all four versions of the model, considering the limiting values and . The results for values of are intermediate and lie between the two curves. The kink on each curve corresponds to the onset of strangeness. For the incompressibility is 310 MeV for S and SI models and 458 MeV for SV and SVI. The last EOS is the hardest one and therefore, the onset of hyperons occurs at smaller densities for this model. The hyperons make the EOS softer but never softer than any of the other versions (with higher values of ) of the model.
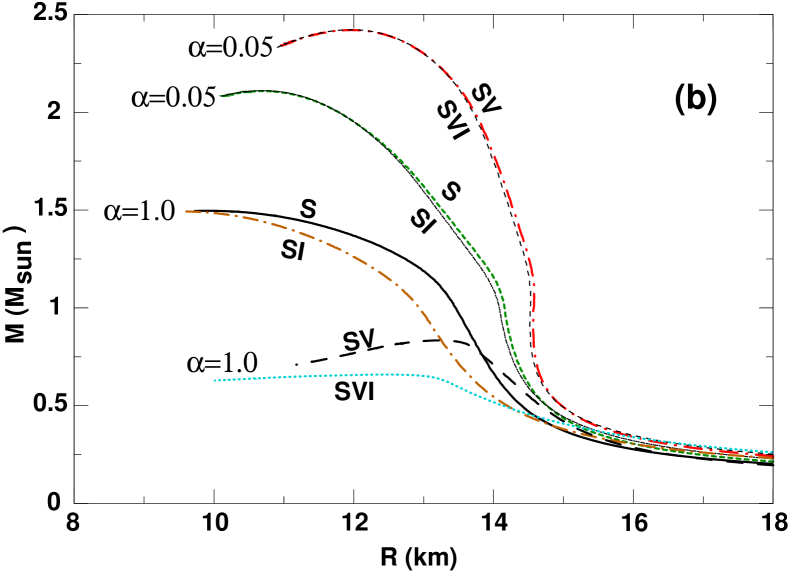
The corresponding neutron star families (mass-radius) are shown in Fig.7b). As expected, one can see that all models with low values of have maximum neutron star masses above 2, while the results drastically change when values of approach the unit, reducing the maximum neutron star mass obtained with the S and SI models to values close to 1.5. The results get even smaller when SV and SVI model are considered, reducing the maximum neutron star mass to values below 1.
One can stablish the minimum value required for the maximum neutron star mass from observations. From Tables 1-4 we see that, for the S and SI models, which present almost the same neutron star masses, allow neutron star masses greater the 1.8, while the models SV and SVI have a wider range of values () that yield the same star mass.
According to klan06 , observations on cooling predict that direct Urca should occur only in stars with a mass . We have determined the star with maximum mass that does not allow the direct Urca process () for the different parametrizations of the model proposed. By we denote the baryonic density that defines the onset of the Urca process. The results are summarized in Tables 1-4. No model satisfies the condition . All four versions of the model predict the Urca process with densities 0.194 fm which correspond to neutron stars masses around . This result is expected as PCM presents the same main features as the models discussed in klan06 which are not in agreement with Urca expectations. The threshold density for the direct Urca process is plotted versus the slope in Fig. 8. It is seen that it strongly depends on the slope of the symmetry energy: a smaller slope corresponds to a larger density of the Urca onset.
| R | |||||||||||||
|---|---|---|---|---|---|---|---|---|---|---|---|---|---|
| (MeV) | (MeV) | (MeV) | (MeV) | (MeV) | (fm-3) | (fm-3) | (fm-3) | (fm-3) | (M⊙) | (M⊙) | (Km) | ||
| 0.450 | 0.749 | 224 | 60 | -123.5 | -585 | -378.93 | 0.0894 | 0.305 | 0.107 | 0.253 | 0.68 | 1.811 | 9.512 |
| 0.240 | 0.749 | 224 | 70 | -87.7 | -587 | -253.76 | 0.0874 | 0.305 | 0.107 | 0.240 | 0.67 | 1.806 | 9.510 |
| 0.120 | 0.749 | 224 | 80 | -46.3 | -583 | -158.76 | 0.0865 | 0.305 | 0.107 | 0.231 | 0.66 | 1.803 | 9.511 |
| R | |||||||||||||
|---|---|---|---|---|---|---|---|---|---|---|---|---|---|
| (MeV) | (MeV) | (MeV) | (MeV) | (MeV) | (fm-3) | (fm-3) | (fm-3) | (fm-3) | (M⊙) | (M⊙) | (Km) | ||
| 0.310 | 0.60 | 276 | 60 | -82.2 | -517 | -344.08 | 0.0884 | 0.286 | 0.102 | 0.218 | 0.65 | 1.971 | 10.072 |
| 0.210 | 0.60 | 276 | 70 | -57.3 | -539 | -243.27 | 0.0877 | 0.286 | 0.102 | 0.214 | 0.64 | 1.968 | 10.077 |
| 0.125 | 0.60 | 276 | 80 | -28.5 | -547 | -132.82 | 0.0868 | 0.286 | 0.102 | 0.210 | 0.63 | 1.966 | 10.069 |
 |
 |
We expect to be able to infer isospin asymmetry properties or stablish a few constraints on the parametrizations from neutron star observations. When comparing S and SI models or SV and SVI models, which present the same global behavior, we have identified a small difference in the neutron star radii that becomes larger as increases. For the S and SI models the difference between the radii reaches =380 m, for while it reaches =330 m for SV and SVI model. This difference would correspond, for example, to a difference of 0.1 kHz () in the fundamental mode of a star benhar ; araujo and is larger if we consider stars with masses below the maximum allowed mass.
In Fig.9 several properties of the neutron star structure are plotted as a function of the symmetry energy slope for the models S, SV, SI and SVI. The figure shows the baryonic densities at the onset of hyperons for each model. Hyperons are very important because their appearance results in the softening of the EOS and the lowering of the neutron star maximum mass. In the same figure, it is also represented the baryonic density at the muon onset and the density at which the proton fraction reaches the value which allows the direct Urca process to occur in neutron stars (for details see Ref.urca ; klan06 ). While the muon onset is not very sensitive to the value of , the hyperon onset may vary 40-50%, and the densities for the onset of Urca, 20-50% between the limits of the plotted values of which are all within the experimental constrained values.
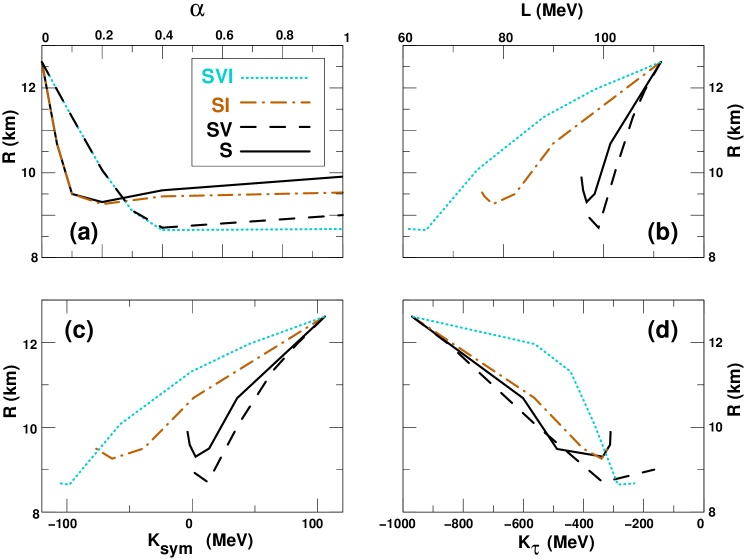
In Fig.10 we analyse the dependence of the maximum mass neutron star radius on and the asymmetry parameters , and . It is shown that there is a correlation which may help to impose restrictions on the parameters: smaller values of , and give larger radius for the maximum mass configuration.
We propose to use the new parametrizations SI2 and SVI2 because models S, SI, SV and SVI with reasonable incompressibilities predict too small maximum star masses. With a fixed and/or parameter, and changing the parameter we have changed the symmetry energy slope. Tables 5 and 6 show the properties of the EOS and neutron stars for these new parametrizations. The maximum star masses have improved and are of the order 1.8 while the properties of symmetric nuclear matter are all reasonable. However the density for Urca onset is still too small in all models and the radius of the maximum mass configuration is also quite small. We have tried to vary all the parameters independently of each other but we were not able to find a parametrization which predicts larger densities for the onset of the Urca process than the ones already obtained. This seems to be a weak point of these models. We made also an estimation of the crust-core transition densities by calculating the crossing of the -equilibrium EOS with the thermodynamical spinodal as explained in section IV. The results are given in Tables 5 and 6 and vary between 0.086 and 0.089 fm-3 showing a small decrease when the slope of the symmetry energy increases.
We next compare our results with two RMF models: NL3 with constant couplings and TW with density dependent coupling parameters (Table 7). We have obtained for the models SI2 and SVI2 better values for the slope of the symmetry energy, well within the experimental range, than NL3 and TW give. For these two models the slope of the symmetry energy corresponds, respectively, to the upper and lower limit of proposed from the experimental values. We have also obtained results for closer to the experimental ones than those found within NL3 and TW, keeping good results for the compression modulus, effective nucleon mass and neutron star global properties. PCM introduces a density dependence on the coupling parameters weaker than the one of TW (see Fig. 2), mainly for the isospin channel. The parametrization of the coupling parameters within PCM does not allow for such a strong density dependence for the coupling parameters as TW shows. For the crust-core transition density the models SI2 and SVI2 preview a density similar to the one obtained with TW. Concerning the correlation between and , models SI2 and SVI2 behave like those in Ref.isaac09 , decreasing the value of as increases. The density for the strangeness onset is closely related with the incompressibility of the EOS: SI2 is very soft and predicts the largest density for the strangeness onset, SVI2 gives a result very similar to TW, larger than NL3. Other properties of SI2 and SVI2 are also closer to TW than to NL3 except for the the onset density for the Urca process and the mass of the compact star with this density at the centre: it is seen that for other similar saturation properties, the value of for TW seems to be the only great difference.
| Model | R | ||||||||||||||
|---|---|---|---|---|---|---|---|---|---|---|---|---|---|---|---|
| (MeV) | (fm-3) | (MeV) | (MeV) | (MeV) | (MeV) | (MeV) | (fm-3) | (fm-3) | (fm-3) | (fm-3) | (M⊙) | (M⊙) | (Km) | ||
| TW | 16.3 | 0.153 | 240.1 | 0.56 | 32.0 | 55.3 | -124.7 | -332.1 | 0.085 | 0.287 | 0.115 | 0.315 | 1.46 | 2.012 | 11.60 |
| NL3 | 16.3 | 0.148 | 270 | 0.60 | 37.4 | 118.5 | 100.9 | -698.4 | 0.065 | 0.217 | 0.111 | 0.205 | 1.00 | 1.707 | 12.65 |
 |
VI Conclusions
We have employed the parametric coupling model, developed by Taurines et. al. taurines , to describe nuclear matter properties, in special, those related to the isospin channel which were still not investigated in the PCM model. Some of the parameters of the model were fixed by the binding energy (15.75 MeV) and saturation density (0.16 fm-3) for symmetric matter and by the symmetry energy (32.5 MeV). We have tried to restrict the remaining parameters by reproducing experimental results obtained with heavy ion collisions at intermediate energies and neutron star properties.
Considering a wide range of experimental data for the slope of the symmetry energy , 55 MeV MeV and for the symmetry term of the incompressibility of the nuclear EOS , MeV MeV, we have ruled out some values of the free parameters. The models which best satisfy the constraints are: S and SI, with and SVI, with . Model SV only presents values with good agreement with the and experimental values for .
Some properties of neutron star matter and neutron star structure have been described with the PCM for the range of the parameters restricted by the values of and , namely the maximum mass star configuration, and the densities of the onset of muons, strangeness and the direct Urca process. It was shown that all properties were reasonably well described except the prediction of the direct Urca process at a too low density. It was also shown that the density at the onset of muons is almost independent of the parameters of the model but the strangeness onset is sensitive to the symmetry energy slope: a larger slope corresponds to a smaller onset density. The same is true for the direct Urca process, although with a slightly weaker dependence. It was also shown that the radius and mass of the maximum mass stable star configuration was correlated with the value: a larger corresponds to a larger radius and a larger mass. A similar correlation exists with the symmetry term of the incompressibility of nuclear matter. However from model to model this correlation has a different slope and a given value of and does not define in a unique way the neutron star properties.
Even though the proposed range of validity of the parameters of the PCM are in agreement with the experimental range described above for heavy ions, it is of common belief that the slope of symmetry energy should be close to the lower limit of the interval 55 MeV MeV cente09 . In order to investigate other possibilities of the model, we have proposed new parametrizations chosen to reproduce the symmetry energy slope =60, 70 and 80 MeV. These parametrizations have shown excellent results also for , , and the neutron star maximum mass but still predict quite low densities for the onset of the Urca process. The results shown in tables 5 and 6 describe some of these results. We have tried to find a set of parameters which could predict a larger density for the onset of the direct Urca process without success. The PCM present the same main features of the models discussed in klan06 which are not in agreement with Urca expectations.
We have constrained the free parameters of the PCM using the properties of asymmetric nuclear matter, but it is important to mention that the EoS which show the best results (tables V and VI), for these properties are in perfect agreement with those imposed by the analysis of symmetric nuclear matter properties such as those described by dan02 where constraints, obtained from the analysis of nuclear matter flow in heavy ion collisions, were proposed for the high density EoS of symmetric matter. This problem has been recently examined in Ref.tobepub . It is also important to mention that the constraints imposed by asymmetric nuclear matter properties are stronger than the ones obtained from symmetric nuclear matter (for details see Ref.tobepub ).
We have compared our results with two RMF models: NL3 with constant couplings and TW with density dependent coupling parameters (Table 7). It was shown that the models SI2 and SVI2 predict results closer to TW except for the onset density of the Urca process. These could be related to the larger value that TW has since all the other saturation properties are similar. It was also shown that while the density dependence of the and coupling parameters in PCM is similar to the one of TW, the density dependence of is very different.
The relation between the symmetry energy and some properties of neutron stars was also discussed. The different models considered in the present study with one or more density dependent couplings, showed quite large differences among them, even for the same values of and . We conclude that the properties of nuclear matter for both symmetric and asymmetric matter at saturation are not enough to define the structure of compact stars and experimental data at two, three times saturation density are required.
VII ACKNOWLEDGMENTS
This work was partially supported by FEDER and FCT under the projects PTDC/FP/64707/2006 and CERN/FP/83505/2008, and SFRH/BPD/29057/2006 and by COMPSTAR, an ESF Research Networking Programme.
References
- (1) A. L. Fetter, and J. D. Walecka, Quantum Theory of Many-Particle Systems (McGraw-Hill, New York, 1971).
- (2) J. P. Blaizot, Phys. Rep. 64, 171 (1980).
- (3) J. Boguta, A. R. Bodmer Nucl.Phys. A292, 413 (1977).
- (4) J. D. Walecka, Annal. Phys. 83, 491 (1974).
- (5) J. Zimanyi and a S. A. Moszkowski Phys.Rev. C42, 1416 (1990).
- (6) A.R. Taurines, C.A.Z. Vasconcellos, M. Malheiro, M. Chiapparini, Phys.Rev. C63 (2001) 065801.
- (7) A. Delfino, M. Chiapparini, M. Malheiro, L Belvedere, A. Gattone, Z. Phys. A355 145 (1996).
- (8) W. Koepf, M. M. Sharma, P. Ring, Nucl. Phys. A533 95 (1992).
- (9) V. A. Dexheimer, C. A. Z. Vasconcellos and B. E. J. Bodmann, Phys. Rev. C77 065803 (2008).
- (10) M. Razeira et. al., Int. J. Mod. Phys. E16, 2855 (2007).
- (11) G. F. Marranghello, M. Razeira, B. E. J. Bodmann and J. C. N. de Araujo,Int. J. Mod. Phys. E16 2847 (2007).
- (12) M. Grohmann et. al., Int. J. Mod. Phys. E16 2838 (2007).
- (13) B. A. Brown, Phys. Rev. Lett. 85, 5296 (2000).
- (14) S. Typel and B. A. Brown, Phys. Rev. C 64, 027302 (2001).
- (15) C. J. Horowitz and J. Piekarewicz, Phys. Rev. Lett. 86, 5647 (2001).
- (16) L. W. Chen, C. M. Ko and B. A. Li, Phys. Rev. Lett. 94, 032701 (2005); Phys. Rev. C 72, 064309 (2005).
- (17) A. W. Steiner, M. Prakash, J. Lattimer and P. J. Ellis, Phys. Rep. 410, 325 (2005).
- (18) B. A. Li, L. W. Chen, and C. M. Ko, Phys. Rep. 464, 113 (2008).
- (19) M. Centelles, X. Roca-Maza, X. Viñas and M. Warda, Phys. Rev. Lett. 102, 122502 (2009).
- (20) P. Danielewicz and J. Lee, Nucl. Phys. A818, 36 (2009).
- (21) L. W. Chen, B. J. Cai, C. M. Ko, B. A. Li, C. Shen and J. Xu, arXiv:0905.4323.
- (22) J. Piekarewicz and M. Centelles, Phys. Rev. C 79, 054311 (2009).
- (23) J. Xu, L. W. Chen, B. A. Li, and H. R. Ma, Phys. Rev. C 79, 035802 (2009).
- (24) Isaac Vidaña, Constança Providência, Artur Polls and Arnau Rios, Phys. Rev. C 80, 045806 (2009).
- (25) U. Garg et al., Nucl. Phys. 788, 36 (2007).
- (26) T. Li et al., Phys. Rev. Lett. 99, 162503 (2007).
- (27) D. V. Shetty, S. J. Yennello, and G. A. Souliotis, Phys. Rev. C 76, 024606 (2007).
- (28) M. A. Famiano et al, Phys. Rev. Lett. 97, 052701 (2006).
- (29) J. M. Lattimer, C. J. Pethick, M. Prakash, and P. Haensel, Phys. Rev. Lett. 66, 2701 (1991).
- (30) S. Typel and H. H. Wolter, Nucl. Phys. A656, 331 (1999).
- (31) G. Baym, C. Pethick, P. Sutherland Astrophys.J. 170 299 (1971).
- (32) J. Piekarewicz, Phys. Rev. C 76, 031301(R) (2007).
- (33) H. Sagawa, S. Yoshida, G. M. Zeng, J. Z. Gu and X. Z. Zhang, Phys. Rev. C 76, 034327 (2007).
- (34) G. A. Lalazissis, J. König and P. Ring, Phys. Rev. C 55, 540 (1997).
- (35) J. Margueron and P. Chomaz, Phys. Rev. C 67, 041602(R) (2003).
- (36) S. S. Avancini, L. Brito, Ph. Chomaz, D. P. Menezes, and C. Providência, Phys. Rev. C 74, 024317 (2006).
- (37) S.S. Avancini, L. P. Brito, J.R. Marinelli, D.P. Menezes, M.M.W. Moraes, C. Providência and e A. M. Santos, Phys. Rev. C 79, 035804 (2009).
- (38) C. J. Pethick, D. G. Ravenhall and C. P. Lorenz, Nucl. Phys. A 584, 675 (1995);
- (39) J.R. Oppenheimer, G.M. Volkoff, Phys.Rev. 55, 374 (1939).
- (40) R. C. Tolman Phys.Rev. 55, 364 (1939).
- (41) T. Klähn et. al., Phys. Rev C 74, 035802 (2006).
- (42) O. Benhar, V. Ferrari, L. Gualtieri, Phys.Rev. D70, 124015 (2004).
- (43) G. F. Marranghello, J. C. N. de Araujo, Class. Quant. Grav. 23 6345 (2006).
- (44) P. Danielewicz, R. Lacey, W. G. Lynch, Science 298, 1592 (2002).
- (45) G. F. Marranghello, C. A. Z. Vasconcellos, Int. J. Mod. Phys. E, accepted.