Dissecting Galaxy Formation:
II. Comparing Substructure in Pure Dark Matter and Baryonic Models
Abstract
We compare the substructure evolution in pure dark matter (DM) halos with those in the presence of baryons, hereafter PDM and BDM models. The prime halos have been analyzed in the previous work, Romano-Diaz et al. Models have been evolved from identical initial conditions which have been constructed by means of the Constrained Realization method. The BDM model includes star formation and feedback from stellar evolution onto the gas. A comprehensive catalog of subhalo populations has been compiled and individual and statistical properties of subhalos analyzed, including their orbital differences. We find that subhalo population mass functions in PDM and BDM are consistent with a single power law, , for each of the models in the mass range of . However, we detect a nonnegligible shift between these functions, the time-averaged for the PDM and for the BDM models. Overall, appears to be a nearly constant with variations of . Second, we find that the radial mass distribution of subhalo populations can be approximated by a power law, with a steepening that occurs at the radius of a maximal circular velocity, , in the prime halos. Here we find that the for the PDM and –1 for the BDM models, when averaged over time inside . The slope is steeper outside this region and approaches . We detect little spatial bias (less than ) between the subhalo populations and the DM distribution of the main halos. Also, the subhalo population exhibits much less triaxiality in the presence of baryons, in tandem with the shape of the prime halo. Finally, we find that, counter-intuitively, the BDM population is depleted at a faster rate than the PDM one within the central 30 kpc of the prime halo. The reason for this is that although the baryons provide a substantial glue to the subhalos, the main halo exhibits the same trend. This assures a more efficient tidal disruption of the BDM subhalo population. However, this effect can be reversed for a more efficient feedback from stellar evolution and the central supermassive black holes, which will expel baryons from the center and decrease the central concentration of the prime halo. We compare our results with via Lactea and Aquarius simulations and other published results.
Subject headings:
cosmology: dark matter — galaxies: evolution — galaxies: formation — galaxies: halos — galaxies: interactions — galaxies: kinematics and dynamics1. Introduction
The high-redshift Universe is characterized by a uniform mixture of dark matter (DM) and baryons (e.g., Spergel et al. 2007). The process of galaxy formation is expected to lead essentially to a (partial) separation between the DM and baryons, due to dissipative processes in the latter. As a result, the central regions of many galaxies should be dominated by the baryons and by their dynamics — this is supported by observations of various aspects of galactic dynamics (e.g., Flores & Primack 1994; de Blok & Bosma 2002; Sand et al. 2004; Gentile, Tonini & Salucci 2007; de Blok et al. 2008). On the other hand and as a direct consequence of the process of a hierarchical buildup of structure in the Universe, a large amount of substructure, i.e., subhalos, penetrating the prime halos is expected to be present (e.g., Klypin et al. 1999; Moore et al. 1999). Moreover, the baryons are expected to modify the DM structure on sub-galactic scales, both in the prime halos and the subhalos, although the extent of this change is far from being clear. Such differences can be accompanied by substantial adjustments in the DM distribution, angular momentum, and other dynamic variables. The baryonic processes may also affect the survival of subhalos. This in turn can modify the basic parameters of the galactic disks which grow within DM halos, because disk-subhalo interactions can drive the disk evolution (e.g., Gauthier, Dubinski & Wilson 2006; Heller, Shlosman & Athanassoula 2007a,b; Romano-Diaz et al. 2008b; Shlosman 2010 and refs. therein). These effects are far from being fully quantified — a direct comparison between pure DM and DMbaryon models on subgalactic scales is limited both by numerical resolution and complex baryonic physics. In Paper I (Romano-Diaz et al. 2009), we compared the evolution of the prime halos of pure DM and DMbaryon numerical (hereafter PDM and BDM) models, evolved from identical initial conditions within the cosmological framework. Here we compare some aspects of the evolution in the substructure associated with the prime halos in the PDM and BDM models.
Recent efforts to understand galaxy formation have been spearheaded by pure DM halo formation in the cosmological framework, culminating in the large-scope Millenium (Springel et al. 2005), via Lactea (Diemand, Kuhlen & Madau 2007; Diemand et al. 2008), Aquarius (Springel et al. 2008) and Ghalo (Stadel et al. 2009) simulations. Addition of a baryon component to the pure DM modeling is associated with difficulties related to a numerical modeling of dissipative processes, partly due to the sub-grid physics, and to our limited knowledge of physics of the ISM, star formation, energy and momentum feedback, etc., as shown in DMhydrodynamic simulations (e.g., Sommer-Larsen, Götz & Portinari 2003; Maccio et al. 2006; Berentzen & Shlosman 2006; Stinson et al. 2006; Governato et al. 2007; Heller et al. 2007a; Kaufmann et al. 2007; Romano-Diaz et al. 2009; Scannapieco et al. 2009), in chemodynamical simulations (e.g., Samland & Gerhard 2003; Brook et al. 2007a,b), or implementing semianalytical methods (e.g., Scannapieco et al. 2006). Comparison between various aspects of subhalo population between pure DM and baryonic models has been performed also for cluster scales (e.g., Nagai & Kravtsov 2005; Weinberg et al. 2008; Dolag et al. 2009).
In Paper I and Romano-Diaz et al. (2008a,b) we quantified to what extent the baryons alter the DM density distribution within the prime halo. They contribute decisively to the evolution of its central region, leading initially to an isothermal DM cusp, which is subsequently flattened to a DM density core — the result of heating by dynamical friction of the DMbaryon subhalos during the quiescent evolution epoch. This confirmed previous work on this subject (e.g., El-Zant, Shlosman & Hoffman 2001; El-Zant et al. 2004; Tonini, Lapi & Salucci 2006; see also review by Primack 2009, as well as Johansson, Naab & Ostriker 2009). As a by-product of this process, the cold gas has been ablated from a growing embedded disk, reducing the star formation rate by a factor of 10, and heating up the spheroidal gas and stellar components, triggering their expansion. We find that only a relatively small fraction of DM particles in PDM and BDM models are bound within the radius of maximal circular velocity in the halo, most of the DM particles perform larger radial excursions. We also find that the fraction of baryons within the halo virial radius somewhat increases during the major mergers and decreases during the minor mergers. The net effect appears to be negligible — an apparent result of our choice of feedback from stellar evolution. Furthermore, we find that the DM halos are only partially relaxed beyond their virialization. While the substructure is being tidally disrupted, mixing of its debris in the halo is not efficient and becomes even less so with redshift. The phase-space correlations (streamers) formed after survive largely to the present time.
This paper is structured as follows. Section 2 describes the initial conditions and the numerical modeling. Section 3 focuses on the basic properties of the PDM and BDM subhalos in our simulations, and section 4 compares the evolution of these subhalo populations in PDM and BDM prime halos. Discussion and conclusions are give in the last section.
2. Initial Conditions and Numerical Modeling
For numerical details, model parameters and initial conditions, the reader is referred to Paper I. Here we only comment that the initial conditions for PDM and BDM models have been obtained using Constrained Realizations method (CRs, Bertschinger 1987; Hoffman & Ribak 1991; van de Weygaert & Bertschinger 1996). We followed the prescription of Hoffman & Ribak (1991) to build the initial conditions within a restricted cubic volume of space with sides Mpc in the CDM cosmology, where a sphere of Mpc is carved out and evolved from . Numerical simulations have been performed with the parallel version of FTM-4.5 hybrid -body/Smooth Particle Hydrodynamics (SPH) code (e.g., Heller & Shlosman 1994; Heller et al. 2007a; Paper I) using vacuum boundary conditions and physical coordinates. The star formation (SF) modeling algorithm is described in Heller et al. (2007a) and involves multiple generations of stars, energy and momentum feedback from stellar evolution, supernovae and OB stellar winds.
The total mass inside the computational sphere is . To introduce the baryons, we have randomly replaced DM particles on the initial conditions grid by baryon (i.e., SPH) particles, so that stays the same. The initial masses of DM and SPH particles are the same, . The evolution of various parameters characterizing the DM and baryons has been followed in 1000 snapshots, linearly spaced in the cosmological expansion parameter .
2.1. Identifying and Measuring the Subhalos
The HOP algorithm (Eisenstein & Hut 1998) used to identify the substructure within the computational sphere becomes inefficient deep within the prime halo, where density rises above the virial density . Here is the critical overdensity at virialization (Bryan & Norman 1998) and is the background density. The halo virial radius, , is defined in the context of the spherical top-hat collapse model, 3. Therefore, we divide the computational sphere into two regions — the boundary between these regions is of a prime halo. In the outer, mostly unvirialized part we simply apply the HOP algorithm for halo finding. In the inner, mostly virialized part, we refine the method and perform the following iterative procedure.
-
•
We start from and split the enclosed volume into arbitrary-shaped shells lying between isodensity surfaces, where , with the shells counted from inwards. We choose . Within each shell, the total (DM or DMbaryons) background density was taken as constant and equal to the average of two isodensities which sandwich it.
-
•
The HOP algorithm was applied within each such shell, the subhalos have been identified and their tidal radii, , and masses, have been determined from the condition that the subhalo density falls below the background (shell) density, . We check that such substructures are repeated in several iterations. Otherwise they are considered spurious and removed from the subhalo catalog.
-
•
In order to distinguish “real” structures from (unbound) density enhancements, we require that real substructure will have a peak density and that the number of DM particles associated with this candidate exceeds 100. We find that objects that include less than the above number of DM particles provide unreliable statistical data in order to analyze their properties.
-
•
Finally, the background (i.e., unbound to a subhalo) DM or baryon particles have been assessed using the velocity histogram of all particles within in order to separate them from the genuine subhalo mass contribution. We use velocities in the center of mass (CoM) of a subhalo. An alternative method exists to separate the bound subhalo gas from the hot unbound background, using the bi-modal temperature distribution of the gas particles.
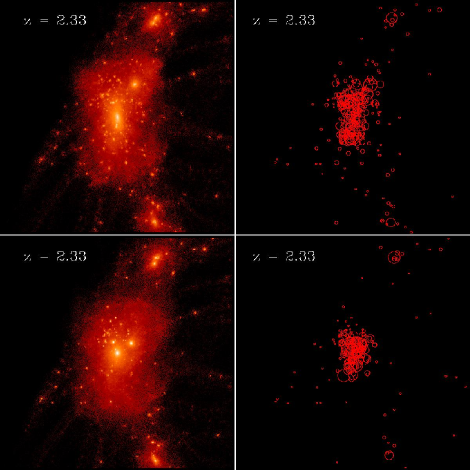
As stated above, we also define the virial and tidal radii of subhalos. For this we use the 3D density contours of subhalos obtained in the previously described procedure. The last contour still belonging to the subhalo is that whose density is defined in the first item. It is above the local background density of the prime halo (if located inside the prime halo) or simply the background density (if outside the prime halo). The tidal radius of the subhalo, , is defined as the maximal extent of such a contour from the subhalo CoM. The virial radius of a subhalo is defined similarly when the latter is situated outside the prime halo. The subhalo masses, both virial and tidal, are assumed to lie within density shells of these radii, respectively. Snapshots of prime halos and the associated subhalos are shown in Fig. 1 for PDM and BDM models at .
3. Results: Basic Properties of Subhalos in PDM and BDM Models
We have compiled a comprehensive catalog of subhalos in PDM and BDM models which is used to infer their basic properties. In the following, we also choose representative samples of PDM and BDM subhalos out of the general catalog having different masses (i.e., in the mass ranges of ) at the time of crossing of prime halos. Finally, we look at the corresponding subhalo pairs in PDM and BDM.
Our tests indicate that only subhalos with particle number exceeding 100 give a reliable estimate of their properties (see also Trenti et al. 2010). In order to identify the time of a subhalo (tidal) dissolution, we mark the 20 densest DM particles in each of the subhalos and calculate the dispersion in their relative positions, , as a function of time (section 4). The tidal disruption of a subhalo is reflected in a sharp increase in . We choose kpc for the time when the subhalo has been destroyed, and mark this time as or . This method has been tested and found as very reliable.
Because we avoid fitting the NFW density profile to the subhalos, we modified the definition for the compactness parameter, , used in the literature by replacing by and by . This has been done by obtaining the rotation curves for the subhalos based on their total mass distribution. In Paper I we have shown that behaves largely similar to . The new definition is /. Because is the most bound radius (i.e., maximum of the DM rotation curve), we typically find that over the lifetime of a subhalo, i.e., it is destroyed before drops below unity.
3.1. Subhalo Mass Function
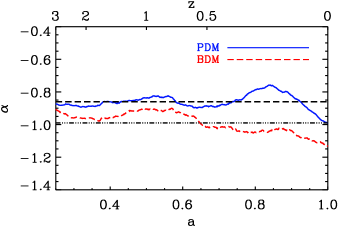
We follow the evolution of the subhalo mass function, inside of the prime halos, hereafter SubHMF. We approximate the SubHMF with a power law, (e.g., Moore et al. 1999; Ghigna et al. 2000; Springel et al. 2001),. We start by comparing the evolution of the power law index in the SubHMF (Fig. 2).
The main conclusions that emerge from Fig. 2 with regards to the evolution of in PDM and BDM models are as follows. First, the PDM SubHMF remains slightly shallower than the BDM one at all times, which is reflected in their averages as well, –0.86 vs –0.98 respectively. The final values at are -0.99 and -1.13. Second, the difference between these models, , otherwise nearly constant, appears to increase and decrease after . During this time, the PDM SubHMF becomes slightly shallower, while the BDM one slightly steeper. Both functions converge thereafter. Third, the associated fluctuations in with respect to the mean values of are related to the waves of inflowing low mass subhalos across after the epoch of major mergers (Romano-Diaz et al. 2008a). Overall, this behavior is consistent with const. over the whole period, in the presence of an intrinsic scatter of .
In principle, we cannot rule out that there is an evolutionary trend in for in both models in Fig. 2. It may be also related to the overall depletion of the subhalo population, i.e., the small number statistics, which would allow larger fluctuations from the mean toward the end of the simulations. As noted in the Discussion section, a similar trend was detected in the analysis of pure DM simulations of via Lactea (Madau et al. 2008).
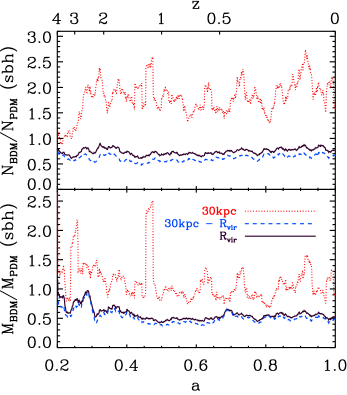
To compare the evolution of the subhalo populations within and in the innermost 30 kpc in PDM and BDM, we display their number and mass ratios as a function of time in Fig. 3. Within the central 30 kpc, the BDM-to-PDM number ratio of subhalos stays above unity for the entire evolution after , while prior to it oscillates in a narrow range around unity. After , this ratio is limited to range and shows large amplitude fluctuations due to the clumpy influx (see above and in Romano-Diaz et al. 2008a), especially noticeable in the coresponding mass ratios in the lower frame of Fig. 3. On the other hand, this ratio remains steady and below unity in the less dense outer parts of the prime halos. This is also true for the subhalo population overall.
The DM mass ratio, BDM/PDM, of subhalos (Fig. 3) within the inner 30 kpc appears to stabilize around unity at later times, albeit fluctuating with substantial amplitudes. Beyond this region, i.e., between 30 kpc – , it stabilizes around 0.5 – 0.6, after the major merger epoch. This latter ratio also holds for the entire subhalo population, as we see from the black solid curve at . Hence, there are more, by a factor of , subhalos by number in the innermost region of the BDM prime halo, but not by mass. Their DM mass is comparable to that locked in the PDM subhalos.
This excess of the subhalos within the inner 30 kpc of the prime BDM halo points to a shorter capture time of these objects in the central region than in the PDM model (as shown in section 4). This in turn leads to shorter lifetimes of the BDM subhalos. On the other hand, the total DM masses of PDM and BDM populations in the central region are comparable. Partially this is because a fraction of DM, , has been converted into baryons in the initial conditions. As a result, a larger fraction of the BDM subhalos falls below the threshold of , and, therefore, does not contribute to the subhalo mass in our estimates. On top of this, because the BDM subhalos concentrate deeper in the potential well of the prime halo, they are tidally stripped at a faster rate and hence have lesser masses on the average.
3.2. Subhalo Population Spatial Distribution
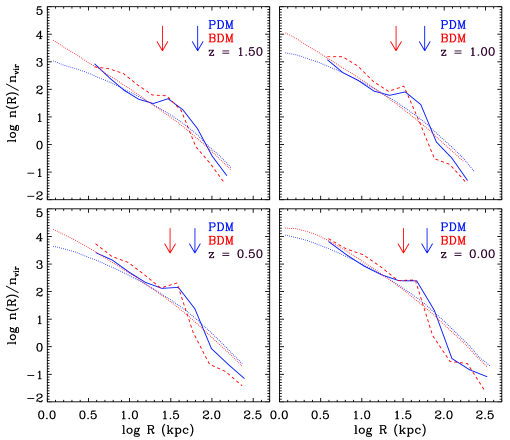
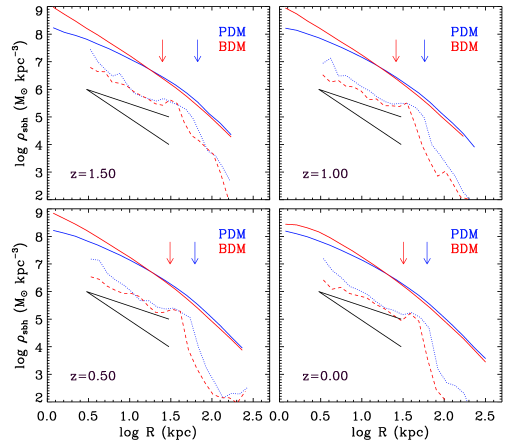
As a next step, we have computed the number density of subhalos, , normalized by their average density within , in the PDM and BDM models (Fig. 4). As before, we only account for subhalos with a mass above the threshold mass of (i.e., ). The prominent feature in is a bump associated with some steepening of the slope at . As a next step, we analyze the DM mass distribution due to the subhalo population, , within the prime halos of both models. We find that the subhalo population distribution bears some similarity to that of the total DM mass distribution in the prime halos but also shows some differences. Within , the DM density decrease appears linear in the log —log plot for both subhalo populations. We observe a sharp steepening of the density around . This characteristic radius is always larger in the PDM model by a factor of 2 (see Fig. 4 and Paper I). The subhalo population densities are typically steeper than -2 slope beyong this radius. We can trace the subhalos by almost a decade in radius inside , to the inner few kpc — the resolution limit of the subhalo detection. Within the slopes lie between -1 and -2, as seen in the snapshotes in Fig. 4 at various , with the PDM slope being somewhat steeper on the average (more about this below). As confirmed by the lower frame of Fig. 3, the rate of the subhalo influx into the central region is uneven which leads to an alternate dominance by the PDM or BDM subhalos at various times. Accordingly, the same behavior is found when we divide the subhalo population into spherical shells of equal width.
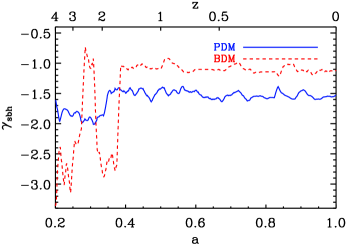
We have fitted a time-averaged power law to the density profile of subhalo population within , shown in Fig. 5 (see Fig. 6). The PDM and BDM distributions differ, the former being somewhat steeper, with vs for the BDM subhalos, confirming Fig. 5. We note also that the profiles are more stable than those for the SubHMF, after the epoch of major mergers. The slopes are shallower than those of the total DM distribution in the prime halos within and steeper outside these radii. This behavior can be dominated by dissolution of the subhalos in the central region.
We have calculated the DM mass fraction of subhalo populations locked within of the prime halos. After , both the PDM and BDM models behave similarly. This confirms our previous estimates of the DM associated with subhalos and with their tidally disrupted remanants (i.e., streamers, still visible in the phase space) within the prime halos (Fig. 11 of Paper I). In Paper I we have estimated that the total fraction of bound (to subhalos) and unbound but not yet mixed material at to be . Here we find that about half of this DM is bound and the rest contributes to the streamers, i.e., to the not yet mixed material.
We also comment on the axial ratios of the subhalo populations. As shown in Fig. 1, these ratios are much closer to unity in the presence of baryons. This agrees well with our results for the DM distribution in the prime halos in paper I.
4. Results: Subhalo Populations in PDM and BDM Models
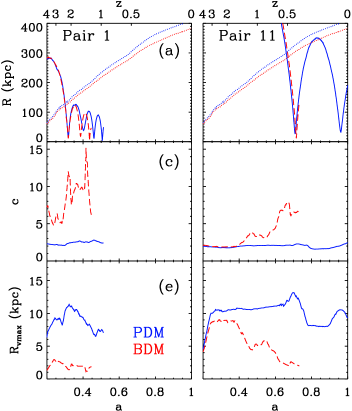
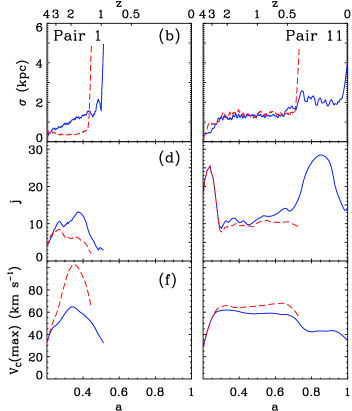
Using the compiled catalog of subhalos in PDM and BDM models allows us to make a direct comparison between corresponding pairs in order to understand the effect of baryon presence on the subhalo population and its dynamics. Specifically, we have compared the corresponding subhalos trajectories, masses within their and , their concentration parameters, masses and mass ratios of all components to their total masses, specific angular momenta, and determined their destruction times. The redshifts of the prime halo crossing have been choosen to lie between . Two examples from this catalog are shown in Fig. 7 and provide a detailed quantitative analysis of these subhalo pairs. The subhalo population average properties are discussed later on.
Analyzing the corresponding PDM and BDM pairs, we find that the redshift of a subhalo disruption, , is almost always higher for BDM than for the associated PDM ones. This seems to be counter-intuitive because one can argue that the BDM subhalos are more concentrated due to the baryon dissipation. This argument, however, neglects the accompanying changes to the BDM prime halo, which becomes substantially more concentrated, as shown in Fig. 4 of Paper 1. The orbits of PDM and BDM subhalo pairs appear nearly identical up to their first pericenter. After this, the trajectories separate (Fig. 7a). The radial extent of the PDM trajectories remains larger, and the next apocenter of the PDM subhalo lies at larger compared to the BDM. We also find that after the first pericenter is reached, the specific angular momentum of a PDM subhalo’s particles is always larger than that of the corresponding BDM, with respect to the CoM of the prime halo (Fig. 7d). In other words, the BDM subhalos settle on more radial orbits after the first pericenter passage. The tidal disruption of subhalos normally occurs after the pericenter, as can be seen from the suddent increase in (Fig. 7b). The larger time spacing between the pericenters of the PDM subhalos is probably the main reason why the PDM population is characterized by a longer lifetime compared to their BDM counterparts. We return to this issue later on when we discuss the average properties of subhalo populations.
The next important difference between the corresponding PDM and BDM subhalos is the evolution of the concentration parameter. Already at higher , close to the turnover radii, when the subhalos travel outside of the prime halo, grows faster in BDM subhalos. This growth seems spectacular when compared to a nearly constant of the PDM counterparts (Fig. 7c). It terminates typically when a subhalo enters of the prime halo, or after the first pericenter of its orbit. However, the cutoff in the growth of can come as early as the turnover radius of the prime. Frequently, the “normal” evolution of is modified by interactions with other subhalos.
Before we turn to the average properties of the subhalo populations, we note that the reason for consistently higher in BDM subhalos is that their decreases early and substantially due to the accretion of baryons which concentrate deep within this radius (Fig. 7e), as can be confirmed by comparing the radial profiles of their circular velocities and by the maximal values of circular velocities (Fig. 7f). Hence, baryons clearly impact the internal structure of the BDM subhalos. We note that in the PDM subhalos declines late in the evolution as well, typically in the last stage leading to a tidal disruption (Fig. 7e). This effect was first noticed by Klypin et al. (1999). However, stays nearly constant in these objects, as the decline in is concurrent with the decline in .
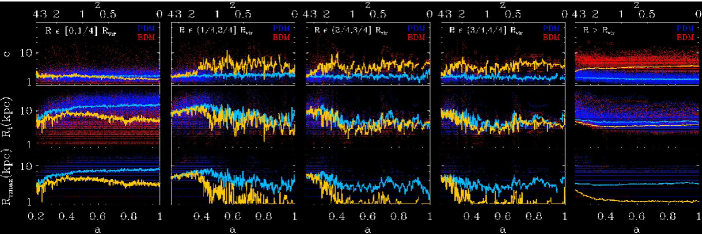
In order to follow the overall properties of subhalo populations in both models, we separate their evolution into 4 spatial zones within and one zone outside the prime halos, namely, , , , and , where the virial radius is that of the prime halos (Fig. 8). In the innermost region, the average remains nearly constant in time for the PDM and slowly decreases for the BDM subhalos, below the PDM curve. For the next three regions, the average is somewhat more noisy for the PDM and much more noisy for the BDM ones. The overall trend is of a nearly constant for PDM and a slight increase and a subsequent decrease for the BDM average values. However, the BDM curve always stays above the PDM one in the next three zones. This trend continues outside , although the noise has disappeared completely and the separation between the average curves is larger. Strikingly, the dispersion of values around the average is much larger for the BDM model in all zones, especially in the innermost one.
As has been noted already in Fig. 7 for specific examples and confirmed in Fig. 8 for the whole subhalo population, the divergent behavior of the average comes from a decrease in the average values of and especially of in the BDM subhalos. The maxima of the circular velocity curve move to much smaller radii in the BDM subhalos due to the captured baryons contribution. This is most dramatically demonstrated for the substructure outside the prime halo — here drops to a few kpc and stays nearly constant after the major merger epoch, while that of the PDM population is barely affected.
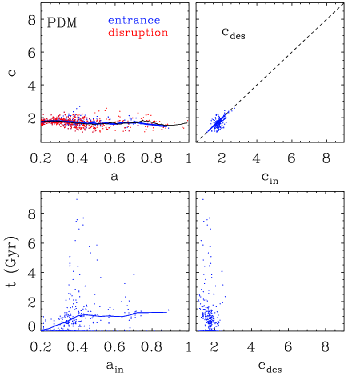
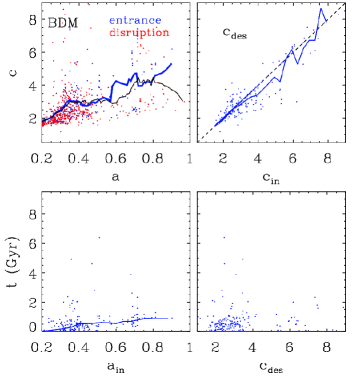
To further compare the evolution of for the PDM and BDM subhalos, we plot its values for individual subhalos at the time they enter of the prime halo and at the time they are tidally disrupted, and respectively, vs time (Fig. 9, left upper). The prevailing trends are obvious for both populations: no evolution for the PDM and a gradual increase by a factor of in BDM. Note that occasionally, the entering exceeds that of the disruption, but overall they evolve in tandem.
Because little evolution in is observed in PDM, the values lie in the corner of the available parameter space, , in PDM, but are much less confined in the BDM case (Fig. 9, upper right). Again we confirm that the average ratio of is nearly constant for both populations.
Comparison of the subhalo lifetimes following their entrance into the prime halos shows that the average time before the tidal disruption increases in time during the major merger epoch, then nearly levels off. The average lifetime thereafter is about 1.5 Gyr for the PDM and Gyr for the BDM subhalo population. However, the dispersion around this mean is substantial, especially during the major mergers epoch. For PDM, most of the subhalos are destroyed within 4 Gyrs, some survive much longer, Gyr (Fig. 9, lower left)). The lifetime of the BDM subhalos is much more limited, and most are destroyed within Gyr.
Finally, we find that, on the average, the PDM subhalos are destroyed within a narrow range in , while the BDM ones exhibit a much larger dispersion in these values (Fig. 9, lower right). We also find a clear symmetry across the diagonal in both models — thus the subhalos do not increase their as they are tidally disrupted. This is interesting because Fig. 7c shows that in BDM increase with time after penetrating the prime halo, although they fall sharply during the tidal disruption process.
Comparison with the PDM model reveals an important difference — although the BDM subhalos are more centrally concentrated than their PDM counterparts, they are disrupted at a higher rates. This applies of course only to the substructure that penetrates deep inside the prime halo, say the central kpc.
5. Discussion and Conclusions
The purpose of this work is to compare the properties and evolution of subhalos without baryons (PDM models) and in their presence (BDM models). PDM and BDM models have been evolved from identical initial conditions designed by means of Constrained Realizations method. The prime halos of both models have been compared in paper I. We have compiled a comprehensive catalog of PDM and BDM subhalos in order to analyze the statistical properties of these populations. In addition, we created a subsample of corresponding PDM and BDM subhalo pairs to focus on the individual evolution. Lastly, we have performed some basic analysis of subhalo population orbits in PDM and BDM.
Our main results are as following. We compile and compare the subhalo population mass functions (SubHMFs) in the range of . The SubHMFs are consistent with a single power law in the mass range of for both models. However, we note a systematic offset of the BDM population with respect to the PDM one. Namely, (PDM) and –0.98 (BDM), respectively. Some variablity in can come from an intrinsic scatter of . In the simulations it is associated with waves of subhalos falling into the prime halos along the large-scale filaments. Such waves appear to be much more pronounced in the presence of baryons.
Next, we have analyzed the spatial DM number and mass densities of subhalo populations. We find that the latter one can be roughly described as a power law with a steepening around — the radius of maximal circular velocity and hence largest binding energy. Inside the slope, , is much more shallow than outside this radius. A smoothed out is about –1.5 in the PDM and –1 in the BDM models, within . The slope is closer to –3 outside this region. The shallower slope within is related to the elevated rates of subhalo ablation and tidal disruption processes. Overall, the subhalo number density profiles follow the distributions of their respective main halos.
Third, we find that the BDM population of subhalos is depleted at a higher rate compared to the PDM population. This result appears to be counter-intuitive because one expects the accreted baryons to increase the mass concentration of BDM subhalos and make them more resilient to tidal disruption. However, we find that the trend leading to the increased mass concentration of the prime halo in the BDM model dominates and ultimately contributes to the dissolution of subhalos. Specifically, trajectories of PDM-BDM subhalo pairs appear to diverge after the first pericenter. The subsequent BDM subhalos trajectories become confined to the innermost regions of the prime halo where they experience increased dynamical friction and spiral in towards their ultimate tidal disruption. The lower slope for the inner density profile of the BDM subhalos compared to the PDM stems from their elevated rate of the tidal disruption. The small number of central subhalos leads to significant fluctuations in the slope. Yet, on the average, the BDM population is depleted faster in this region as shown by Figures 6 and 9, resulting in a lower slope.
We now compare our results with those found in the literature, starting with the SubHMFs. Most of the modeling of SubHMFs on the galactic scales has been focused on the pure DM models. Comparison with the BDM models is nearly always limited to galaxy clusters. In the galaxy and cluster mass range, the slope was found to be consistent with -1, for the PDM models (Moore et al. 1999; Ghigna et al. 2000; Springel et al 2001; Stoehr et al. 2003; De Lucia et al. 2004; Gao et al. 2004; van den Bosch et al. 2005; and Diemand et al. 2007, 2008). More recent multi-resolution Aquarius simulation (Springel et al. 2008) estimate the range for to lie between -0.87 and -0.93, close to our value of -0.86.
The later evolution of the PDM SubHMFs has also been noticed in the Via Lactea simulation. For via Lactea and additional simulations, Madau et al. (2008) showed that the slope of the mass function at two different redshifts ( — the only ones published) has slightly changed, steepening from to . Such a “last moment” steepening is compatible with our Fig. 2, as noted in section 3.1. We find that this possible steepening in PDM and BDM subhalo populations can be related to the small number statistics toward the end of the simulation — i.e., we possibly observe a large amplitude variation around the mean for the slope . We, therefore, leave this issue open.
There is much less data on the SubHMF in the presence of baryons, and it deals with the mass range of clusters of galaxies. Comparing simulations (with and without baryions) drawn from the same initial conditions, Weinberg et al. (2008) found the two subhalo mass functions to be very similar. They conclude that the dissipative baryonic component has only a “small” impact on this global measure of the subhalo population. On the other hand, Dolag et al. (2009) find that the addition of baryons somewhat modifies the SubHMF for galaxy clusters, with to be somewhat steeper than . While their values of are similar to ours, the order appears inverted. Finally, for , Libeskind et al. (2010) point out that the BDM substructure is more radially concentrated than in the PDM.
Next, we turn to the DM density profiles of the subhalo population. We find Maccio et al. (2006) as the only work on this issue within the galaxy mass range, although they stopped the gas cooling at (see also Sales et al. 2007, although they only analyze the most massive subhalos within their simulations). This work provides only the subhalo number density profile (their Fig. 6), which is consistent with ours. Similar results have been obtained by Nagai & Kravtsov (2005) and by Weinberg et al. (2008) — all deal with the subhalo population number density profiles, albeit in the galaxy clusters mass range. Furthermore, we find that there is little spatial bias (less than ) between the subhalo population DM mass density and the DM distribution of the main halos (e.g., Sales et al. 2007).
Extending the subhalo population number density to the DM mass density, we find that a new feature — steepening of the mass density profile, appears to be associated with the position of in each model. Around , the slopes change and steepen from to below -2. If verified in other models, this is an interesting effect related to increased ablation and dissolution of subhalos in the cnetral region of the prime halos. It has implications on dynamics of subhalos and reflects their trapping within .
Turning to the properties of individual subhalos in PDM and BDM models, specifically to the evolution of the concentration parameter, , we find that except in the innermost 30 kpc the average of the BDM population is higher than that for the PDM one (Fig. 8). Hence, it seems surprising that both PDM and BDM subhalos have the same when they enter the prime halo and when they are tidally disrupted, i.e., , as shown by Fig. 9. Resolution of this puzzle is provided by Fig. 7c. Indeed, in BDM stays well above that for PDM and increases with time. However, in the process of a tidal disruption, it drops sharply, and in many cases to near the original value, thus assuring that the population average has . This coincidence is related to our choice of the “moment of disruption” — taking kpc for the dispersion in the positions of 20 densest particles in a subhalo. However, this definition has been tested, including visual test as well as a test in the phase space, and found highly reliable. Any other choice of the critical value for would be more ad hoc.
Our result for the average for the subhalos population in both models agree well with the conclusion by Dolag et al. (2009) that BDM population is on the average more concentrated than the PDM, albeit they show only a single snapshot in redshift and in the cluster regime. They also use the standard definition of by fitting the NFW profile to subhalos. However, we find that the subhalos are tidally truncated and avoid using the NFW model fit. The tidal effects are especially visible in the central region of 30 kpc where we find that the PDM are on the average less concentrated than the BDM ones. This of course must be taken together with the caveat that the PDM subhalos spend less time inside this region, as discussed above (see also Fig. 7a).
This brings us to an interesting point, namely, which subhalo population is tidally disrupted faster. While it is obvious that baryons provide an additional “glue” to the DM subhalos, they also affect the innermost region of the prime halo. This is obvious from our analysis of DM distribution in the prime halo of the BDM model (Paper I), where is essentially halved compared to the PDM prime. Even more prominent changes are affecting the cusp region (Romano-Diaz et al. 2008a). Clearly, the resolution of the question of which population is destroyed at a higher rate depends on the competition between two effects: increase in the concentration of the subhalos versus increase in the concentration of the prime halos. In our simulations, the BDM population appears to be destroyed at a higher rate in the central region. However, if the energy and momentum feedback from stellar population and from the central supermassive black hole are able to decrease and maintain a lower fraction of baryons in the prime halo, the effect on the DM density profile will be sharply decreased and the BDM subhalo population will be much more resilient to destruction than the PDM one. It is possible that nature benefits from both solutions. In addition, it is plausible that the galaxy cluster environment prefers the survival of the BDM subhalos, (as in Weinberg et al. 2008; Dolag et al 2009), while on the smaller mass scale, the galaxy environment lead to the opposite.
With respect to the total fraction of the halo mass invested within substructure we find that is locked within subhalos. This result is consistent with previous published analysis (e.g., Ghigna et al. 2000; Springel et al. 2001; Stoehr et al. 2003) which provide a range between 5% and 20%. However, there is no agreement on this matter, as Moore et al. (2001) argues that the true fraction might approach unity if the subhalos could be identified down to very small masses. Our results are also consistent with the Via Lactea simulations where the subhalo mass fraction is within , but appear somewhat lower compared to Aquarius simulation, which quotes .
To summarize, we have analyzed the properties and evolution of subhalo population in the mass range of in pure DM and DMbaryons models evolved from identical initial conditions. Our main results are that the subhalo mass functions can be fitted with a single power law which is compatible with no redshift evolution between , but which is somewhat steeper in the presence of baryons. We have also computed the number and mass density profiles for the DM subhalo component in both models. We find that the DM mass density is shallower inside the radius of the maximal circular velocity in the prime halos and steepens outside. Finally, we compared the disruption rates for the subhalo populations and find that, in the presence of baryons, the subhalos are destroyed at a higher rate within the central 30 kpc of the prime halo — a direct result from the increased central mass concentration. However, with a larger feedback from stellar populations and the central supermassive black holes, the effect can be reversed.
References
- Berentzen et al. (2006) Berentzen, I., Shlosman, I. 2006, ApJ, 648, 807
- Bertschinger (1987) Bertschinger, E. 1987, ApJ, 323, L103
- Brook et al. (2007a) Brook, C.B., Kawata, D., Scannapieco, E., Martel, H., Gibson, B.K. 2007a, ApJ, 661, 10
- Brook et al. (2007b) Brook, C.B., Richard, S., Kawata, D., Martel, H., Gibson, B.K. 2007b, ApJ, 658, 60
- Bryan et al. (1998) Bryan, G.L., Normal, M.L. 1998, ApJ, 495, 80
- de Blok et al. (2002) de Blok, W.J.G., Bosma, A. 2002, A&A, 385, 816
- de Blok et al. (2008) de Blok, W.J.G., Walter, F., Brinks, E., Trachternach, C., Oh, S.-H., Kennicutt, R.C. 2008, AJ, 135, 2648
- De Lucia et al. (2004) De Lucia, G., Kauffmann, G., Springel, V., White, S.D.M., Lanzoni, B., Stoehr, F., Tormen, G., Yoshida, N. 2004, MNRAS, 348, 333
- Diemand et al. (2007) Diemand, J., Kuhlen, M., Madau, P. 2007, ApJ, 657, 262
- Diemand, et al. (2008) Diemand, J., Kuhlen, M., Madau, P., Zemp, M., Moore, B., Potter, D., Stadel, J. 2008, Nature, 454, 735
- Dolag (2009) Dolag, K., Borgani, S., Murante, G., Springel, V. 2009, MNRAS, 399, 497
- Duffy et al. (2010) Duffy, A.R., Schaye, J., Kay, S.T., Dalla-Vecchia, C., Battye, R.A., Booth, C.M. 2010, MNRAS, 624, in press (arXiv:1001.3447)
- Eisenstein (1998) Eisenstein, D.J., Hut, P. 1998, ApJ, 498, 137
- El-Zant et al. (2001) El-Zant, A., Shlosman, I., Hoffman, Y. 2001, ApJ, 560, 636
- El-Zant et al. (2004) El-Zant, A., Hoffman, Y., Primack, J., Combes, F., Shlosman, I. 2004, ApJ, 607, L75
- Flores et al. (1994) Flores, R.A., Primack, J.R. 1994, ApJ, 427, L1
- Gao et al. (2004) Gao, L., White, S.D.M., Jenkins, A., Stoehr, F., Springel, V. 2004, MNRAS, 355, 819
- Gauthier et al. (2006) Gauthier, J.-R., Dubinski, J., Widrow, L.M. 2006, ApJ, 653, 1180
- Gentile et al. (2007) Gentile, G., Tonini, C., Salucci, P. 2007, A&A, 467, 925
- Ghigna et al. (2000) Ghigna, S., Moore, B., Governato, F., Lake, G., Quinn, T., Stadel, J. 2000, ApJ, 544, 616
- Governato et al. (2007) Governato, F., Willman, B., Mayer, L., Brooks, A., Stinson, G., Valenzuela, O., Wadsley, J., Quinn, T. 2007, MNRAS, 374, 1479
- Heller et al. (1994) Heller, C.H., Shlosman, I. 1994, ApJ, 424, 84
- Heller et al. (2007a) Heller, C.H., Shlosman, I., Athanassoula, E. 2007a, ApJ, 671, 226
- Heller et al. (2007b) Heller, C.H., Shlosman, I., Athanassoula, E. 2007b, ApJ, 657, L65
- Hoffman et al. (1991) Hoffman, Y., Ribak, E. 1991, ApJ, 380, L5
- Johansson et al. (2009) Johansson, P.H., Naab, T., Ostriker, J.P. 2009, ApJ, 697, L38
- Libeskind et al. (2010) Libeskind, N.I., Yepes, G., Knebe, A., Gottlöber, S., Hoffman, Y., Knollmann, S.R. 2010, MNRAS, 401, 1889
- Kaufmann et al. (2007) Kaufmann, T., Mayer, L., Wadsley, J., Stadel, J., Moore, B. 2007, MNRAS, 375, 53
- Klypin et al. (1999) Klypin, A., Gottlober, S., Kravtsov, A.V. 1999, ApJ, 516, 539
- Maccio et al. (2006) Macció, A.V., Moore, B., Stadel, J., Diemand, J. 2006, MNRAS, 366, 1529
- Madau et al. (2008) Madau, P., Diemand, J., Kuhlen, M. 2008, ApJ, 679, 1260
- Mashchenko et al. (2006) Mashchenko, S., Couchman, H.M.P., Wadsley, J. 2006, Nature, 442, 539
- Moore et al. (1999) Moore, B., Ghigna, S., Governato, F., Lake, G., Quinn, T., Stadel, J., Tozzi, P. 1999, ApJ, 524, L19
- Moore et al. (2001) Moore, B., Calcáneo-Roldán, C., Stadel, J., Quinn, T., Lake, G., Ghigna, S., Governato, F. 2001, Phys. Rev. D, 64, 063508
- Nagai et al. (2005) Nagai, D., Kravtsov, A.V. 2005, ApJ, 618, 557
- Primack (2009) Primack, J. 2009, in AIP Conf. Proc. 1192, XIII Special Courses at the National Observatory of Rio de Janeiro, ed. F.Roig et al. (Melville, NY:AIP), p. 101 (arXiv:0909.2021)
- Romano-Diaz et al. (2008a) Romano-Diaz, E., Shlosman, I., Hoffman, Y., Heller, C.H. 2008a, ApJ, 685, L105
- Romano-Diaz et al. (2008b) Romano-Diaz, E., Shlosman, I. Heller, C.H., Hoffman, Y. 2008b, ApJ, 687, L13
- Romano-Diaz et al. (2009) Romano-Diaz, E., Shlosman, I. Heller, C.H., Hoffman, Y. 2009, ApJ, 702, 1250 (Paper I)
- Sales et al. (2007) Sales, L.V., Navarro, J.F., Abadi, M.G., Steinmetz, M. 2007, MNRAS, 379, 1464
- Samland et al. (2003) Samland, M., Gerhard, O. 2003, A&A, 399, 961
- Sand et al. (2004) Sand, D.J., Treu, T., Smith, G.P., Ellis, R.S. 2004, ApJ, 604, 88
- Scannapieco et al. (2006) Scannapieco, E., Kawata, D., Brook, C.B., Schneider, R., Ferrara, A., Gibson, B.K. 2006, ApJ, 653, 285
- Scannapieco et al. (2009) Scannapieco, C., White, S.D.M., Springel, V., Tissera, P.B. 2009, MNRAS, 396, 696
- Shlosman (2010) Shlosman, I. 2010, Galaxy Evolution: Emerging Insights and Future Challenges, ASP Conf. Ser., S. Jogee et al. (eds.), in press, arXiv:0902.2792
- Sommer-Larsen et al. (2003) Sommer-Larsen, J., Gotz, M., Portinari, L. 2003, ApJ, 596, 47
- SPergel et al. (2007) Spergel, D.N. et al. 2007, ApJS, 170, 377
- Springel et al. (2001) Springel, V., White, S.D.M., Tormen, G., Kauffmann, G. 2001, MNRAS, 328, 726
- Springel et al. (2005) Springel, V., et al. 2005, Nature, 435, 629
- Springel et al. (2008) Springel, V., Wang, J., Vogelsberger, M., Ludlow, A., Jenkins, A., Helmi, A., Navarro, J.F., Frenk, C.S., White, S.D.M. 2008, MNRAS, 391, 1685
- Stadel et al. (2009) Stadel, J., Potter, D., Moore, B., Diemand, J., Madau, P., Zemp, M., Kuhlen, M., Quilis, V. 2009, MNRAS, 398, L21
- Stinson et al. (2006) Stinson, G., Seth, A., Katz, N., Wadsley, J., Governato, F., Quinn, T. 2006, MNRAS, 373, 1074
- Stoehr et al. (2003) Stoehr, F., White, S.D.M., Springel, V., Tormen, G., Yoshida, N. 2003, MNRAS, 345, 1313
- Tonini et al. (2006) Tonini, C., Lapi, A., Salucci, P. 2006, ApJ, 649, 591
- Trenti et al. (2010) Trenti, M., Smith, B.D., Hallman, E.J., Skillman, S.W., Shull, J.M. 2010, ApJ, 711, 1198
- van den Bosch et al. (2005) van den Bosch, F.C., Tormen, G., Giocoli, C. 2005, MNRAS, 359, 1029
- van de Weygaert et al. (1996) van de Weygaert, R., Bertschinger, E. 1996, MNRAS, 281, 84
- Weinberg et al. (2008) Weinberg, D.H., Colombi, S., Davé, R., Katz, N., 2008, ApJ, 678, 6