The mass assembly of galaxy groups and the evolution of the magnitude gap
Abstract
We investigate the assembly of groups and clusters of galaxies using the Millennium dark matter simulation and the associated Millennium gas simulations, and semi-analytic catalogues of galaxies. In particular, in order to find an observable quantity that could be used to identify early-formed groups, we study the development of the difference in magnitude between their brightest galaxies to assess the use of magnitude gaps as possible indicators. We select galaxy groups and clusters at redshift with dark matter halo mass M⊙, and trace their properties until the present time (). Further constraints are applied to keep those galaxy systems for which the X-ray luminosity erg s-1 At redshift . While it is true that a large magnitude gap between the two brightest galaxies of a particular group often indicates that a large fraction of its mass was assembled at an early epoch, it is not a necessary condition. More than 90% of fossil groups defined on the basis of their magnitude gaps (at any epoch between ) cease to be fossils within 4 Gyr, mostly because other massive galaxies are assembled within their cores, even though most of the mass in their haloes might have been assembled at early times. We show that compared to the conventional definition of fossil galaxy groups based on the magnitude gap (in the -band, within of the centre of the group), an alternative criterion (within the same radius) finds 50% more early-formed systems, and those that on average retain their fossil phase longer. However, the conventional criterion performs marginally better at finding early-formed groups at the high-mass end of groups. Nevertheless, both criteria fail to identify a majority of the early-formed systems.
keywords:
cosmology: theory — galaxies: formation — galaxies: kinematics and dynamics — hydrodynamics — methods: numerical1 Introduction
Although existing observations of the large scale structure of the Universe overwhelmingly favour cold dark matter cosmologies with hierarchical structure formation, the paradigm faces challenges both from the existence of luminous passive galaxies at high redshift, and the abundance of low-mass galaxies in the local universe (e.g Baugh, 2006; Balogh et al., 2008). Galaxies dominate the visible universe and any cosmological model is expected to reproduce the observed global properties of galaxies, at least statistically, in the first instance. A significant fraction of the evolutionary life of many galaxies is spent in the environment of small systems (i.e. groups), where close interactions and mergers of galaxies occur with higher efficiency than in massive haloes such as galaxy clusters (e.g. Miles et al., 2004). The observable properties of the baryonic content of a group, which consists of the constituent galaxies and the inter-galactic medium (IGM), should be linked to mass assembly of the host group and its subsequent evolution. Among such observable properties, the ”magnitude gap”, i.e., the difference in the magnitudes of the two brightest galaxies, has been widely used as an optical parameter related to mass assembly of groups and clusters.
Several studies show that a system of galaxies, where most of the mass has been assembled very early, develops a larger magnitude gap compared to systems that form later. The idea is supported in observational samples (e.g. Ponman et al., 1994; Khosroshahi, Jones, & Ponman, 2004; Khosroshahi, Ponman, & Jones, 2007), theoretical studies (e.g. Milosavljević et al., 2006; van den Bosch et al., 2007) and in detailed analysis of N-body numerical simulations (Barnes, 1989; D’Onghia et al., 2005; Dariush et al., 2007). These studies also predict that such early-formed galaxy groups or clusters should be relaxed and relatively more isolated systems in comparison to their later-formed counterparts.
Jones et al. (2003) defined such early-formed systems (also known as fossils) to have a minimum X-ray luminosity of erg s-1, and a large magnitude gap in the -band between their first two brightest galaxies, i.e. , to distinguish them from late-formed groups and clusters. Recent research based on the Sloan Digital Sky Survey has either used only the optical criterion (Santos, Mendes de Oliveira, & Sodré, 2007) or both optical and X-ray criteria (Eigenthaler & Zeilinger, 2009; Voevodkin et al., 2009; La Barbera et al., 2009) to identify fossils. In the former case, if the optical definition is solely employed, the chance of identifying truly early-formed systems diminishes, since a large fraction of the systems detected might be in the stage of collapsing for the first time, and so would not be X-ray luminous.
From numerical simulations, von Benda-Beckmann et al. (2008) found that may not be a good indicator for identifying early-formed groups, since the condition would no longer be fulfilled when a galaxy of intermediate magnitude fell into the group. This study was based on simulations of dark matter particles only, and does reveal how frequently such a situation would arise. Other, potentially more robust, magnitude gap criteria have been considered in the literature. For example, Sales et al. (2007) finds that the difference in magnitude between the first and 10th brightest galaxies in three fossil groups span a range of 3–5, in agreement with their results from the analysis of the Millennium data together with the semi-analytic catalogue of Croton et al. (2006).
The overall number of observed fossil galaxy groups is small, making it difficult for observed systems to be statistically compared to simulated systems. In spite of their low space density, fossils have been used to test models of cosmological evolution (Milosavljević et al., 2006; Khosroshahi, Ponman, & Jones, 2007; von Benda-Beckmann et al., 2008; Díaz-Giménez, Muriel, & Mendes de Oliveira, 2008), since the criteria for observationally identifying such systems are simple (Jones et al., 2003; Khosroshahi, Ponman, & Jones, 2006), and it is generally assumed that they are the archetypal relaxed systems, consisting of a group-scale X-ray halo, the optical image being dominated by a giant elliptical galaxy at the core (Ponman et al., 1994). Indeed, if they are relaxed early-formed systems, fossil groups can be the ideal systems in which to study mechanisms of feedback, and the interaction of central AGN and the IGM of the group, since the effect of the AGN would not be complicated by the effect of recent mergers (Jetha et al., 2008, 2009). The lack of recent merging activity would also predict the absence of current or recent star formation in early-type galaxies belonging to fossil groups (e.g. Nolan, Raychaudhury, & Kabán, 2007), and the relative dearth of red star-forming galaxies compared to similar elliptical-dominated non-fossil groups and clusters (Mahajan & Raychaudhury, 2009).
The use of cosmological simulations in the study of the evolution of galaxy groups will have to employ a semi-analytic scheme for simulating galaxies, and the results will be dependent on the appropriate characterisation of the models that describe galaxy formation and evolution. Once the hierarchical buildup of dark matter haloes is computed from N-body simulations, galaxy formation is modelled by considering the rate at which gas can cool within these haloes. This involves assumptions for the rate of galaxy merging (driven by dynamical friction) and the rate and efficiency of star formation and the associated feedback in individual galaxies (Croton et al., 2006; Bower et al., 2006).
In a previous paper (Dariush et al., 2007), we studied the formation of fossil groups in the Millennium Simulations, and showed that the conventional definition of fossils (namely a large magnitude gap between the two brightest galaxies within half a virial radius and a lower limit to the X-ray luminosity erg s-1), results in the identification of haloes which are 10%-20% more massive than the rest of the population of galaxy groups with the same halo mass and X-ray luminosity, when the Universe was half of its current age. This clearly indicates an early formation epoch for fossils. In addition, it was shown that the conventional fossil selection criteria filter out spurious systems, and therefore there is a very small probability for a large magnitude gap in a halo to occur at random. The fraction of late-formed systems that are spuriously identified as fossils was found to be 4–8%, almost independent of halo mass (Dariush et al., 2007; Smith et al., 2010). Another important outcome of the Dariush et al. (2007) study was the consistency between the space density of fossils found in the simulations and that from observational samples.
Although the results from this previous analysis of the Millennium simulations are shown to be in fair agreement with observation, we did not investigate the evolution of the magnitude gap in either fossil or control groups with redshift. Furthermore, the number of (fossil or control) groups used was small (400), which did not allow us to fully explore the connection between the halo mass and magnitude gap in such systems.
In this paper, we select early-formed galaxy groups from the Millennium simulations, purely on the basis of their halo mass evolution from present time up to redshift , and, with the help of associated semi-analytic catalogues, study the evolution of the magnitude gap between their brightest galaxies. Our aim is to (a) investigate how well the conventional optical selection criterion, namely the gap between the two brightest galaxies, is able to identify early-formed galaxy groups, and (b) to find whether we can find a better criterion to identify groups that have assembled most of their mass at an early epoch.
In §2, we describe the various simulation suites used in this work, and in §3 the data we extract from them. In §4, we study in detail the evolution with epoch of various measurable parameters for a large sample of early-formed “fossil systems” and two comparable sample of control systems, and compare these properties. In §5, we examine the case for a revision of the criteria to observationally find fossil in order to ensure a higher incidence of genuine early-formed systems. We summarise our conclusions in §6. We adopt km s−1 Mpc−1 for the Hubble constant, with .
2 Description of the Simulations
2.1 The Millennium Simulation
The Millennium Run consists of a simulation, in a Universe consistent with concordance CDM cosmology, of 21603 particles of individual mass M⊙, within a co-moving periodic box of side 500 Mpc, employing a gravitational softening of 5 kpc, from redshift to the present day (Springel et al., 2005). The basic setup is that of an inflationary Universe, dominated by dark matter particles, leading to a bottom-up hierarchy of structure formation, which involves the collapse and merger of small dense haloes at high redshifts, into the modern-day observed large virialised systems such as groups and clusters. The cosmological parameters used by the Millennium Simulation were , , , , and , and the Hubble parameter .
Dark matter haloes are found in this simulation down to a resolution limit of 20 particles, yielding a minimum halo mass of 1.72 M⊙. Haloes in the simulation are found using a friends-of-friends (FOF) group finder, configured to extract haloes with overdensities of at least 200 relative to the critical density (Springel et al., 2005). Within a FOF halo, substructures or subhaloes are identified using the SUBFIND algorithm developed by Springel et al. (2001), and the treatment of the orbital decay of satellites is described in the next section.
During the Millennium Simulation, 64 time-slices of the locations and velocities of all the particles were stored, spread approximately logarithmically in time between and . From these time-slices, merger trees were built by combining the tables of all haloes found at any given output epoch, thus enabling us to trace the growth of haloes and their subhaloes through time within the simulation.
2.2 Semi-analytic galaxy catalogues
2.2.1 The Croton et al. semi-analytic catalogue
Croton et al. (2006) simulated the growth of galaxies, and their central supermassive black holes, by self-consistently implementing semi-analytic models of galaxies on the dark matter haloes of the Springel et al. (2005) simulation, Their semi-analytic catalogue contains 9 million galaxies at brighter than absolute magnitude , “observed” in , , , and filters. The models focus on the growth of black holes and AGN as sources of feedback sources. The inclusion of AGN feedback in the semi-analytic model (allowing central cooling to be suppressed in massive haloes that undergo quasi-static cooling), and its good agreement with the observed galaxy luminosity function, distribution of galaxy colours and of the clustering properties of galaxies, make this catalogue suitable for our study.
In this semi-analytic formulation, galaxies initially form within small dark matter haloes. Such a halo may fall into a larger halo as the simulation evolves. The “galaxy” within this halo then becomes a satellite galaxy within the main halo, and follows the track of its original dark matter halo (now a subhalo), until the mass of the subhalo drops below 1.72 M⊙. This limit corresponds to the 20-particle limit for dark haloes in the original Millennium Simulation. At this point the galaxy is assumed to spiral into the centre of the halo, on some fraction of the dynamical friction timescale, where it merges with the central galaxy of the larger halo (Croton et al., 2006).
2.2.2 The Bower et al. semi-analytic catalogue
The Bower et al. (2006) model also makes use of the Millennium Simulation, but utilises merger trees constructed with the algorithm described by Harker et al. (2007). The cooling of gas and the subsequent formation of galaxies and black holes is followed through the merging hierarchy of each tree utilising the Galform semi-analytic model (Cole et al., 2000; Bower et al., 2006; Malbon et al., 2007). At this results in 4,491,139 galaxies brighter than a limiting absolute magnitude of .
In addition to feedback from supernovae, the Bower et al. (2006) model accounts for energy input from AGN, resulting in a suppression of cooling in the hot atmospheres of massive haloes. The resulting galaxy population is in excellent agreement with the observed galaxy luminosity function in and bands, the colour distribution and also with the evolution of the galaxy stellar mass function from to . This model is therefore similarly well-suited to our study of fossil systems. If a halo in a merger tree has multiple progenitors, all but the most massive are considered to become subhaloes orbiting within the larger host halo and any galaxies they contain therefore become satellite galaxies in that halo.
Due to the limited resolution of the Millennium Simulation (which may cause dynamical friction timescales to be poorly estimated), the time between becoming a satellite and merging with the central galaxy of the halo is computed from the analytic dynamical friction timescale. Specifically, each new satellite is randomly assigned orbital parameters from a distribution measured from N-body simulations and the appropriate dynamical friction timescale computed following the approach of Cole et al. (2000), but multiplied by a factor of 1.5. This was found to produce the best fit to the luminosity function in Bower et al. (2006) but is also in good agreement with the results of Boylan-Kolchin, Ma & Quataert (2008) who compared the predictions of analytic dynamical friction timescales with those from idealised N-body simulations. The satellite is allowed to orbit for the period of time calculated above, after which it is merged with the central galaxy of the halo. If the host halo doubles in mass before a satellite can merge, the satellite orbit is assumed to be reset by the merging which lead to that mass growth and so a new set of orbital parameters are assigned and a new merging timescale computed.
2.3 The Millennium Gas Simulations
The Millennium Gas Simulations are a series of hydrodynamical models constructed within the same volume, and values of initial perturbation amplitudes and phases, as the parent dark-matter-only Millennium Simulation (see, e.g., Hartley et al., 2008). Of the three principal models completed in this work, each contains additional baryonic physics: (i) the first does not follow the effects of radiative cooling and so overpredicts the luminosities of group-scale objects significantly, (ii) the second includes a simple preheating scheme that is tuned to match the observed X-ray properties of clusters at the present day and (iii) the third includes a simple feedback model that matches the observed properties of clusters today. We have used the second of these models in this work, as we only utilise the hydrodynamical properties of the groups at , where the observational and simulation results are well matched.
The Millennium Gas Simulations consist of particles of each species, resulting in a dark matter mass of M⊙ per particle and a gas mass of M⊙ per particle. The Millennium Simulation has roughly 20 times better mass resolution than this and so some perturbation of the dark matter halo locations is to be expected. In practice the position and mass of dark matter haloes above M⊙ are recovered to within kpc between the two volumes, allowing straightforward halo-halo matching in the large majority of cases.
The Millennium gas simulations used exactly the same cosmological parameters as those of the dark matter simulations. With the inclusion of a gaseous component, additional care needs to be taken in choosing the gravitational softening length in order to avoid spurious heating (Steinmetz & White, 1997). We use a comoving value of kpc, roughly 4% of the mean inter-particle separation (Borgani et al., 2006) until , above which a maximum comoving value of kpc is adopted. A different output strategy is followed in the Millennium Gas Simulations, where the results are output uniformly in time with an interval roughly corresponding to the dynamical time of objects of interest. This strategy results in 160 rather than 64 outputs and places particular emphasis on the late stages of the simulation.
3 Datasets used in this work
We start with a catalogue of groups extracted by the friends-of-friends (FoF) algorithm employed in the Millennium Dark matter runs. Hereafter a “group” or “group halo” would refer to a group taken from this catalogue. In order to follow the evolution of groups from 1 to the present epoch, we have to combine various sets of information from this FoF group catalogue and the associated semi-analytic catalogues of galaxies, as well as the gas simulations.
We select all groups of M⊙ from the FoF group catalogue at . The mass cut-off is intended to ensure that the progenitors of the present day galaxy groups are indeed groups at 1 with at least four or five members (galaxies), above the magnitude cut of the catalogue. The evolution of each group was followed from to (at 23 discrete values, equally spaced in ) by matching the position of each halo to its descendants at later redshifts.
The position of the central galaxy of each galaxy group, and the corresponding dark matter halo, were used to identify the member galaxies of each group. At each redshift and for each group halo, optical properties were extracted for its corresponding galaxies from the semi-analytic galaxy catalogue. The model galaxies become incomplete below a magnitude limit of M, due to the limited mass resolution of the Millennium simulation. We applied a -band absolute magnitude cut-off of M on galaxies at all redshifts. During the matching process, for more than 99% of the groups at each redshift, corresponding galaxies were found in the semi-analytic galaxy catalogue. The remaining groups were excluded from our final compiled list.
In order to find the gas properties of all groups at , we cross-correlated our list of groups with the Millennium gas catalogue, and find the bolometric X-ray luminosity of our selected groups at =0.
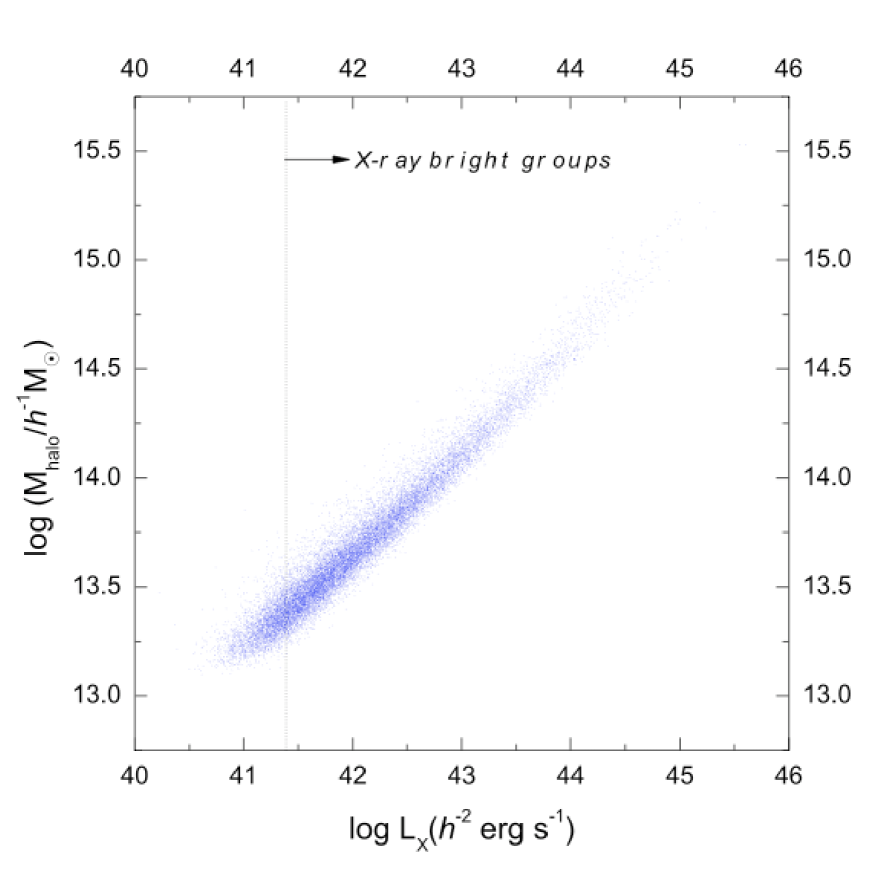
Out of 19066 dark matter group haloes with M⊙ selected at , optical properties from the semi-analytic catalogue (as well as gas properties from the gas simulations at =0) and the entire history of evolution at all redshifts up to =0, were found for 17866 (94% of the initial sample at ) of group haloes. Fig. 1 shows the bolometric X-ray luminosity from the Millennium gas simulation, plotted against the corresponding dark matter halo mass of each group, at redshift =0 for all of the matched 17866 groups.
The vertical dashed line in Fig. 1 corresponds to the conventional X-ray luminosity threshold (erg s-1) for fossil groups (Jones et al., 2003), as adopted in Sec. 4.2.1 to define X-ray bright groups. There are 14628 groups above this threshold, out of 17866 groups. These X-ray bright groups will constitute the main data set for the rest of our analysis, except for §4.1 and §5.3, where the whole range of halo mass will be explored to study the magnitude gap statistics and the local environment of groups,
4 Results
4.1 The -band Magnitude Gap Statistic
The dynamical friction will cause the more luminous galaxies in a group to merge on a time scale which depends upon the velocity dispersion of the group, and since this is more frequent in poorer groups than in clusters (e.g. Miles et al., 2004, 2006). As a result, on group scales, the likelihood of a few of the brightest galaxies merging to form the brightest galaxy, leading to a large magnitude gap within a Hubble time, is higher. Thus, the distribution of the magnitude gap between the brightest galaxy, and the second and third brightest galaxies, in each group, is often used as an indicator the dynamical age of group, particularly in fossil groups (Milosavljević et al., 2006; van den Bosch et al., 2007; Dariush et al., 2007; von Benda-Beckmann et al., 2008).
We determine the magnitude gaps from the Millennium semi-analytic models of Bower et al. (2006) and Croton et al. (2006), and compare them with observational results from the Sloan Digital Sky Survey (SDSS) C4 cluster catalogue data of Miller et al. (2005) and the 2-degree Field Galaxy Redshift Survey (2dFGRS) group catalogue of van den Bosch et al. (2007).
The 2dFGRS group catalogue is constructed based on a halo-based group finder algorithm of Yang et al. (2005) and contains groups within the mass range M where the mass of each group has been determined from the total luminosity of all group members brighter than . The C4 catalogue Miller et al. (2005) consists of clusters identified in the spectroscopic sample of the Second Data Release (DR2) of the SDSS inside the mass range M, estimated from the total -band optical luminosity of cluster galaxies.
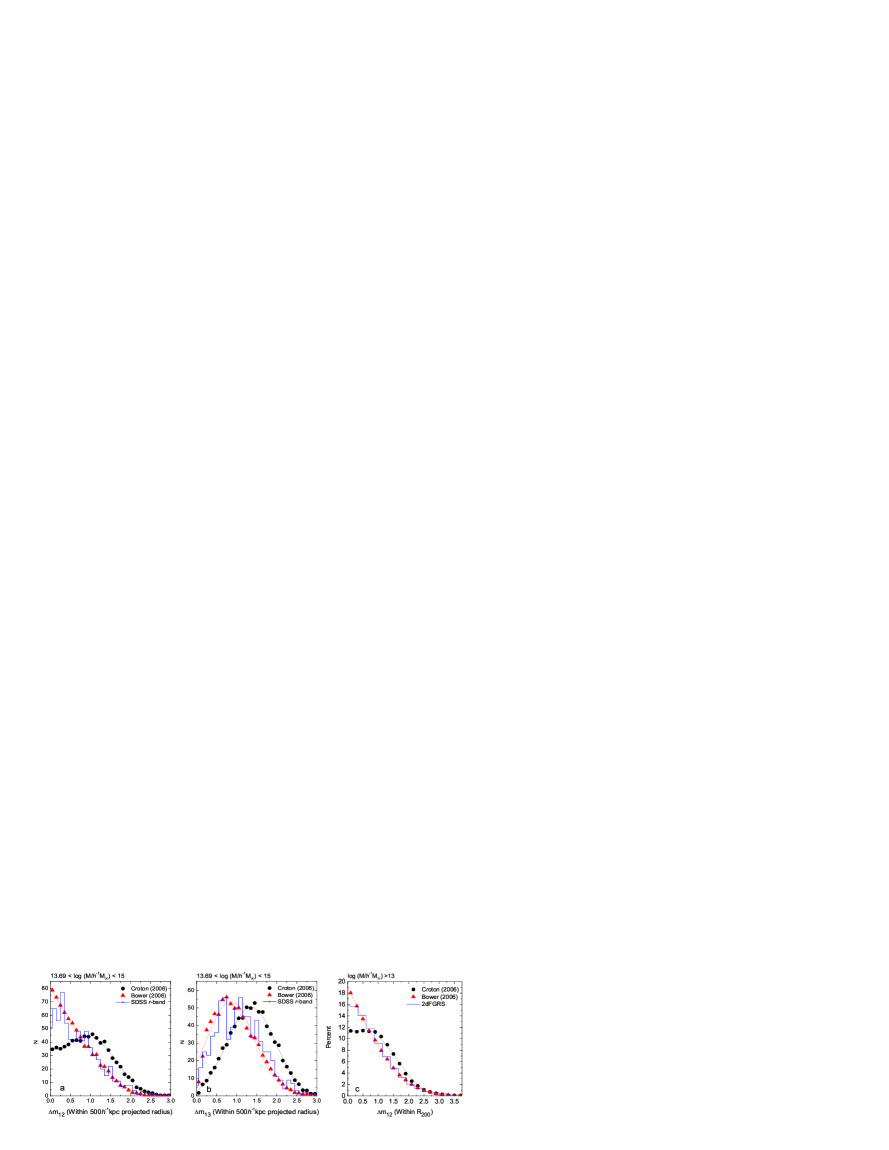
The results of the comparison between our distribution of the estimated -band magnitude gaps from semi-analytic models of Bower et al. (2006) as well as Croton et al. (2006), based on the Millennium simulation (red triangles and black circles respectively), and the observed results from the C4 cluster catalogue and the 2dFGRS group catalogues (blue histogram), are shown in Fig. 2. The magnitude gap statistics and from Bower et al. (2006) are in excellent agreement with those obtained from 2dFGRS group catalogue and SDSS C4 catalogue of clusters. However, the semi-analytic galaxy catalogue of Croton et al. (2006) predicts a larger fraction of groups with for both the SDSS and 2dFGRS samples. This is in particular of great importance to the determination of the space density of fossil galaxy groups, and the comparison of fossil samples drawn from simulated and observed catalogues, which use the magnitude gap as a key discriminant, (e.g., see Table 1 of Dariush et al., 2007).
The shift of the distribution of and to larger values than observed in the Croton et al. (2006) model may reflect the fact that in the Bower et al. (2006) model, the treatment of dynamical friction differs from that used by Croton et al. (2006). In both models, N-body dynamics are used to follow the orbital decay of satellite galaxies whose subhalo can be resolved. However, when the subhalo can no longer be reliably followed, the dynamical friction calculations differ. In the Bower et al. (2006) model, the dynamical friction timescale is initially calculated following Cole et al. (2000). However, if the host halo of the satellite is deemed to undergo a formation event (corresponding to a mass doubling since the previous formation event), before the satellite merges, then a new orbit for the satellite is selected at random, and the dynamical friction timescale for the satellite is recalculated. This calculation takes into account the scattering of galaxies to larger energy orbits during the merger of their parent halo.
Another possible cause for the success of the Bower et al. (2006) model in matching the magnitude gap statistics is that it predicts a large scatter in the relation between galaxy stellar mass and halo mass—significantly more than in the Croton et al. (2006) model. As a result, sometimes rather large satellite haloes arrive carrying relatively small galaxies resulting in a large difference between the magnitude of the dominant object and the next most luminous. This difference occurs because the AGN feedback is not guaranteed to switch off the cooling at a particular halo mass in the Bower et al. (2006) model, as it depends on the merging and cooling history of each halo.
For the purposes of this work, the fact that the Bower et al. (2006) method for computing merging timescales results in good agreement with the observed magnitude gap distributions, makes it well suited for the remainder of our study.
4.2 Evolution of galaxy groups
In cosmological simulations, the age of galaxy groups can be expressed in terms of the rate of the mass assembly of the groups. This means that for a given group halo mass, groups that formed early, assemble most of their masses at an earlier epoch in comparison to younger groups. Thus the assembly time of a dark matter halo, defined as the look-back time at which its main progenitor reaches a mass that is half of the halo’s present day mass, is larger in “older” systems than in “younger” ones. Of course, in cosmological simulations such as the Millennium runs, where the structures in Universe from hierarchically, massive systems which form later turn out to have shorter assembly time than low mass groups. Therefore one should take into account the mass of systems when comparing the mass assembly of various types of groups and clusters.
4.2.1 Fossil groups of galaxies
How is the history of mass assembly of a group or cluster related to its present observable parameters? It is expected that groups which have formed earlier tend to be more dynamically relaxed, thus resulting in a hotter intergalactic medium (IGM) and being more likely to be X-ray luminous (Miles et al., 2004; Forbes et al., 2006). It has been shown that in X-ray luminous systems, the brightest galaxies are bigger and more optically luminous and those belonging to systems that have little or no diffuse X-ray emission (e.g., Khosroshahi et al., 2004). On the other hand, groups with the same mass that have formed late, and are still in a state of collapse, would not show X-ray emission associated with their IGM (Rasmussen et al., 2006; Bai et al., 2010), and are less likely to be dominated by a massive elliptical in their cores.
Hitherto the so-called fossil galaxy groups, which are supposed to be canonical examples of groups that have formed early, have been identified by requiring that their X-ray luminosities exceed erg s-1 (e.g. Khosroshahi, Ponman, & Jones, 2007; Jones et al., 2003). In addition, a fossil group needs to have, within half a virial radius of the group’s centre, the second brightest galaxy to be at least 2-mag fainter than the brightest galaxy, i.e. 111This condition can be replaced by where and are the luminosities of the first two brightest galaxies.. So far these two observational criteria have been jointly used to explore fossil groups and clusters of galaxies. Therefore, Fig. 3, which displays all the X-ray bright groups fulfilling the X-ray criterion in Fig. 1, and the optical criterion (dotted horizontal line) should separate groups which have been formed earlier in comparison to their counterparts with .
Note that, in numerical simulations, fossils are identified as groups with within or . Our results from this study as well as those represented in Dariush et al. (2007) show that the fraction of fossils (and therefore their space densities) depend on the search radius within which is estimated, whereas the history or mass assembly does not change that much.
4.2.2 The mass assembly of X-ray fossil groups
Let us introduce the parameter which for an individual group is the ratio of its mass at redshift to its final mass at , i.e. . Thus at a given redshift , groups with larger have assembled a larger fraction of their final mass by than groups with smaller values of .
In Fig. 3, we plot the magnitude gap (within ), estimated for all 14628 X-ray bright groups (i.e. groups with erg s-1) at as a function of their mass fraction at . Groups are colour-coded according to their dark matter halo mass. The horizontal dashed line separates groups into fossils () and non-fossils (). All data points on the right side of the vertical dashed-line have assembled more than 50% of their mass by 1.0 and hence have a minimum assembly time of about 7.7 Gyr. The contour lines represent the number of data points (groups) in each of cells of an overlaid grid which is equally spaced along both the horizontal and vertical axes.
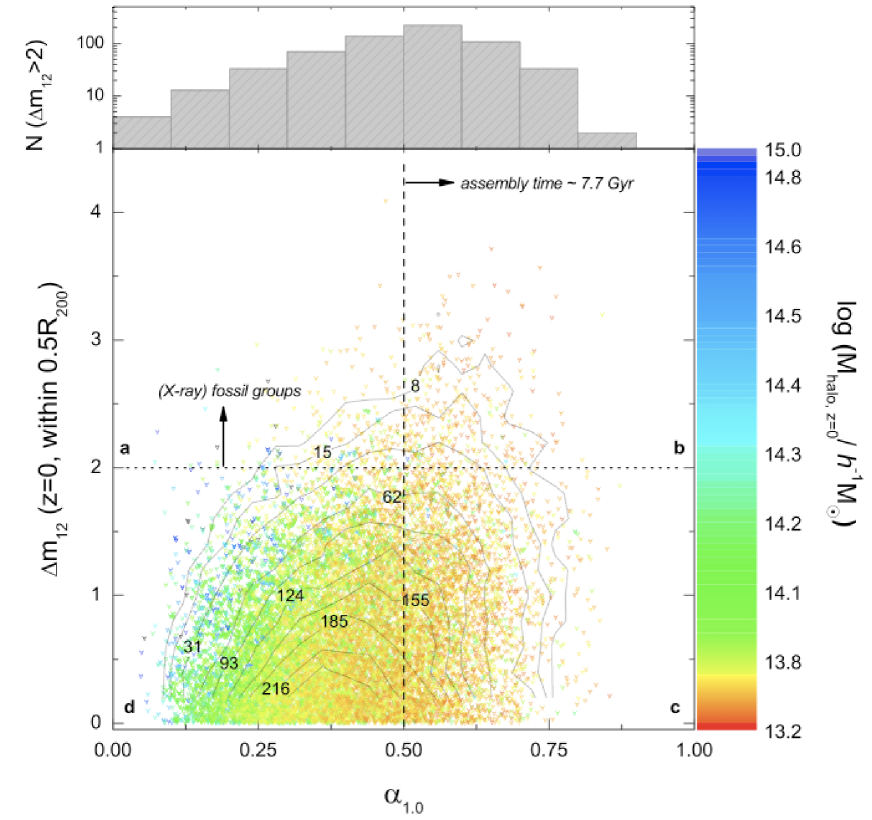
Three results emerge from this plot: (i) As is expected, on average the rate of mass growth in massive systems is higher than in low mass groups as the majority of massive groups and clusters have assembled less than 50% of their final mass at 1.0. (ii) Less massive groups (and therefore early-formed ones) tend to develop larger magnitude gaps in comparison to massive groups and clusters. Consequently the fraction of massive fossils, identified in this way, is less than low mass fossil groups. (iii) For any given , the majority of groups have magnitude gaps , as is evident from the density of contours. In other words, the number of early-formed groups with values of exceeds the number of fossil groups with .
Unlike the first two results, the third conclusion is not in agreement with our current view that early-formed groups necessarily develop larger magnitude gaps. Clearly, the majority of groups with similar values of have smaller magnitude gaps. Without doubt, the parameter is influenced by the infall and merging of galaxies and sub-groups within galaxy groups. This could result in the increase (in case of merging) or decrease (in case of the infalling of new galaxies) in . Indeed, in the work of von Benda-Beckmann et al. (2008), one finds that the “fossil” phase of any fossil group is transient, since the magnitude gap criterion will sooner or later be violated by a galaxy comparable to the brightest galaxy falling into the core of the group.
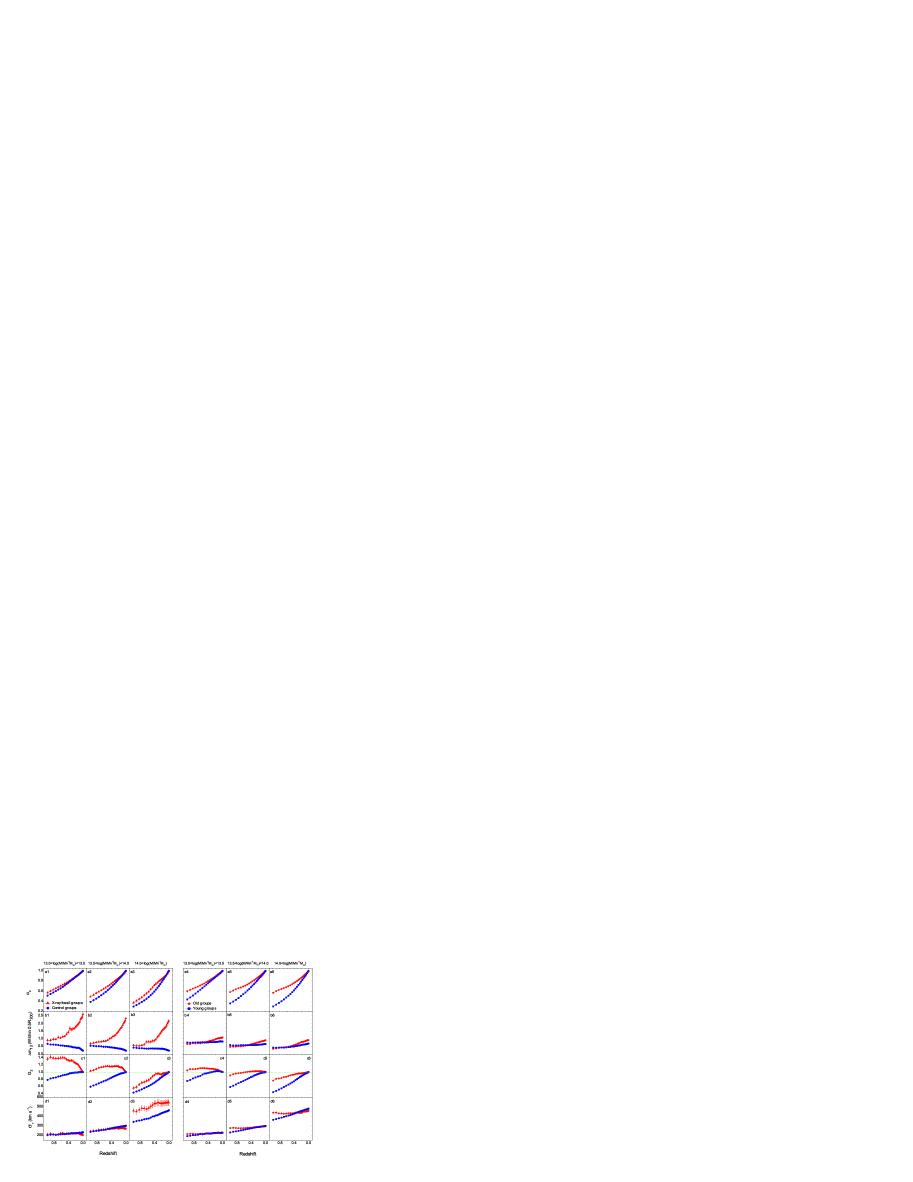
To quantify the above results, we study the evolution with redshift of various physical parameters for two different sample of groups, drawn from the distribution of galaxy groups in Fig. 3. In the first sample, haloes are divided into old(, in Fig. 3) and young (, in Fig. 3) groups respectively. In the second population, haloes are classified as X-ray fossil (, in Fig. 3) and control (, in Fig. 3) groups based on the magnitude gap between the first and the second brightest galaxies within half a virial radius of the centre of the group.
For each sample, the evolution of various parameters are shown in two panels of Fig. 4. From top to bottom these parameters are:
-
•
, i.e. the ratio of the group halo mass at redshift to its mass at ,
-
•
within 0.5,
-
•
Ratio of the number of galaxies within at redshift of a given galaxy group to the number of galaxies within at redshift of the same group, i.e. ,
-
•
Group velocity dispersion in km s-1.
In each panel of Fig. 4, the left, middle, and right columns correspond to different ranges in group mass, as indicated. The left panel in Fig. 4 illustrates X-ray fossil (red triangles) and control (blue circles) groups respectively while the right panel shows old (red stars) and young (blue squares) groups. The horizontal green dashed-lines intersect y-axes at . Errors on data points are the standard error on the mean, i.e. , where is the standard deviation of the original distribution and is the sample size.
A comparison between Figs. 4 and Figs. 4 shows that older groups, which have been picked up according to their lower rate of mass growth (i.e. larger ), represent a perfect class of fossils, though they develop a magnitude gap which is not as large as those seen in X-ray fossils (see also Figs. 4).
On the other hand, unlike old groups, X-ray fossils develop large magnitude gaps, which do not necessarily correspond to their rapid mass growth, especially in massive groups with M. This reflects the fact that the majority of real passive groups have a small magnitude gap between their two brightest galaxies. Thus the expression only partially separates genuine old/passive groups from young/forming groups, as there are a larger fraction of genuine old groups but with small .
From Figs. 4, it is obvious that older groups are essentially more relaxed systems, which have not recently experienced a major merger, as the rate of infall of galaxies is equal or even less than the rate at which galaxies merge with the central group galaxy. Therefore in old groups the parameter is more or less constant with time, compared to that of the younger groups within the same group mass bin. The situation is a bit different in X-ray fossils with M (Figs. 4), since, in these cases, the rate of galaxy merging is noticeably larger than that of the infall of galaxies. As a result, very large magnitude gaps can develop in X-ray fossil groups. It is also evident both massive X-ray fossils and control groups with M (Fig. 4) are in a state of rapid mass growth. As a consequence, massive X-ray groups are not dynamically relaxed systems as they are influenced by infall of galaxies and substructures.
Finally, it is worth considering how the velocity dispersion, plotted in Figs. 4 changes with time in the different kinds of groups. As Figs. 4 show, as long as the rate of infall of subgroups is close to 1.0 (green dashed-line), the velocity dispersion does not significantly change with time, which in turn is a sign that these groups are certainly relaxed systems.
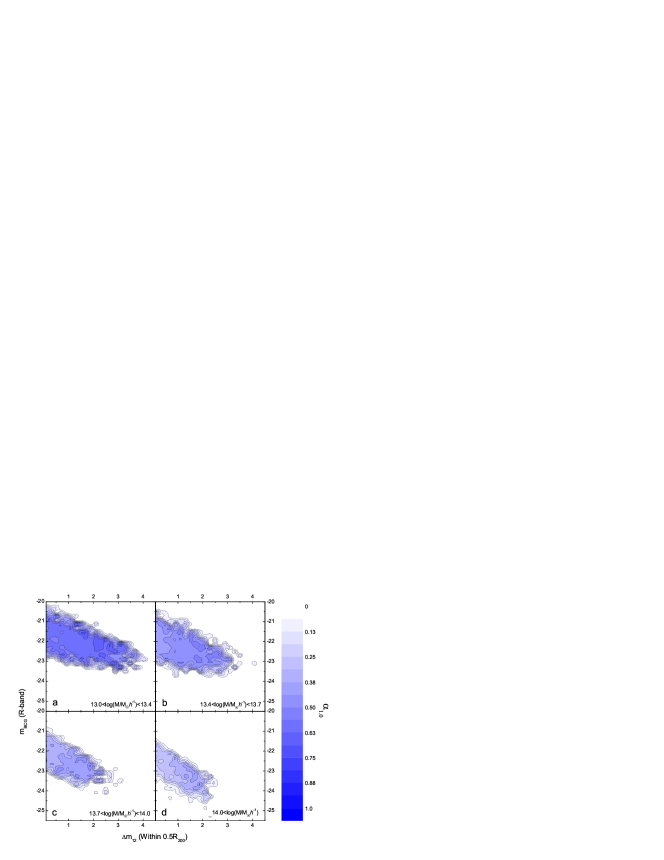
4.2.3 BCG magnitudes
Since the central galaxy in a fossil group is a product of numerous mergers, many of them with luminosities close to L⋆ galaxies, X-ray fossils are expected to be dominated by optically luminous brightest galaxies (BCGs) more often than their non-fossil counterparts. Here we explore the correlation between the luminosity of the central galaxies of groups with large magnitude gaps, and their mass assembly history.
The four panels in Fig. 5 demonstrate the relation between the absolute -band magnitude of the BCGs for all X-ray bright groups and the magnitude gap within in four different mass bins. In each panel of Fig. 5, a grid of cells is overlaid, where each cell is colour-coded according to the median of in that cell. Accordingly, contours in each panel trace the distribution of median values.
Fig. 5 shows clearly that both and BCG -band magnitudes increase with decrease in group halo masses. But it does not show a tight correlation between the R-band luminosity of BCGs and group magnitude gaps , though the correlation is more pronounced in clusters with M⊙ (Fig. 5d). Therefore, imposing a magnitude cut for the BCGs would result in the loss from the sample of a large number of genuine groups which are not X-ray fossil systems according to the optical condition involving .
4.3 The Fossil phase in the life of groups
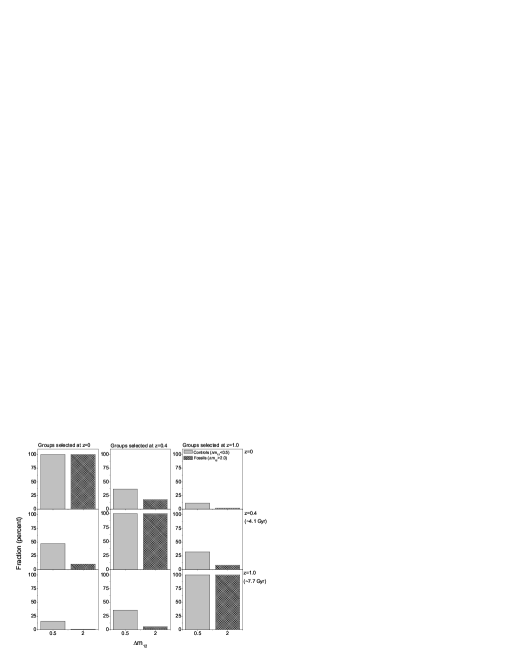
The existence of large magnitude gaps in X-ray fossils in Figs. 4 is expected as these groups were initially selected according to their at =0. It would be interesting if they could be shown to have maintained such large magnitude gaps for a longer time, in comparison to control groups, which would be the case if X-ray fossils were relaxed groups without recent major mergers. Also if fossil groups in general are the end results of galaxy merging, then we do expect the majority of fossils selected at higher redshifts to still be detected as fossils at the present epoch. In other words, the fossil phase in the life of a galaxy group should be long-lasting.
To test this, we select three sets of fossil groups with at three different redshifts. By tracing the magnitude gap of each set from =1.0 to =0, we examine the fossil phase of each set in time. In Fig. 6, fossils (black shaded histogram) and control (black thick line histogram) groups are selected at =0 (left column), =0.4 (middle column), and =1.0 (right column). Fractions of fossil and control groups in each column of Fig. 6 have been separately estimated by normalising the number of fossil and control groups at other redshifts to their total numbers at the redshift at which they were initially selected.
This plot shows that, contrary to expectation, no matter at what redshift the fossils are selected, after 4 Gyr, more than 90% of them change their status and become non-fossils according to the magnitude gap criterion. Over the span of 7.7 Gyr, which is the time interval between 0-1, very few groups retain a two-magnitude gap between the two brightest galaxies. This means that the fossil-phase is a temporary phase in the life of fossil groups (also see von Benda-Beckmann et al., 2008), and there is no guarantee that an observed fossil group, at a relatively high redshift, remains a fossil until the present time, if fossils are selected according to their magnitude gap .
5 Revising the Optical Criterion for finding fossil groups
Using the Millennium simulation DM runs as well as the gas and semi-analytic galaxy catalogues based on them, it seems from the above that the conventional optical condition , used to classify groups as fossils, does not ensure that that these systems represent a class of old galaxy groups, in which the central galaxy has grown through the merging of other comparable group galaxy members. Having said that, it is true that the magnitude gap in a galaxy group is related to the mass assembly history of the group, for we saw that in groups, such a gap develops gradually with time. However, the difference between the luminosities of the two brightest galaxies in groups is not always reliable for the identification of fossil systems, as this quantity is vulnerable to the assimilation of a comparable galaxy into the core of the group, as a result of infall or merger with another group.
We therefore attempt to identify a more robust criterion, in terms of the difference of optical magnitudes among the brightest galaxies in a group, which might be better suited to identifying systems where most of the mass has been assembled at an early epoch. As introduced in Sec. 4.2.2, we quantify the age of a group in terms of the mass assembly parameter , which for an individual group is the ratio of its mass at redshift to its present mass at , i.e. . We begin by considering the effect of the radius within which the magnitude gap is calculated.
5.1 A general criterion for the magnitude gap
Assume a general optical condition in defining early-formed groups according to the magnitude gap between the brightest group galaxy and other group members in the following form:
| (1) |
where is the difference in -band magnitude between the first brightest group galaxy and the brightest group galaxy within 0.5R200 (or R200) of the group centre. The current definition of fossils involves and . Obviously any group satisfying Eq. 1 must contain at least galaxies. We do not consider since then we have to exclude most groups in our sample, and it would turn out not be very useful for observers as well.
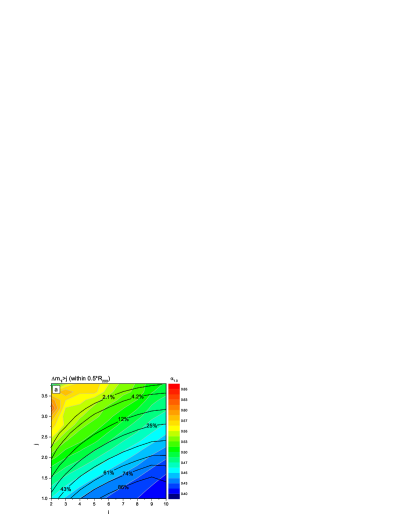
As we consider the magnitude gap between the brightest to the (=2, 3,…, 9, 10) brightest galaxy, the value of the magnitude gap varies from 0 to 5. Our aim is to find a pair of (, ) in Eq. 1 which yields the best selection of genuinely old groups with a history of early mass assembly.
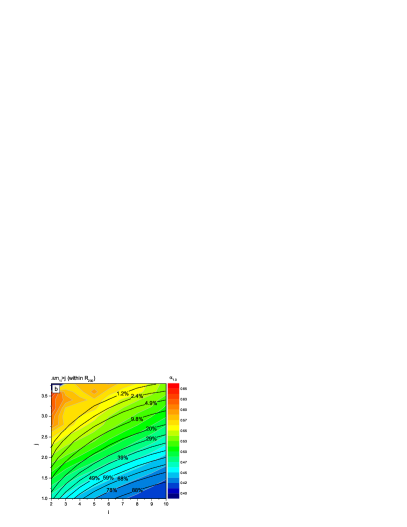
In Fig. 7, we show how the parameter , which represents the mass assembly of groups since redshift =1.0, depends upon the selection of and in Eq. 1. For each value of in Fig. 7, groups are first sorted according to their magnitude gaps estimated within 0.5R200 or R200), where the latter is the overdensity radius of the group. For each , the average value for is calculated, for each value of , for all groups satisfying Eq. 1. The plot is colour-coded according to the values of . The black contours give an idea of the number of groups involved: the fraction of the total number of groups identified by parameters (, ) is constant along each of these lines.
From Fig. 7a, for instance, we find that systems with and , i.e. systems for which (within 0.5R200), yield 2.4 of groups with 0.54. The same is 1.2 with 0.56, if one estimates within R200 according to Fig. 7b.
In fact, by changing our search radius from 0.5R200 to R200, we find 50 fewer groups satisfying Eq. 1, for the same value of . Therefore, hereafter, we just use Panel a of Fig. 7 which estimates the magnitude gap within half of the overdensity radius, i.e. 0.5R200. From this plot, the fraction of groups picked out by applying the conventional fossil criterion is 4.0 with 0.52.
If we were to find an improved criterion for finding fossils, a better set of parameters (, ) in Eq. 1 should
-
1.
identify groups with larger valuer of , and/or
-
2.
find a larger fraction of groups with the same or larger value of ,
than found in conventional fossils, i.e. groups with (, )=(2, 2).
For example, by choosing and , the fraction of groups found with turns out to be 40 less than when ==2, but it would identify slightly older groups, with an average 0.55, whereas the average 0.52 in fossils with ==2. In other words, (, )=(4, 3) identifies marginally older groups, at the expense of losing a large number of early-formed groups, compared to the case of conventional fossils (, )=(2, 2).
Exploring Fig. 7a, we adopt (, )=(4, 2.5) as an example of how the fossil search criterion can be improved. If we define all groups with within as fossils, then the we would find groups with on average the same mass assembly history, i.e, the same average value of , but we would identify 50 more such groups, compared to groups identified the conventional parameters (, )=(2, 2).
We will examine such groups further in the next section. Meanwhile, the Figs. 7 will allow the user to find their favourite combination of (, ) for both 0.5R200 and R200.
| Group type | |||
|---|---|---|---|
| Panel a | Panel b | Panel c | |
| All X-ray bright groups | |||
| F12 | |||
| F14 | |||
| F12 F14 |
5.2 The optical criterion within 0.5R
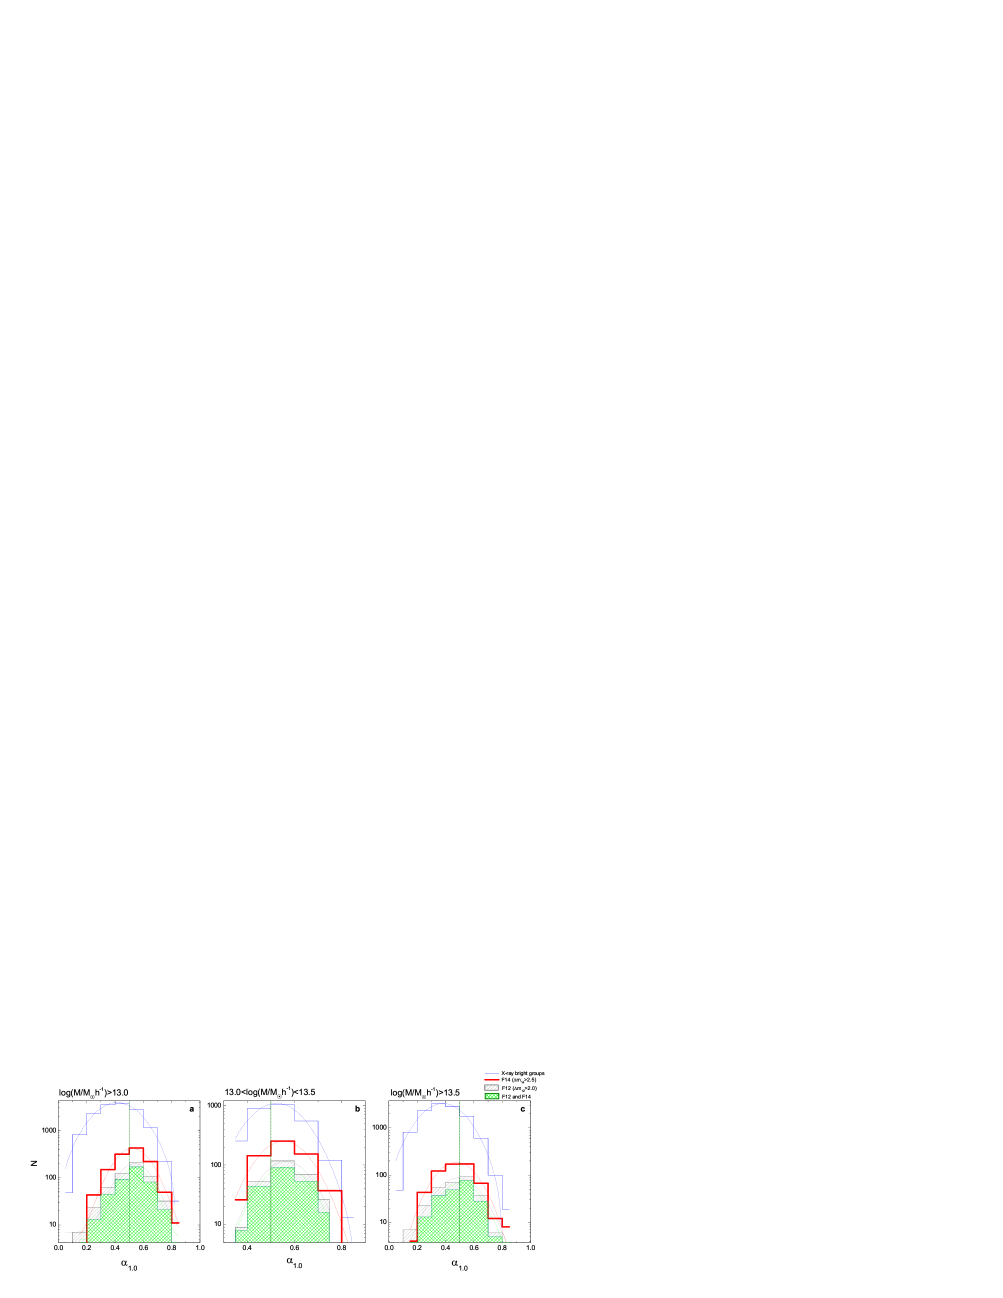
Having explored alternative criteria for identifying groups with a history of early formation, we now compare the history of mass assembly of groups selected according to (these groups are hereafter collectively referred to as F14) with those groups selected according to (hereafter F12), both within 0.5R200 of the group centre. The latter category are the conventional fossil groups.
The blue histogram in Fig. 8 represents the distribution of the mass assembly parameter for all X-ray bright groups (as defined in Fig. 1) in our sample. It also shows the groups in the categories F14 (red thick histogram) and F12 (grey shaded histogram). The green shaded histogram corresponds to groups that satisfy both criteria, i.e. F12 F14. The green dash dotted line intersects the x-axis at , representing groups for which half of their mass had been assembled at redshift . Gaussian fits to each histogram are overlaid.
Panels a, b, and c in Fig. 8 correspond to different ranges of the logarithm of the group halo mass , , and respectively, where is in units of M⊙. These figures, as well as the values of the peaks of Gaussian fits to the distribution of in each case (given in Table 1) lead to the following observations:
-
1.
The groups belonging to F12 and F14 are older than the overall population of X-ray bright groups (for all values of halo mass), though such a difference is less pronounced in low-mass systems. Since haloes are thought to be hierarchically assembled, one expects to find a higher incidences of early-formed and low-mass groups in comparison to massive systems.
-
2.
Within the errors, groups belonging to F14 are almost as old as F12, i.e. the estimated in F12 systems (as given in Table. 1) is more or less the same as found in F14 systems. However, the fraction of groups in category F14 is at least 50 more than F12. This tells us that in general, the criterion has a higher efficiency of identifying early-formed systems than .
-
3.
Interestingly, of F12 haloes in Fig. 8a also fulfil the condition. Conversely, of F14 haloes satisfy the criterion. This means that a large proportion of the population of early-formed groups in the category F14 is different from those in F12. Groups which satisfy both criteria, i.e. F12 F14, are not necessarily older in comparison to those belonging to either F12 or F14 (see Table. 1).
-
4.
Fig. 8b shows that in fact neither criterion nor is efficient in finding early-formed groups in low-mass regime, even among X-ray bright groups.
In the following section, we compare the environment and abundance of the groups belonging to the F12 and F14 categories.
5.3 The local environment of fossil groups
If galaxy mergers are responsible for the absence of bright galaxies in groups such as X-ray bright fossils, then most of the matter infall into these systems would have happened at a relatively earlier epoch. Consequently, at the present time, old groups should be more isolated than groups which have recently formed (e.g. La Barbera et al., 2009). Here we examine the local environment of groups, using the density parameter , defined as the number of haloes within a distance of Mpc from the centre of each group. The the local densities are calculated at according to
| (2) |
where is the number density of haloes within a spherical volume of of 4 Mpc in radius, and is the background density of haloes within the whole volume of the Millennium simulation. Since the mass assembly of groups is mostly influenced by the infall of subgroups, which individually have masses typically below 10% (and often substantially smaller) of the parent halo mass, it is important to take into account all haloes with M⊙ from the FoF group catalogue in order to estimate .
From Gaussian fits to the histograms of the local density of F12 and F14, control groups, as well as those of all X-ray bright groups, we find
| (3) |
where is estimated using Eq. 2. It seems that both F12 and F14 groups are more likely to lie in lower density regions than control groups and X-ray bright groups. This is in agreement with our expectation as early-formed groups are assumed to be in low-density local environments. However, the local density around F12 and F14 groups is more or less the same. This is consistent with the fact that F12 and F14 have similar values of (see Table 1).
A similar trend is seen for density measures and , but as the sampling volume increases (), the above trend disappears, showing that the trend is related to the immediate environment of groups.
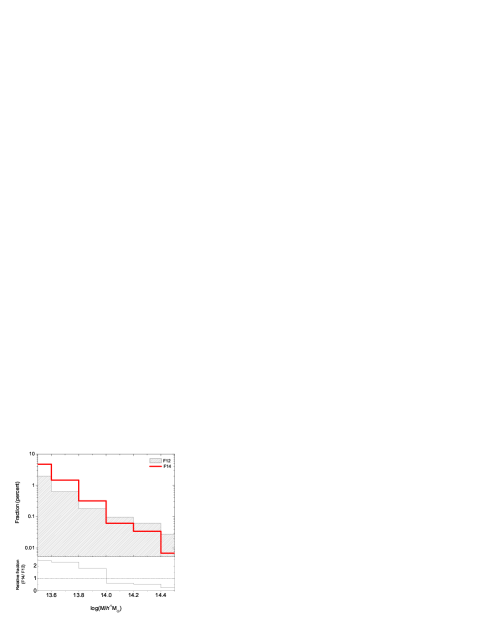
5.4 The abundance of fossil groups
Various studies have shown that the fraction of early-formed groups increases as the group halo mass decreases (e.g. Milosavljević et al., 2006; Dariush et al., 2007). This phenomenon reflects the fact that structures form hierarchically, where small virialised groups form early, whereas most massive clusters form late. As the merging of galaxies in clusters is less efficient than in groups, due to the high velocity dispersion of cluster galaxies, clusters are less likely to develop large magnitude gaps. At the same time, in low-mass groups (see,e.g., Miles et al., 2004, 2006) dynamical friction is more effective in ensuring galaxies fall to the core of the system, due to the smaller relative velocities involved. As a result, the existence of large magnitude gaps should be more frequently found in groups than in clusters. Thus, to find an old population of groups according to some criterion, and to study the way the criterion depends on group halo mass, would be a good test for the validity of the condition.
The top panel of Fig. 9 displays the abundance of F12 (gray shaded histogram) and F14(red thick line) groups, defined as the fraction of haloes in each category, as a function of halo mass. The range of halo mass explored is in units of M⊙. Below this mass limit, the number of groups abruptly decrease, since all groups here have been chosen to be X-ray bright groups (see Fig. 1).
The plot shows that in comparison to the F12 groups, the F14 groups are populated by less massive haloes. This can be better seen in the bottom panel of Fig. 9, where the relative fraction of F14 groups over F12 is shown. It can be inferred that, on average, the fraction of F14 groups with halo mass M⊙ is at least 50 more than the fraction of F12 . However, in the mass range M⊙, the fraction of F14 groups decreases, though since the overall numbers in the extremely high mass range are low, the statistics are poorer.
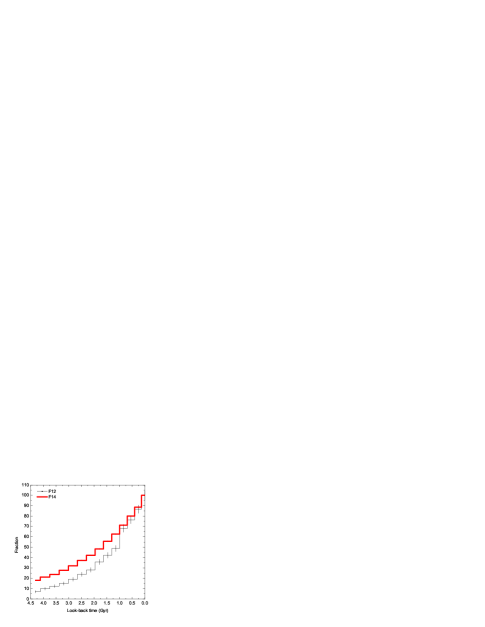
5.5 The survival of the magnitude gap: F12 vs. F14
In Sec. 4.3, it was found that, in general, for the conventional fossil groups (F12), the fossil phase is transient, % of such groups ceasing to remain fossils after 4 Gyr. Here we examine whether the fossil phase in groups fares better.
The histograms in Fig. 10 represent the fractions of F12 (black line) and F14 (thick red line), as a function of look-back time in Gyr. The plot shows that in comparison to the F12 groups, the fossil phase lasts longer by almost 1 Gyr for the same fraction of F14 groups. For example, the fraction of F12 groups that maintains its magnitude gap after 2.2 Gyr, falls to 28, while the corresponding period is 3.2 Gyr in F14. Thus, not only does the condition identify at least 1.5 times as many fossil groups as the F12 condition, it also identifies groups in which the fossil phase lasts significantly longer. This can be explained from our analysis of the halo mass distribution within F12 and F14, already discussed in Sec. 5.4.
5.6 Comparison with observed groups
When making detailed comparisons between simulations and catalogues of galaxies and groups compiled from observations, one has to be aware that simulated dark matter haloes have limited resolution, as mentioned in § 2.2.1 and 2.2.2. This means that all galaxies in the semi-analytic models, assigned to a particular halo, might not belong to dark matter subhalos. We find that even after applying a magnitude cut, there would be a significant number of modelled galaxies, whose orbits are analytically calculated, that would end up being not a member of a sub-halo, and thus would not be classified as a group member.
While dealing with magnitude gaps and , it is worth examining to what extent these quantities are vulnerable to resolution effects like the above. A direct way would be to compare the magnitude gap distribution of groups, selected based on their , between simulations and observations. This is not a straightforward task, as groups identified from observational sky surveys are biased due to incompleteness in measured magnitude and redshift. Furthermore, a variety of group finding algorithms are been adopted to identify groups in simulations and observation, which adds uncertainties to any such comparison.
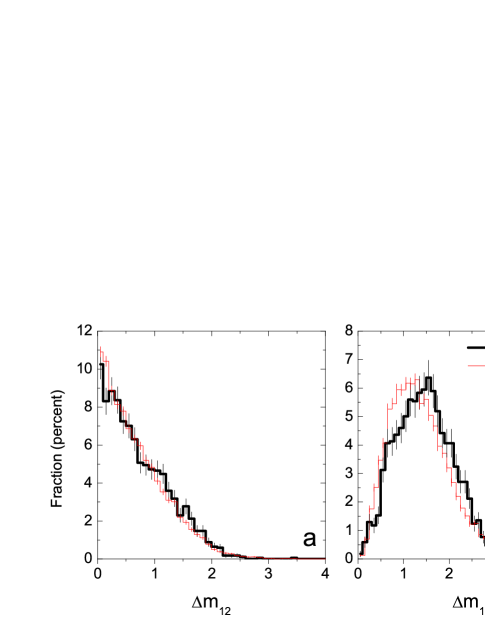
Here, we use the group catalogue of Yang et al. (2007), which uses a halo-based group finder on the Sloan Digital Sky Survey (SDSS DR4). They define groups as systems whose dark matter haloes, have an overdensity of 180, determined from dynamics. This makes this catalogue suitable for comparison with the Millennium simulation, where dark matter halos have an overdensity of 200. From Sample II of the catalogue, groups with following properties are selected:
-
•
they have at least four members,
-
•
they are within the redshift range , and
-
•
their estimated halo mass is M⊙, since our Millennium X-ray groups have a similar mass threshold (see Fig. 1).
After applying the above criteria, 1697 groups were identified, and their magnitude gaps were compared with galaxy groups selected from the Millennium simulation at redshift . The magnitude gap distributions from both SDSS-DR4 as well as the Millennium simulation are shown in Fig. 11. Panels a and b of Fig. 11 refer to the magnitude gap distribution and respectively. Results show that the estimated magnitude gaps are in fair agreement with observation. The fraction of groups with is more or less the same while the fraction of those galaxy groups with is different by (see Table. 2). This shows that the incompleteness resulting from limited resolution does not affect our statistics.
6 Discussion and conclusions
In this work, we analysed the evolution of the magnitude gap (the difference in magnitude of the brightest and the th brightest galaxies) in galaxy groups. Using the Millennium dark matter simulations and associated semi-analytical galaxy catalogues and gas simulations, we investigated how the magnitude gap statistics are related to the history of mass assembly of the group, assessing whether its use as an age indicator is justified.
A catalogue of galaxy groups, compiled from the Millennium dark matter simulations, was cross-correlated with catalogues resulting from hot gas simulations, and from semi-analytic galaxy evolution models based on these simulations. This resulted in a list of groups, with various properties of the associated dark matter haloes and galaxies, at 21 time steps, over the redshift range to . The simulated X-ray emitting hot IGM properties were known for these haloes only for , and these were used to define a sample of X-ray emitting groups. This is necessary since our objective was to examine the evolution of fossil groups, which are observationally defined in terms of both optical and X-ray parameters.
We compared the estimated magnitude gaps in these galaxy groups from two different semi-analytic models of Bower et al. (2006) and Croton et al. (2006), based on the Millennium dark matter simulations, and found that the model of Bower et al. (2006) better matches the observed present-day distribution of the difference in magnitude between the brightest galaxy in each group, and the second and third brightest galaxies and . We decided to use the Bower et al. (2006) catalogue for the rest of this study.
We examined the evolution with time of fossil galaxy groups, conventionally defined as those with an -band difference in magnitude between the two brightest galaxies (within of the group centre). We explored the nature of the groups that would be selected if the radius of the group were extended to , and the definition of the magnitude gap in terms of were varied. Our major conclusions from the analyses can be summarised as follows:
-
1.
The parameter defined for a galaxy system as the magnitude gap between the first and brightest galaxies (estimated within a radius of 0.5R200 or R200) can be shown to be linked to the halo mass assembly of the system (Fig. 7), such that galaxy systems with larger magnitude gaps are more likely to be early-formed than those with smaller magnitude gaps.
-
2.
Fig. 6 shows that, contrary to expectation, irrespective of the redshift at which fossil groups are identified according to the usual criteria, after 4 Gyr, more than 90% of them become non-fossils according to the magnitude gap criterion. Over the span of 7.7 Gyr, which is the time interval between 0-1, very few groups retain a two-magnitude gap between the two brightest galaxies. This provides clear evidence that the fossil phase is a temporary phase in the life of fossil groups (also see von Benda-Beckmann et al., 2008).
-
3.
In a given galaxy group, the merging of the brightest (or a brighter) galaxy, with the brightest galaxy in the group (often the central galaxy if there is one), results in an increase of . However, one of the main reasons for the fossil phase to be a transient one is that such a magnitude gap could be filled by the infall of equally massive galaxies into the core of the group, which would lead to a decrease in . Therefore, groups with smaller magnitude gaps are not necessarily late-formed systems. Many groups spend a part of their life in such a fossil phase, though an overwhelming majority of them would not fulfil the criteria of the “fossil” label at all epochs.
-
4.
For our sample of X-ray bright groups, the optical criterion in the -band is more efficient in identifying early-formed groups than the condition (for the same filter), and is shown to identify at least more early-formed groups. Furthermore, for the groups selected by the latter criterion, the fossil phase in general is seen on average to last Gyr more than their counterparts selected using the conventional criterion.
-
5.
Groups selected according to at correspond to of those identified using the criterion. On comparing different panels in Fig. 8, one finds that early-formed groups identified from their large magnitude gaps (either or ) represent a small fraction (18% for F14 and 8% for F12) of the overall population of early-formed systems. This is especially noticeable in the high-mass regime.
-
6.
Finally, Fig. 9 shows that in comparison to conventional fossils (i.e. F12 groups), the F14 groups identified based on , predominantly correspond to systems with halo masses M⊙.
This makes the criterion marginally more efficient than in identifying massive early-formed systems.
These results depend to some extent on the employed semi-analytic model in our current analysis, and the statistics might change if one uses different semi-analytical model of galaxy formation.
Physical prescriptions such as galaxy merging, supernova and AGN feedback used in such models are somewhat different from one another. Furthermore, superfluous mergers may result from the algorithm used for the identification of haloes in the Millennium DM simulation, and this may affect the merger rates calculated from various studies, including ours, using these catalogues (e.g. Genel et al., 2009). Though merging is the most important process affecting galaxies in groups, there are other physical processes such as ram pressure stripping, interactions and harassment, group tidal field, and gas loss, that are not fully characterised by current semi-analytic models.
This is partially due to the limited spatial resolution of the Millennium simulation. The new release of the current simulation, i.e. Millennium-II Simulation might help to address some of the above issues. The latter has 5 times better spatial resolution and 125 times better mass resolution (Boylan-Kolchin et al., 2009). Future semi-analytic models based upon high resolution simulations, incorporating such effects would be worth employing in a similar investigation to find better observational indicators of the ages of galaxy groups and clusters.
Acknowledgments
The Millennium Simulations used in this paper was carried out by the Virgo Supercomputing Consortium at the Computing Center of the Max-Planck Society in Garching. The semi-analytic galaxy catalogues used in this study are publicly available at http://galaxy-catalogue.dur.ac.uk:8080/MyMillennium/. The Millennium Gas Simulations were carried out at the Nottingham HPC facility, as was much of the analysis required by this work. The SDSS-DR4 group catalogue of Yang et al. (2007) used in this study is publicly available at http://www.astro.umass.edu/ xhyang/Group.html.
References
- Bai et al. (2010) Bai, L., Rasmussen, J., Mulchaey, J.S., Dariush, A., Raychaudhury, S., Ponman, T.J., 2010, ApJ, submitted
- Balogh et al. (2008) Balogh, M.L., McCarthy, I.G., Bower, R.G., Eke, V.R., 2008, MNRAS, 385, 1003
- Barnes (1989) Barnes, J.E., 1989, Nature, 338, 123
- Baugh (2006) Baugh C. M., 2006, RPPh, 69, 3101
- Borgani et al. (2006) Borgani S., et al., 2006, MNRAS, 367, 1641
- Bower et al. (2006) Bower, R.G. et al., 2006, MNRAS, 370, 645
- Boylan-Kolchin, Ma & Quataert (2008) Boylan-Kolchin, M., Ma, C.-P., Quataert, E., 2008, MNRAS, 383, 93
- Boylan-Kolchin et al. (2009) Boylan-Kolchin, M., Springel, V., White, S.D.M., Jenkins, A., Lemson, G., 2009, MNRAS, 398, 1150
- Cole et al. (2000) Cole, S.M. et al., 2000, MNRAS, 319, 168
- Croton et al. (2006) Croton, D.J., Springel, V., White, S.D.M., De Lucia, G.; Frenk, C. S.; Gao, L.; Jenkins, A., Kauffmann, G., Navarro, J. F. & Yoshida, N., 2006, MNRAS, 365, 11
- Dariush et al. (2007) Dariush, A., Khosroshahi, H.G., Ponman, T.J., Pearce, F., Raychaudhury, S., Hartley, W., 2007, MNRAS, 382, 433
- Díaz-Giménez, Muriel, & Mendes de Oliveira (2008) Díaz-Giménez E., Muriel H., Mendes de Oliveira C., 2008, A&A, 490, 965
- D’Onghia et al. (2005) D’Onghia E., Sommer-Larsen J., Romeo A. D., Burkert A., Pedersen K., Portinari L., Rasmussen J., 2005, ApJ, 630, L109
- Eigenthaler & Zeilinger (2009) Eigenthaler P., Zeilinger W. W., 2009, AN, 330, 978
- Forbes et al. (2006) Forbes D. A., et al., 2006, PASA, 23, 38
- Genel et al. (2009) Genel S., Genzel R., Bouché N., Naab T., Sternberg A., 2009, ApJ, 701, 2002
- Harker et al. (2007) Harker, G., et al., 2006, MNRAS, 367, 1039
- Hartley et al. (2008) Hartley W. G., Gazzola L., Pearce F. R., Kay S. T., Thomas P. A., 2008, MNRAS, 386, 2015
- Jetha et al. (2008) Jetha N. N., Hardcastle M. J., Babul A., O’Sullivan E., Ponman T. J., Raychaudhury S., Vrtilek J., 2008, MNRAS, 384, 1344
- Jetha et al. (2009) Jetha N. N., Khosroshahi H., Raychaudhury S., Sengupta C., Hardcastle M., 2009, arXiv, arXiv:0909.0221
- Jones et al. (2003) Jones, L.R. et al., 2003, MNRAS, 343, 627
- Khosroshahi, Jones, & Ponman (2004) Khosroshahi H. G., Jones L. R., Ponman T. J., 2004, MNRAS, 349, 1240
- Khosroshahi et al. (2004) Khosroshahi H. G., Raychaudhury S., Ponman T. J., Miles T. A., Forbes D. A., 2004, MNRAS, 349, 527
- Khosroshahi, Ponman, & Jones (2006) Khosroshahi H. G., Ponman T. J., Jones L. R., 2006, MNRAS, 372, L68
- Khosroshahi, Ponman, & Jones (2007) Khosroshahi, H.G., Ponman, T.J., Jones, L.R., 2007, MNRAS, 377, 595
- La Barbera et al. (2009) La Barbera F., de Carvalho R. R., de la Rosa I. G., Sorrentino G., Gal R. R., Kohl-Moreira J. L., 2009, AJ, 137, 3942
- Mahajan & Raychaudhury (2009) Mahajan S., Raychaudhury S., 2009, MNRAS, 400, 687
- Malbon et al. (2007) Malbon, R.K., et al., 2007, MNRAS, 382, 1394
- Miles et al. (2004) Miles T. A., Raychaudhury S., Forbes D. A., Goudfrooij P., Ponman T. J., Kozhurina-Platais V., 2004, MNRAS, 355, 785
- Miles et al. (2006) Miles T. A., Raychaudhury S., Russell P. A., 2006, MNRAS, 373, 1461
- Miller et al. (2005) Miller, C.J. et al., 2005, AJ, 130, 968
- Milosavljević et al. (2006) Milosavljević, M., Miller, C.J., Furlanetto, S.R. & Cooray, A., 2006, ApJ, 637, L9
- Nolan, Raychaudhury, & Kabán (2007) Nolan L. A., Raychaudhury S., Kabán A., 2007, MNRAS, 375, 381
- Ponman et al. (1994) Ponman, T.J., Allan, D.J., Jones, L.R., Merrifield, M. & MacHardy, I.M., 1994 Nature, 369, 462
- Rasmussen et al. (2006) Rasmussen, J., Ponman, T.J., Mulchaey, J.S., Miles, T.A. & Raychaudhury, S., 2006, MNRAS, 373, 653
- Sales et al. (2007) Sales, L.V., Navarro, J.F., Lambas, D.G., White, S.D.M. & Croton, D.J., 2007, MNRAS, 382, 1901
- Santos, Mendes de Oliveira, & Sodré (2007) Santos, W.A., Mendes de Oliveira, C., & Sodré, L., 2007, AJ, 134, 1551
- Smith et al. (2010) Smith, G.P., Khosroshahi, H.G., Dariush, A., Sanderson, A.J.R., Ponman, T.J., Stott, J.P. et al., 2009, MNRAS, submitted
- Spergel et al. (2003) Spergel, D.N. et al., 2003, ApJS, 148, 175
- Springel et al. (2001) Springel, V., White, S.D.M., Tormen, G. & Kauffmann, G., 2001, MNRAS, 328, 726
- Springel et al. (2005) Springel, V. et al., 2005, Nature, 435, 629
- Steinmetz & White (1997) Steinmetz, M., & White, S.D.M., 1997, MNRAS, 288, 545
- van den Bosch et al. (2007) van den Bosch, F.C. et al., 2007, MNRAS, 376, 841
- Voevodkin et al. (2009) Voevodkin A., Borozdin K., Heitmann K., Habib S., Vikhlinin A., Mescheryakov A., Hornstrup A., Burenin R., 2010, ApJ, 708, 1376
- von Benda-Beckmann et al. (2008) von Benda-Beckmann A.M., D’Onghia E., Gottlöber S., Hoeft M., Khalatyan A., Klypin A., Müller V., 2008, MNRAS, 386, 2345
- Yang et al. (2005) Yang X. H., Mo H. J., van den Bosch F. C., Jing Y. P., 2005, MNRAS, 356, 1293
- Yang et al. (2007) Yang X. H., Mo H. J., van den Bosch F. C., Pasquali, A., Li, Ch., Barden, M., 2007, ApJ, 671, 153