11email: m.patel06@imperial.ac.uk 22institutetext: Dark Cosmology Centre, Niels Bohr Institute, University of Copenhagen, Juliane Maries Vej 30, DK-21000, Copenhagen, Denmark
The reanalysis of spectra of GRB 080913 to estimate the neutral fraction of the IGM at a redshift of 6.7
Abstract
Aims. We reanalyse optical spectra of the gamma-ray burst GRB 080913, adding hitherto unpublished spectra, in order to reassess the measurement of the neutral fraction of the IGM at high redshifts.
Methods. In the data reduction we take particular care to minimise systematic errors in the sky subtraction, which are evident in the published spectrum, and compromise the analysis. The final combined spectrum has a higher S/N than the previously published spectrum by a factor of 1.3.
Results. We find a single significant absorption line redward of the Ly continuum break, which we identify with the SII+SiII m blend, at . The sharp spectral break at Ly implies a comparatively low total column density of neutral hydrogen along the line of sight, . We model the absorption with a host-galaxy DLA, surrounded by an ionised region of unknown size , within the IGM of neutral fraction, . Despite knowing the source redshift, and the improved S/N of the spectrum, when fitting only over wavelengths redward of Ly, no useful constraints on can be obtained. We consider the possibility of including the ionised region, blueward of Ly, in constraining the fit. For the optimistic assumption that the ionised region is transparent, , we find that the region is of small size proper Mpc, and we obtain an upper limit to the neutral fraction of the IGM at of at a probability of 90.
Key Words.:
gamma ray bursts – optical – reionisation1 Introduction
The hydrogen in the Universe became predominantly neutral at the epoch of recombination, . The inter-galactic medium (IGM) out to , however, is highly ionised. Two observations made within the last decade have narrowed the window within which cosmic hydrogen reionisation took place. First, the electron scattering optical depth to the cosmic microwave background measured by the Wilkinson Microwave Anisotropy Probe implies a redshift of reionisation of (Dunkley et al., 2009). Second, observations of the Ly forest in the spectra of quasars indicate that marks the tail-end of the epoch of reionisation (Fan et al., 2006). These two results suggest that reionisation is an extended process. Therefore, in order to understand the chronology of reionisation in detail, there is considerable interest in detecting sources beyond , the redshift of the most distant quasars so far discovered (Fan et al., 2003; Willott et al., 2007).
Ly emitting galaxies (LAEs) have been detected out to (Kashikawa et al., 2006; Ota et al., 2008). Since the strength of the Ly emission line depends on the neutral fraction, , one approach advocated to chart the progress of reionisation (McQuinn et al., 2007) is to measure the evolution of the properties (e.g. abundance, clustering, etc) of LAEs. However, the processes involved are difficult to model accurately (e.g. Tasitsiomi, 2006; Dijkstra et al., 2007), and there is little consensus yet on the interpretation of the results from this approach.
The confirmation of the cosmological nature of gamma ray bursts (GRBs) (Kulkarni et al., 1998) revealed their potential as probes of the high-redshift Universe. Barkana & Loeb (2004) emphasise two particular advantages of GRBs over quasars for studying reionisaton: that their afterglows will be visible to redshifts of ; and that the size of the ionised region around the host galaxy, which complicates the interpretation of the spectrum, will be small. Recent numerical simulations by McQuinn et al. (2008) and Mesinger & Furlanetto (2008), however, suggest that GRB host galaxies may be located in dense environments, and therefore the IGM immediately surrounding the host galaxy may be ionised by nearby quasars or local massive star forming galaxies, and so the size of the ionised region needs to be included in the modelling. In any case a high signal-to-noise ratio (S/N) spectrum is needed to distinguish between the different signatures of a high-column density of neutral hydrogen in the GRB host galaxy (or nearby) (Ruiz-Velasco et al., 2007), and of distributed neutral hydrogen in the IGM.
Until the launch of the Swift satellite (Gehrels et al., 2004), the furthest known GRB was at (Andersen et al., 2000), compared to for the furthest known quasar at that time (Fan et al., 2000). Since then, three GRBs at have been discovered using Swift: GRB 050904 at in 2005 (Cusumano et al., 2006; Kawai et al., 2006); GRB 080913 at in 2008 (Greiner et al., 2009); and, in 2009, the remarkable source GRB 090423 at (Tanvir et al., 2009; Salvaterra et al., 2009), the most distant object yet found.
Totani et al. (2006) present a detailed analysis of the optical afterglow spectrum of GRB 050904, which was measured with the highest S/N of the three GRBs. The spectrum displays a red damping wing from Ly absorption that is produced by some combination of a high-column density absorber near the GRB (hereafter referred to as a DLA, for damped Ly absorber), and a smoothly distributed component in the IGM. By fitting absorption models containing these two components, Totani et al. (2006) were able to place a limit on the neutral fraction of the IGM at of at confidence. The constraints are relatively weak despite the reasonably high S/N of the spectrum. The sources GRB 080913 and GRB 090423 are potentially more interesting, because of their higher redshifts, but the published spectra have insufficient S/N to place any useful constraints on when employing two-component (DLA+IGM) fits.
Here we describe and analyse an improved spectrum of GRB 080913, which includes unpublished spectroscopic data taken three nights after the published spectrum. In Section 2 we describe the observations taken on each night, and the reduction techniques. We analyse the combined spectrum in Section 3, first searching for absorption lines in the new spectrum, in order to measure the redshift of the source, and then fitting a two-component DLA+IGM model to the observed continuum break. Finally, the results are summarised in Section 4.
2 Observations and Data reduction
Greiner et al. (2009) (hereafter Paper I) provide a summary of all the photometric and spectroscopic observations of GRB 080913. Here we recap the details of the spectroscopic observations only. The object was first observed at the Very Large Telescope using the FOcal Reduction and low dispersion Spectrograph 2 instrument on the night beginning Septempber 13 2008. A 1 arcsec slit and the 600z grism were employed, providing wavelength coverage from 0.7470 to m. One 1800s and one 600s exposure were taken, but the second exposure is not useful as it was taken in twilight. The first spectrum is published in Paper I, and used for the analysis presented there. Due to poor weather, further observations were not possible until three nights later, on the night beginning September 16 2008, when 7 exposures of 1800s each were secured. Because the source was then fainter, the S/N of the combined spectrum from the second night is lower than that of the single spectrum from the first night.
We reduced the data in the following manner. After the standard bias subtraction and flat-fielding steps, cosmic rays were removed from individual frames using the Laplacian Cosmic Ray Removal Algorithm of van Dokkum (2001). The 7 frames observed on the second night were taken using 4 different slit positions. We adapted methods from near-infrared spectroscopy described in Weatherley et al. (2005) to minimise residuals from the subtraction of bright sky lines. After subtracting a functional fit up each column in every frame (first-order sky subtraction), all frames at other slit positions were averaged and subtracted (second-order sky subtraction). The 7 frames were then registered and combined, weighting by the inverse variance. Since only one frame was taken on the first night, frames from the second night were used for the second-order sky subtraction. Compared to the standard method for optical long-slit spectroscopy (i.e. first-order sky subtraction), the method followed here results in a slight increase in the random errors, but largely eliminates systematic errors.
One-dimensional optimal spectral extraction was performed separately for each night, weighting by the profile of a nearby bright star. Wavelength calibration was achieved using observations of a HeNeAr lamp. Corrections for telluric absorption and flux calibration were applied simultaneously using observations of the standard star LTT 7987. We scaled the spectrum from the second night to the spectrum from the first night, and combined the data, weighting by the inverse variance. The flux calibration agrees well with that in Paper I.
3 Analysis of the Optical Afterglow Spectrum
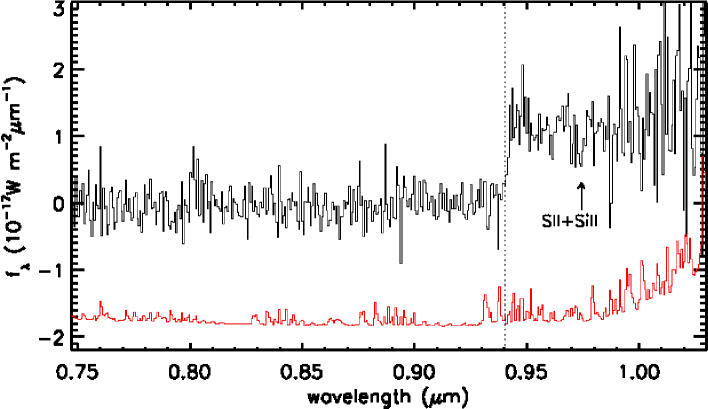
The final combined spectrum, binned to critical sampling, is shown in Fig. 1. The S/N of the new spectrum compared to the original spectrum shows an improvement by a factor of 1.3 on average. The sharp break shows no clear evidence of a significant red damping wing, and is indicative of a relatively low column density of neutral gas, compared to GRB 050904.
3.1 Search for absorption lines
The Ly continuum break near m corresponds to . In the hope of measuring an accurate redshift, we made a search for absorption lines in the afterglow spectrum.
For all the fits presented in this paper we assumed that the spectral energy distribution of the GRB follows a power-law (), where , which was derived from photometric measurements taken on the first night (Paper I). After subtracting the continuum fit, we tested for the presence of an absorption line centred at each pixel redward of the break, and then refined the measurement of the line centre of any detected lines, by refitting with the central wavelength as a free parameter. We assumed a Gaussian profile matched to the spectral resolution (i.e. 8 unbinned pixels, FWHM m). The S/N at any pixel is given by:
| (1) |
where describes the line profile, centred on , is the residual flux, and is the flux error (Bolton et al., 2004).
Over the rest-frame wavelength range measured, one of the strongest absorption lines typically seen in afterglow spectra is the SII+SiII m blend, which is expected to be situated near m. We found only one absorption line with significance greater than , detected at the wavelength m at . The line is marked in Fig. 1. The wavelength matches the expected location of the SII+SiII m line, which is unlikely to be a coincidence. Therefore we infer that the line is real. The measured wavelength provides an absorption redshift of .
3.2 Fitting the continuum break
The continuum break is due to a combination of absorption by neutral gas in the GRB host galaxy and the IGM, therefore only a two-component (DLA+IGM) fit provides a meaningful physical model. The modelling is complicated by the unknown size and neutral fraction of the surrounding ionised region. For this reason it is useful first to fit single-component models to quantify the strength of the break.
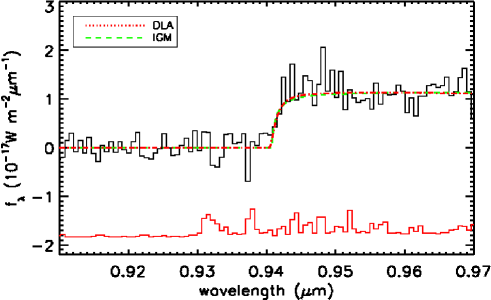
For each single-component model, the power-law SED is modified by absorption by either a DLA or the IGM, computed using the equations in Totani et al. (2006). We limit the fits to data blueward of m, and mask out the SII+SiII absorption line. For the DLA model we assume complete absorption blueward of the line centre, since this is achieved for a minimal value of . The fits are determined using minimisation.
The DLA model has three free parameters: the redshift, ; the column density, ; and the continuum normalisation at a wavelength of m, . We find best-fit values of , and . The redshift is in excellent agreement with the absorption-line redshift. The value of is low in comparison with the majority of GRB-DLA systems detected so far (Fynbo et al., 2009), which is interesting as this is in line with the prediction of Nagamine et al. (2008) that the typical column densities of GRB-DLA systems decrease towards higher redshifts. The IGM model is defined by four parameters: the neutral fraction , the continuum normalisation at m, , and the upper and lower redshift limits over which applies, and . We fix the lower redshift to z. We find best-fit values of , and . The two models are plotted in Fig. 2 and are almost indistinguishable, implying that there will be a strong degeneracy between the parameters and in a two-component fit.
These two fits are quite different from those obtained by Greiner et al. (2009), who found much stronger absorption. For the DLA model their confidence range is , and for the IGM model they found a best fit value , with at confidence. From an analysis of the two spectra, the differences may be explained by systematic sky-subtraction residuals in their spectrum, caused by the strong OH sky lines in the region m (visible in the error spectrum, Fig. 1). We demonstrate this by a quantitative comparison of the two spectra and error arrays. We first binned each spectrum by a factor of four, summing the variance arrays appropriately. We then subtracted a median-filtered version of the data, and divided the result by the error array. In the absence of systematic errors, or significant features in the spectra, these S/N spectra should have mean zero and . We find this to be true for our spectrum, at all wavelengths, and also for the spectrum of Greiner et al. (2009) in regions free of strong sky lines. However over the wavelength range of interest m we measure in their spectrum, which is strong evidence of systematic sky-subtraction residuals.
Turning now to the two-component model, we firstly fix to the absorption redshift of , since the absorption presumably arises in the dominant neutral-gas system in the host galaxy. However, we must consider the possibility that and differ, because the GRB host galaxy is surrounded by an ionised region. The two-component model therefore requires five parameters: , , , and the continuum normalisation at m, . A further complication is the uncertain degree of absorption within the ionised bubble. The GP (Gunn & Peterson, 1965) optical depth is given by
| (2) |
where is the overdensity. If is large, there is negligible transmission blueward of Ly, so that only the wavelength range redward of Ly is useful. Under these conditions, at this low S/N, we find we can obtain no useful constraints on the various parameters of the two-component model – for the IGM component, which only contributes significantly to the wing of the absorption profile, a large ionised region and large provides a similarly good fit as a small ionised region and small . On the other hand, if within the ionised region is small, then, for a large ionised region, there will be measureable transmission to the blue of the DLA line centre: see Iliev et al. (2008) for illustrations of such cases from simulations. Under these conditions, with high S/N, this region could also be used in the modelling. For our spectrum, due to the low S/N, we consider only the simple (optimistic) case that the ionised region is completely transparent, . We assume a uniform prior on each parameter except for the column density. Since GRBs are most likely to occur in regions with significant neutral hydrogen, we apply a prior which scales linearly with column density.
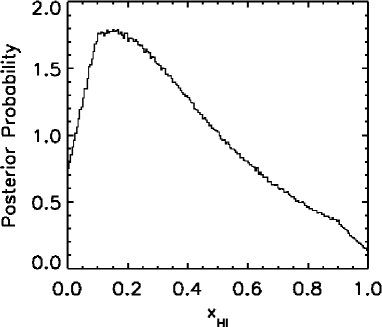
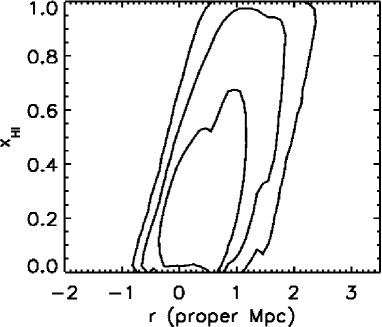
We find best-fit parameters of , , . To determine the uncertainties in each of these parameters we use a Markov Chain Monte Carlo (MCMC) algorithm and sample the posterior probability distribution. The result is presented in Fig. 3, which shows the posterior probability distribution of the IGM neutral fraction having marginalised over all other parameters. We find with a probability of . Our analysis also provides constraints on the size of the ionised region around the GRB host. In Fig. 4, we plot the marginalized posterior probability contours in - space produced from our fits. Here we see that an ionised region which has a size smaller than proper Mpc is favoured. The regions in parameter space where r is negative correspond to situations where the DLA material is accelerated towards us due to either the GRB event or its progenitor. If we ignore these regions, we find that proper Mpc with a probability of , which suggests that a large ionised region is not present around the host galaxy. This value is, however, still consistent with external sources of ionising flux being present. For comparison Haiman (2002) found that the ionised regions around LAEs have a typical size of proper Mpc.
4 Conclusion
New optical spectroscopic observations of GRB 080913 have been presented and analysed. The detection of SII+SiII absorption (m) at provides a redshift of the DLA host galaxy of . Employing a joint DLAIGM model to fit the observed continuum break, we find an upper limit to the neutral fraction of the IGM at a probability of . However this result rests on the assumption that the ionised region surrounding the host galaxy is transparent to Ly. Any analysis of a GRB spectrum needs to include the radius of the ionised region as a free parameter, and to consider the question of the neutral fraction within this zone. Furthermore the scatter in measurements of between different sources at similar redshifts is predicted to be substantial (McQuinn et al., 2008; Mesinger & Furlanetto, 2008), and needs to be quantified. Higher S/N spectra of several sources at high redshift will be required to make significant progress in this field.
Acknowledgements.
M.P. acknowledges funding from the University of London. The Dark Cosmology Centre is funded by the DNRF. We are grateful to the referee for comments which helped improve the manuscript substantially.References
- Andersen et al. (2000) Andersen, M. I., Hjorth, J., Pedersen, H., et al. 2000, A&A, 364, L54
- Barkana & Loeb (2004) Barkana, R. & Loeb, A. 2004, ApJ, 601, 64
- Bolton et al. (2004) Bolton, A. S., Burles, S., Schlegel, D. J., Eisenstein, D. J., & Brinkmann, J. 2004, AJ, 127, 1860
- Cusumano et al. (2006) Cusumano, G., Mangano, V., Chincarini, G., et al. 2006, Nature, 440, 164
- Dijkstra et al. (2007) Dijkstra, M., Lidz, A., & Wyithe, J. S. B. 2007, MNRAS, 377, 1175
- Dunkley et al. (2009) Dunkley, J., Komatsu, E., Nolta, M. R., et al. 2009, ApJS, 180, 306
- Fan et al. (2006) Fan, X., Strauss, M. A., Becker, R. H., et al. 2006, AJ, 132, 117
- Fan et al. (2003) Fan, X., Strauss, M. A., Schneider, D. P., et al. 2003, AJ, 125, 1649
- Fan et al. (2000) Fan, X., White, R. L., Davis, M., et al. 2000, AJ, 120, 1167
- Fynbo et al. (2009) Fynbo, J. P. U., Jakobsson, P., Prochaska, J. X., et al. 2009, ApJS, 185, 526
- Gehrels et al. (2004) Gehrels, N., Chincarini, G., Giommi, P., et al. 2004, ApJ, 611, 1005
- Greiner et al. (2009) Greiner, J., Krühler, T., Fynbo, J. P. U., et al. 2009, ApJ, 693, 1610
- Gunn & Peterson (1965) Gunn, J. E. & Peterson, B. A. 1965, ApJ, 142, 1633
- Haiman (2002) Haiman, Z. 2002, ApJ, 576, L1
- Iliev et al. (2008) Iliev, I. T., Shapiro, P. R., McDonald, P., Mellema, G., & Pen, U. 2008, MNRAS, 391, 63
- Kashikawa et al. (2006) Kashikawa, N., Shimasaku, K., Malkan, M. A., et al. 2006, ApJ, 648, 7
- Kawai et al. (2006) Kawai, N., Kosugi, G., Aoki, K., et al. 2006, Nature, 440, 184
- Kulkarni et al. (1998) Kulkarni, S. R., Djorgovski, S. G., Ramaprakash, A. N., et al. 1998, Nature, 393, 35
- McQuinn et al. (2007) McQuinn, M., Hernquist, L., Zaldarriaga, M., & Dutta, S. 2007, MNRAS, 381, 75
- McQuinn et al. (2008) McQuinn, M., Lidz, A., Zaldarriaga, M., Hernquist, L., & Dutta, S. 2008, MNRAS, 388, 1101
- Mesinger & Furlanetto (2008) Mesinger, A. & Furlanetto, S. R. 2008, MNRAS, 385, 1348
- Nagamine et al. (2008) Nagamine, K., Zhang, B., & Hernquist, L. 2008, ApJ, 686, L57
- Ota et al. (2008) Ota, K., Iye, M., Kashikawa, N., et al. 2008, ApJ, 677, 12
- Ruiz-Velasco et al. (2007) Ruiz-Velasco, A. E., Swan, H., Troja, E., et al. 2007, ApJ, 669, 1
- Salvaterra et al. (2009) Salvaterra, R., Della Valle, M., Campana, S., et al. 2009, Nature, 461, 1258
- Tanvir et al. (2009) Tanvir, N. R., Fox, D. B., Levan, A. J., et al. 2009, Nature, 461, 1254
- Tasitsiomi (2006) Tasitsiomi, A. 2006, ApJ, 645, 792
- Totani et al. (2006) Totani, T., Kawai, N., Kosugi, G., et al. 2006, PASJ, 58, 485
- van Dokkum (2001) van Dokkum, P. G. 2001, PASP, 113, 1420
- Weatherley et al. (2005) Weatherley, S. J., Warren, S. J., Møller, P., et al. 2005, MNRAS, 358, 985
- Willott et al. (2007) Willott, C. J., Delorme, P., Omont, A., et al. 2007, AJ, 134, 2435