Testing Strict Hydrostatic Equilibrium in Simulated Clusters of Galaxies:
Implications to Abell 1689
Abstract
Accurate mass determination of clusters of galaxies is crucial if they are to be used as cosmological probes. However, there are some discrepancies between cluster masses determined based on gravitational lensing, and X-ray observations assuming strict hydrostatic equilibrium (i.e., the equilibrium gas pressure is provided entirely by thermal pressure). Cosmological simulations suggest that turbulent gas motions remaining from hierarchical structure formation may provide a significant contribution to the equilibrium pressure in clusters. We analyze a sample of massive clusters of galaxies drawn from high resolution cosmological simulations, and find a significant contribution (20%–45%) from non-thermal pressure near the center of relaxed clusters, and, in accord with previous studies, a minimum contribution at about 0.1 , growing to about 30%–45% at the virial radius, . Our results strongly suggest that relaxed clusters should have significant non-thermal support in their core region. As an example, we test the validity of strict hydrostatic equilibrium in the well-studied massive galaxy cluster Abell 1689 using the latest high resolution gravitational lensing and X-ray observations. We find a contribution of about 40% from non-thermal pressure within the core region of A1689, suggesting an alternate explanation for the mass discrepancy: the strict hydrostatic equilibrium is not valid in this region.
Subject headings:
cosmology: theory–methods: numerical–gravitational lensing–X-rays: galaxies: clusters–galaxies: clusters: individual (A1689)1. Introduction
Clusters of galaxies, the most massive virialized systems, form from the largest positive density fluctuations. The evolution of the abundance of these rare fluctuations are sensitive to the cosmological model. Also, the distribution of dark matter and gas in these systems provide a powerful test for our structure formation theories. Mass determinations based on X-ray observations customarily assume spherical symmetry and strict hydrostatic equilibrium, i.e., the gas pressure is provided entirely by thermal pressure, (e.g., Sarazin 1988). However, cosmological simulations suggest that even after equilibrium is established, a significant fraction of the pressure support against gravity comes from subsonic random gas motion in clusters (Lau, Kravtsov & Nagai 2009; Maier et al. 2009; Fang et al. 2009; Younger & Bryan 2007; and references therein).
Previous studies focused on how cluster mass determinations are influenced by non-thermal pressure support (Zhang et al., 2010; Meneghetti et al., 2009; Lau et al., 2009; Laganá, de Souza & Keller, 2009). In this Letter, instead of determining the cluster mass, we focus on the dynamically important physical parameter of the intra-cluster gas (ICG): the pressure. We use a sample of massive clusters of galaxies drawn from high resolution cosmological simulations and quantify the contribution from non-thermal pressure in relaxed clusters.
As an example, we test the validity of the common assumption of strict hydrostatic equilibrium in Abell 1689. A1689 is one of the most thoroughly investigated massive galaxy clusters with a total mass of , located at a redshift of 0.183 (Coe et al. 2010; Peng et al. 2009; Riemer-Sørensen et al. 2009; Lemze et al. 2008; Umetsu & Broadhurst 2008; and references therein). It has been found, under the assumption of spherical symmetry and strict hydrostatic equilibrium, that in the central region of A1689 the mass derived from X-ray observations is significantly lower than that inferred from gravitational lensing measurements (Riemer-Sørensen et al. 2009; Peng et al. 2009; Andersson & Madejski 2004; and references therein). We quantify the contribution from non-thermal pressure in A1689 using the latest Chandra, Suzaku and gravitational lensing observations, and make use of our results for simulated clusters to interpret the observations. In the rest of the paper we assume a concordance cold dark matter (CDM) model with , , and , where is defined as km s-1Mpc-1. Errors, error bars and dashed lines represent confidence levels unless otherwise stated.
2. Pressure in Simulated Clusters
We derive the hydrostatic and thermal gas pressure profiles, and , for massive relaxed clusters drawn from cosmological adaptive mesh refinement (AMR) simulations performed with the cosmological code ENZO (O’Shea et al., 2004) assuming a spatially flat cosmological model very similar to the concordance model. The AMR simulations were adiabatic in the sense that no heating, cooling, or feedback were included (for details see Younger & Bryan 2007). The highest resolution was about 25 kpc at = 0.01 (where the virial radius, , is defined as in Bryan & Norman 1998), We selected relaxed clusters from the ten most massive clusters (1–2) based on having a smooth spherically averaged density profile and no sign of recent major merger events (for details see Molnar et al. 2009).
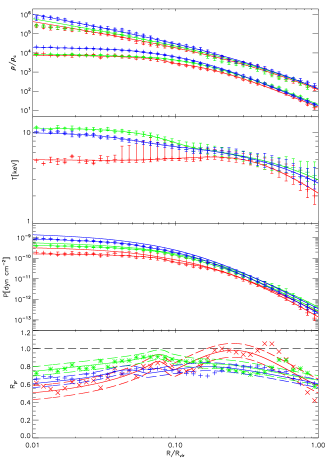
We show radial profiles for the two relaxed clusters (CL1 and CL2) and one cluster with a non-relaxed core (but otherwise relaxed, CL3) in Figure 1. In this figure, the error bars represent the of the density and temperature variations due to angular averaging. In the density and temperature plots the solid lines represent best fit models to the AMR data points assuming double models for the electron density distribution, , and for the temperature. We fixed , which is an average value suggested by simulations (Younger & Bryan, 2007). We used for the dark matter density profiles.
We derive the hydrostatic gas pressure, , using the equation of hydrostatic equilibrium assuming spherical symmetry,
| (1) |
where and are the gas density and the cumulative total mass within the 3-dimensional (3D) radius, and is the gravitational constant. We numerically integrate Equation 1 using our fits. The accretion shock maintains a finite value for at , which we derive iteratively: we integrate Equation 1 inward from demanding that the falloff of the pressure at large radii is a smooth function of the radius. Note that, since the pressure drops more than three orders of magnitude from the cluster center to , the pressure in the central region is insensitive to the choice of at (within reasonable limits).
The resulting hydrostatic and thermal gas pressure profiles are shown in Figure 1. In the 3rd panel the points show . The solid lines connecting the points are not fits but derived from the density and temperature fits (and serve as a consistency test). The sold lines above these lines represent the hydrostatic equilibrium pressure. Note that, in the core region of CL3, the positive red error bars for the temperature are much larger than the negative ones. This is an indication of large positive deviations from the median in these radial bins, and a consequence of a non-relaxed core in CL3. The pressure ratio, , profiles are also shown (bottom panel). In this panel, the errors (blue, green and red dashed lines) represent the average deviations of pressure ratio points (plus signs, crosses and stars) from the mean (solid lines). We use these errors since they are larger than the statistical errors associated with our smooth fitting functions (except at the center of the cluster with the non-relaxed core, CL3).
3. Testing Hydrostatic Equilibrium in Simulated Clusters
We test the assumption of strict hydrostatic equilibrium in our simulated clusters using the pressure ratio profiles: . These profiles in our relaxed simulated clusters show a similar trend (Figure 1; bottom panel, blue and green lines). In each cluster, is small near the center (), close to unity in , and decreases in the outer regions (). Even in our cluster with a non-relaxed core, CL3, the average shows a similar trend (red lines).
Quantitatively, we find that the contribution from non-thermal pressure, , is decreasing from 20%–45% near the cluster center (0.01), reaches a minimum of 5%–30% at about 0.1, and increases up to about 30%–45% at . In the region of overlap with other simulations, , similar contributions have been found in clusters from : 5%–15% at about 0.1, increasing with radius to 20%–40% at (Lau et al., 2009). Our results for non-thermal pressure support are also consistent with those of Younger & Bryan (2007). Thus we find that in the central regions of our massive clusters, is significantly less than (Figure 1).
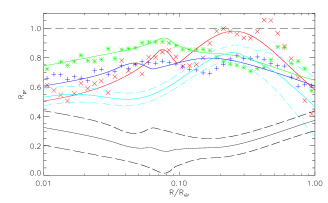
In our adiabatic simulations, this non-thermal pressure support is provided by subsonic random gas motion, i.e., , where is the dynamical pressure (e.g., Lau et al. 2009). We show the average dynamical pressure ratio, , profile in Figure 3 (black lines). We estimate the errors in as and (black dashed lines). We conclude that in the central regions of massive simulated clusters there is a significant contribution from dynamical pressure.
Based on our results, we find that there is no need for feedback from a central AGN for the strict hydrostatic equilibrium to break down in the central regions of clusters. This break down is due to subsonic random gas motion, which is a direct consequence of hierarchical structure formation. Near , the contribution from may reach 30%–45%. This is probably due to more recent and still ongoing slow accretion since the outer regions of clusters have not reached equilibrium due to the large sound crossing time, about 1 Gyr (for a more detailed analysis see Kawaharada et al. 2010). Our results for simulated clusters strongly suggest that even relaxed clusters should have significant non-thermal support in their core regions.
4. Testing Hydrostatic Equilibrium in A1689
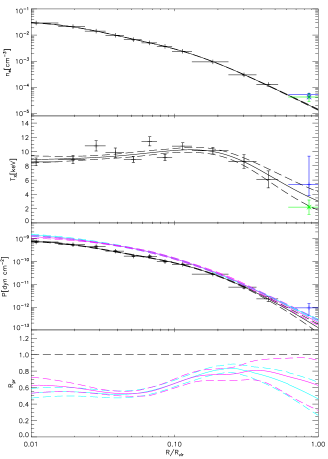
As an example, we determine the pressure profiles in the well studied massive galaxy cluster A1689. We derive from our analysis of the three longest publicly available Chandra ACIS-I observations of A1689 (ObsIDs: 5004, 6930 and 7289). After following standard ACIS data preparation111, the total exposure time of 171 ksec was reduced to 128.7 ksec. We fixed the redshift and the photoelectric absorption at the galactic value, and used , where and are the electron and hydrogen densities assuming (as in Peng et al. 2009). Since these observations were taken in the Very FAINT telemetry mode, while the FAINT mode was used for the background observations, we chose to use local background. Assuming spherical symmetry, we determined the de-projected 3D densities and electron temperatures, , out to 0.6 for each shell fitting all shells and data sets simultaneously using XSPEC-12.5 applying C-statistic (Figure 3; black points with error bars). Our results are consistent with those Peng et al. (2009; see their Figure 11). We calculate the thermal pressure in A1689 using the ideal gas law. For we show the results for offset 1 from the Suzaku observations (Kawaharada et al., 2010), which we use in our analysis. We also show the results for offset 2 (green points) to represent the similar results from offsets 2, 3 and 4 of Suzaku. The lower resolution Suzaku results agree with those from Chandra for , thus we use only the last radial data points from Suzaku. We use offset 1 because the other offsets would give us even higher non-thermal pressure contribution due to the very low temperatures for offsets 2, 3, and 4 relative to offset 1.
We derive the hydrostatic gas pressure, , numerically integrating Equation 1 assuming the same gas density and temperature models as in Section §3. We find the best fit parameters for the density: , , () = (), () = (); and for the temperature: keV, keV, = (), and = (), where all scale radii, , are in Mpc (Figure 3, black solid lines). The fitted parameters determining the large scale temperature profile, , have large errors due to the large uncertainty in the Suzaku temperature measurement near . We derive the gas density using , where is the proton mass (we adopt ; see e.g., Peng et al. 2009). We show the thermal gas pressure, , derived from the best fit density and temperature profiles in Figure 3 (3rd panel; black line). As a consistency check, we also derive the thermal pressure directly from the deprojected density and temperature points (points with error bars, same panel). We determine the cumulative mass function, using the best-fit spherical Navarro, Frenk & White (NFW) model (Navarro, Frenk & White, 1997) based on the latest high resolution mass modeling of A1689 by Coe et al. (2010). As a comparison, we also use based on a non-parametric deprojection of the 2D mass distribution derived from a joint strong and weak lensing analysis of Hubble Space Telescope Advanced Camera for Surveys (ACS) and Subaru observations of A1689 (Umetsu & Broadhurst, 2008) assuming spherical symmetry (see also Kawaharada et al. 2010). Our results for are shown in Figure 3 (panel 3). The errors for the NFW model were estimated using Monte Carlo simulations assuming a Gaussian probability distribution for the parameters centered on their respective best fit values. The errors for the non-parametric model were estimated from Monte Carlo simulations based on the full covariance matrix of the lensing convergence profile (for details see Umetsu et al. 2010).
The pressure ratios derived from observations of A1689, are shown in Figure 3 (bottom panel). These ratios, based on NFW and a non-parametric model for , are consistent with each other (Figure 3; cyan and magenta lines). Similarly to our simulated clusters, we find a significant contribution from in the core region and near (Figure 3). The contribution from is about 40%10% in A1689 out to about 0.1, which is somewhat smaller than that in simulated clusters, although, at the center, it is within the errors due to cluster-to-cluster scatter. Also, from this figure we see that the maximum of the average ratio in simulated clusters is located somewhat closer to the center than the maximum in A1689 (Figure 3).
However, we expect that in the core region of A1689 non-gravitational processes are also important due to feedback from active galactic nuclei (McCarthy et al., 2009; and references therein). In general, contributions to the pressure in clusters may come from turbulence, magnetic fields and cosmic rays (e.g., Vazza et al. 2009). An attempt to separate these non-thermal pressure components based on their assumed functional form derived from numerical simulations has been carried out by Lagana et al. (2009). However, as they pointed out, this decomposition strongly depends on the assumed functional forms of the components. Unfortunately, at this point, we cannot determine the dominant contribution to the non-thermal pressure support in A1689 from observations directly.
5. Conclusion
We have analyzed massive clusters of galaxies drawn from high resolution cosmological simulations and quantified the non-thermal pressure support in relaxed clusters with high resolution from out to . We have found a significant contribution from non-thermal pressure in simulated clusters due to subsonic random gas motion: 20%–45% at and 30%–45% at having a minimum support of 5%–30% at (Figure 1). Our results strongly suggest that relaxed clusters should have significant non-thermal support in their core region, and that this non-thermal pressure support should be taken into account when analyzing clusters.
As a test case, we have quantified the non-thermal pressure support in the well studied galaxy cluster A1689. Based on our results for the thermal gas pressure and the hydrostatic equilibrium pressure determined from X-ray and gravitational lensing observations of A1689, assuming spherical symmetry, we have found a significant, 40%, contribution from non-thermal pressure within 0.1 . We conclude that the mass discrepancy in the central region of A1689 can be explained if we assume that the strict hydrostatic equilibrium is not valid in this region. We need to test the assumption of hydrostatic equilibrium in more clusters to find out how common this large amount of non-thermal pressure contribution in their core region.
While our spherical models for A1689 take into account support from non-thermal gas pressure as suggested by CDM models, they predict a high concentration parameter, the triaxial models of Morandi et al. (2010), Corless et al. (2009) and Sereno et al. (2006) do not take into account non-thermal pressure but provide a concentration parameter consistent with the predictions of CDM models. Peng et al. (2009) have found that a prolate gas distribution could solve the mass discrepancy, but it overestimates the total mass at large radii significantly, and implies a larger ellipticity than predicted by CDM models. Although all of these models solve the mass discrepancy in A1689, neither of them is fully consistent with all predictions of CDM models. Our results suggest that a physical cluster model for A1689 with a triaxial mass distribution including support from non-thermal pressure might be fully consistent with all observations and the predictions of CDM models.
References
- Andersson & Madejski (2004) Andersson, K. E., & Madejski, G. M. 2004, ApJ, 607, 190
- Bryan & Norman (1998) Bryan, G.L., & Norman, M.L., 1998, ApJ, 495, 80
- Coe et al. (2010) Coe, D., Benitez, N., Broadhurst, T., Moustakas, L., & Ford, H., 2010, ArXiv:1005.0398 [astro-ph.CO]
- Corless et al. (2009) Corless, V. L., King, L. J., & Clowe, D. 2009, MNRAS, 393, 1235
- Fang et al. (2009) Fang, T., Humphrey, P., & Buote, D. 2009, ApJ, 691, 1648
- Kawaharada et al. (2010) Kawaharada, M., et al. 2010, ApJ, 714, 423
- Laganá, de Souza & Keller (2009) Laganá, T. F., de Souza, R. S., & Keller, G. R. 2010, A&A, 510, A76
- Lau et al. (2009) Lau, E. T., Kravtsov, A. V., & Nagai, D. 2009, ArXiv:0903.4895 [astro-ph.CO]
- Lemze et al. (2008) Lemze, D., Barkana, R., Broadhurst, T. J., & Rephaeli, Y. 2008, MNRAS, 386, 1092
- McCarthy et al., (2009) McCarthy, I. G., et al., 2009, ArXiv:0911.2641 [astro-ph.CO]
- Maier et al. (2009) Maier, A., Iapichino, L., Schmidt, W., & Niemeyer, J.C., 2009, ArXiv:0909.1800 [astro-ph.CO]
- Meneghetti et al. (2009) Meneghetti, M. et al., 2009, ArXiv:0912.1343 [astro-ph.CO]
- Molnar et al. (2009) Molnar, S. M., Hearn, N., Haiman, Z., Bryan, G., Evrard, A., & Lake, G. 2009, ApJ, 696, 1640
- Morandi et al. (2010) Morandi, A., Pedersen, K., & Limousin, M., 2010, arXiv:1001.1656 [astro-ph.CO]
- Navarro, Frenk & White (1997) Navarro, J. F., Frenk, C. S., & White, S. D. M. 1997, ApJ, 490, 493
- O’Shea et al. (2004) O’Shea, B.W., Bryan, G. L., Bordner, J., Norman, M. L., Abel, T., Harkness, R., & Kritsuk, A. 2004, ArXiv:0403044 [astro-ph.CO]
- Peng et al. (2009) Peng, E.-H., Andersson, K., Bautz, M. W., & Garmire, G. P. 2009, ApJ, 701, 1283
- Riemer-Sørensen et al. (2009) Riemer-Sørensen, S., Paraficz, D., Ferreira, D. D. M., Pedersen, K., Limousin, M., & Dahle, H. 2009, ApJ, 693, 1570
- Sarazin (1988) Sarazin, C. 1988, X-Ray Emission from Clusters of Galaxies. Cambridge: Cambridge Univ. Press
- Sereno et al. (2006) Sereno, M., De Filippis, E., Longo, G., & Bautz, M. W. 2006, ApJ, 645, 170
- Umetsu & Broadhurst (2008) Umetsu, K., & Broadhurst, T. 2008, ApJ, 684, 177
- Umetsu et al. (2010) Umetsu, K., Medezinski, E., Broadhurst, T., Zitrin, A., Okabe, N., Hsieh, B.-C., & Molnar, S. M. 2010, ApJ, 714, 1470
- Vazza et al. (2009) Vazza, F., Brunetti, G., Kritsuk, A., Wagner, R., Gheller, C., & Norman, M. 2009, A&A, 504, 33
- Younger & Bryan (2007) Younger, J. D., & Bryan, G. L. 2007, ApJ, 666, 647
- Zhang et al. (2010) Zhang, Y.-Y. 2010, ArXiv:1001.0780 [astro-ph.CO]