A lattice polymer study of DNA renaturation dynamics
Abstract
DNA renaturation is the recombination of two complementary single strands to form a double helix. It is experimentally known that renaturation proceeds through the formation of a double stranded nucleus of several base pairs (the rate limiting step) followed by a much faster zippering. We consider a lattice polymer model undergoing Rouse dynamics and focus on the nucleation of two diffusing strands. We study numerically the dependence of various nucleation rates on the strand lengths and on an additional local nucleation barrier. When the local barrier is sufficiently high, all renaturation rates considered scale with the length as predicted by Kramers’ rate theory and are also in agreement with experiments: their scaling behavior is governed by exponents describing equilibrium properties of polymers. When the local barrier is lowered renaturation occurs in a regime of genuine non-equilibrium behavior and the scaling deviates from the rate theory prediction.
pacs:
82.35.Lr; 36.20.-r; 87.15.AaKeywords: DNA renaturation.
1 Introduction
When a double-stranded DNA molecule is heated above some characteristic temperature it undergoes a denaturation or melting transition and the two strands separate [21]. The reverse process can also occur: two complementary single stranded nucleic acids at temperatures below their melting point bind to form a double-helix. This transition is known as renaturation [4].
The first investigation of the DNA renaturation kinetics dates back to the work of Wetmur and Davidson of the late sixties [22]. They experimentally measured the renaturation rate and found it scales as a function of , the length of the strands,
| (1) |
with . A recent detailed analysis of experimental data for DNAs from different organisms, with different conditions of salt and temperature was performed by Sikorav et al. [17] who estimated .
The origin of the exponent has been discussed in the literature [22, 16, 17]. Renaturation is believed to proceed via two steps: the formation of an active nucleus of a few base pairs, which is followed by a rapid zippering until the double helix is formed over its full length [4]. The rate-limiting step is the nucleus formation, therefore theoretical investigations of focus on the nucleation mechanism from the two separate strands. It was first believed that could be explained by the theory of diffusion limited reactions [16]. This is however at odds with more modern concepts of polymer physics, as explained in Ref. [17]: the correct analysis of diffusion limited reaction would imply a scaling of the type , which is not consistent with the experiments. According to Sikorav et al. [17], experimental data suggest that renaturation is an activated process. Using Kramers’ theory, in which the polymer dynamics is mapped into that of an effective Brownian particle escaping a potential barrier, they find that the rate of nucleation of two monomers scales as [17]:
| (2) |
where the exponent is that associated to the equilibrium contact probability through the middle monomer of the two renaturating polymers (see next section). As nucleation can occur in any of the monomers of the two approaching strands, one expects [17] the renaturation rate to scale as:
| (3) |
Using the numerical estimate [11] for self-avoiding walks in three dimensions one gets in good agreement with experiments.
The argument leading to Eq. (2) is based on a mapping of the DNA renaturation problem onto that of a single Brownian particle crossing a free energy barrier [17]. The barrier has an entropic origin: it is generated by excluded volume interactions of the two approaching strands. One applies then Kramers’ rate theory, which states that the transition rate is proportional to for a free-energy barrier and a temperature . For two polymers of length one has (see Eq. (7)), from which one obtains Eq. (2).
Mapping the complex polymer dynamics into that of a single effective Brownian particle performing a one dimensional motion is a huge simplification of the problem. Moreover Kramers’ approach assumes that the polymer dynamics is sufficiently slow so that at any given time the conformation of the polymer is well approximated by its equilibrium distribution.
To gain more insights into the origin of the exponent describing the scaling behavior of the rate constant as observed in experiments, we performed numerical simulations of a coarse-grained model of DNA renaturation. The model is similar to those used in the past for the study of equilibrium properties of the DNA denaturation transition [6, 5, 9]. It does not incorporate helical degrees of freedom of the double stranded DNA as the rate limiting step is nucleation, i.e. the first “reactive” contact between the approaching strands. The lattice nature of the model allows the simulation of long times and long polymers and, thus, an accurate determination of the scaling properties of the renaturation rates.
The dynamics of the DNA denaturation has attracted quite some attention in the recent literature [3, 10, 2], but the reverse process of renaturation has been less studied. Our results show that the renaturation process has a rich dynamics and that the scaling predicted by Kramers’ rate theory (Eqs. (2) and (3)) is only valid in a specific limiting case.
This paper is organized as follows: We start in the next section with a review of a few theoretical results about scaling properties of equilibrium free energies. In Section 3 we introduce the model used in this study and in Section 4 we present its equilibrium properties. The simulation results for the rate constants for renaturation are presented in Section 5. Finally, results are discussed in Section 6.
2 Scaling properties of equilibrium free energies
Before entering into the details of our simulations, we briefly recall the scaling properties of the free energy required to bring two self avoiding walks (SAWs) at a given fixed distance between their central monomers. Field theoretical models for swollen polymer systems predict that the canonical partition function of a star polymer with outgoing arms of length is given by [8]:
| (4) |
in the limit . In Eq. (4) is a non-universal parameter (the connectivity constant), while ’s are universal exponents associated to a vertex with outgoing legs. In a star there are -ends (each contributing with an exponent ) and one vertex with outgoing legs (contributing with an exponent ), as shown in Fig. 1 (a).The value of the exponents is known from numerical simulations [11] and field theoretical computations using expansions and resummation techniques [15].

Consider now two SAWs of length , whose central monomers are separated by a vector from each other. The partition function is given by:
| (5) |
where is a scaling function and the SAW metric exponent. When the two polymers are sufficiently far from each other , or one has , as the partition sum in Eq. (5) should reduce to , where is the partition function of a single self-avoiding walk. For , Eq. (5) should reduce to that of a 4-arm star polymer (see Fig. 1 (b)), which imposes the following scaling behavior in the limit
| (6) |
The numerical value for the exponent of three dimensional self-avoiding walks are [11], [20], therefore . From the limiting behaviors for and (a microscopic distance) one obtains the free energy difference between a configuration in which the two central monomers are far apart and a configuration where the monomers are at a distance as
| (7) |
One can repeat the same reasoning for contacts between end monomers (see Fig. 1 (c)). Let be the separation between two end points of the polymers. The partition function is
| (8) |
where again for , while the short distance limiting behavior is
| (9) |
with , hence .
Similar scaling arguments were applied to the study of thermal denaturation of double stranded DNA [12].
3 Model
We consider two self-avoiding walks of length on a face centered cubic (fcc) lattice, in which each site has nearest neighbors displaced by , , and . A configuration of the two walks is specified by the position of their monomers , , with . The two walks are also mutually avoiding, except at homologous monomers which can overlap, i.e. is only allowed if . In the renaturated state the two walks overlap over their full length, for all . The version of this model on the simple cubic lattice was introduced by Causo et al. [6] for studying the thermodynamics of DNA denaturation, i.e. the unbinding of a double stranded polymer due to a temperature increase.
In our simulations the starting configuration consists of two separate strands placed at random in a cubic box with periodic boundary conditions. The walks are first equilibrated while keeping their central monomer fixed. At time the polymers begin their diffusive motion until nucleation, i.e. the contact between homologous monomers, occurs. At that point the simulation ends and the nucleation time is registered. The polymer dynamics consists of local corner-flip or end-flip moves that do not violate self-avoidance. The probability that a given monomer moves is taken proportional to the number of nearest neighbors that can be reached on a fcc lattice: we randomly attempt on average Monte Carlo moves for each end-monomer and moves for each other monomer.
We performed simulations for polymers of various lengths up to , within a cubic simulation box with side (the lattice parameter being ). For the longest polymers considered in this work, the gyration radius is , which is still much smaller than the box size, thus the simulations are performed in the diluted regime. We verified that the simulations reproduce the expected Rouse dynamics behavior [7, 14] for a self avoiding walk. This model neglects hydrodynamics effects, which however are not expected to change the value of the exponents, at least in some regime (see Discussion).
The Monte Carlo dynamics satisfies detailed balance, therefore it would be possible also to infer the renaturation rate from an initial bound state and waiting until unbinding takes place. Here we prefer to use the direct simulation approach, as it is closer to the experimental setup.
4 Equilibrium properties
We focus first on the equilibrium probability distributions of two strands to verify the scaling form of the partition functions derived in Section 3. We ignore nucleation events and in a single long run we sample the equilibrium configurations of the diffusing strands. Let us denote with the distance between the middle monomers of the two strands and let be the probability distribution function for . If , with the radius of gyration of the two polymers, then , where is the number of points at distance from a given point in an fcc lattice. Asymptotically in we have , equivalent to uniform probability in three dimensional space.
The probability of finding the two central monomers at distances is suppressed due to mutual avoidance between the two interpenetrating strands. In order to get a good statistics on for we bias the dynamics so that configurations with small are favored. This biased dynamics works as follows. A move changing the distance between the middle monomers from to is accepted with probability , where and are the number of fcc lattice points at a distance and from the origin, respectively. The biased dynamics produces a probability distribution which scales as in the limit of large . This construction is particularly useful because we have , with introduced in Eqs. (5)-(6), that is, we can investigate directly the scaling function .
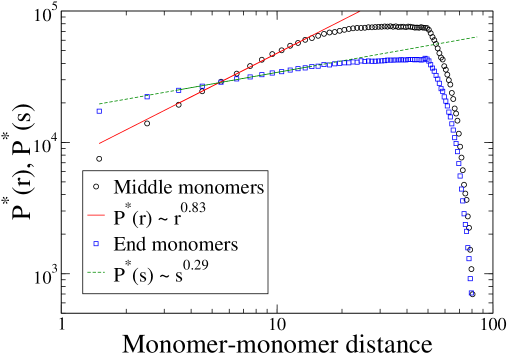
A plot of a for two strands with is shown in Fig. 2 (circles). For short distances the data reproduce the power-law behavior discussed in Eq. (6). For intermediate distances is constant, a signature that the two polymers are sufficiently far apart to be considered non-interacting (), whereas for longer distances the probability decays because of the finite size of the simulation box.
In Fig. 2 (squares) we also show a similar plot for , the reweighted distance between the end monomers. For the calculation we used again biased dynamics, where the bias is on the distance between two end monomers and it is constructed with similar rules as for the central monomers. The results are consistent with the power-law limiting behavior of Eq. (9).
5 Renaturation rates from simulations
We now turn to the renaturation dynamics. As mentioned in the Introduction, the rate limiting step in DNA renaturation is the formation of a nucleus of a few base pairs, from where a rapid zippering follows. In the simulation we focus on the time needed to reach a nucleation event and the simulation is stopped when nucleation occurs. The average nucleation time is calculated from typically about independent realizations, i.e. every time randomly generating the starting configuration of the two strands. This translates into an average elapsed real time of about two weeks on an Intel(R) Core(TM)2 Quad CPU Q9650 3.00GHz processor. The nucleation rate is then obtained by:
| (10) |
It has been observed experimentally that the two strands must overcome a free energy barrier of about Jmol [18] to form an active nucleus and that the nucleus corresponds to a double helix of about bases [13, 4]. Hence, the diffusion process may bring frequently two complementary monomers in contact, but many of these encounters are not “productive” as they do not lead to the formation of an active nucleus from which zippering of the helix would follow. We model this feature by introducing a local nucleation probability: a move that would bring two homologous monomers in contact [say ] is accepted with probability , otherwise it is rejected and the simulation continues. Hence, low values of correspond to high nucleation barriers and consequently long simulation times. To avoid confusion we will refer to the latter as a local barrier. This is not related to the free energy barrier originating from the mutual self avoidance of the renaturating strands discussed in the Introduction and given in Eq. (7). We will show below that the estimates of the scaling exponents depend on .
Nucleation times corresponding to different values of can be obtained during the same run. Consider a set of nucleation probability values , each representing a different system. At an attempt of a nucleation step we generate a random number uniformly distributed in the unit interval, and we consider as nucleated all systems for which . Their nucleation time is added to the corresponding statistics, and the simulation continues in order to sample the nucleation times of the remaining systems, until nucleation for the smallest value has been reached.
5.1 Rate of middle monomers nucleation
We consider first the nucleation between middle monomers. In this case the nucleation time is defined as the time for first contact between the two central monomers (for convenience we considered polymers with an odd number of monomers so that there is a unique middle monomer). In the course of the simulation two other analogous monomers may come in contact, say with , but the event is ignored and the simulation continues.
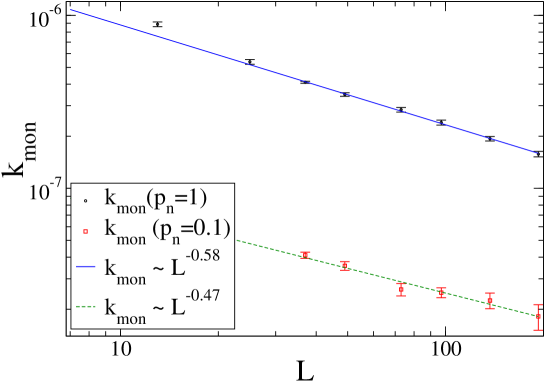
In Fig. 3 we show our numerical results using nucleation probabilities and and for polymers of length up to . For each length we typically sample about independent nucleation events. Both nucleation probabilities give a nucleation rate decaying as a power-law as a function of the length . However the exponent depends on . Our estimates, which are based on linear fits for , yield for (corresponding to the case of no local barrier) and for .
5.2 Rate of polymer nucleation
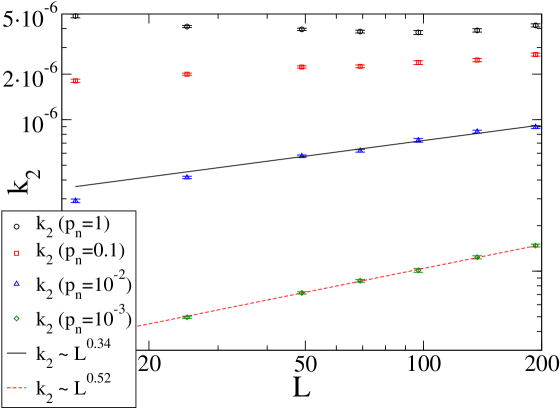
We consider next the nucleation rate of the whole polymer. We define the nucleation time as the first contact time between any of the complementary monomers. Figure 4 shows plots of as a function of for different values of the nucleation probability (). In absence of a local nucleation barrier () we find a non-monotonic behavior for . It decreases for , while it increases for larger . As the value of is lowered, becomes monotonic in . From a fit of the data for we obtain the estimates for , while for . Again, the exponent is consistent with that predicted by the Kramers’ theory (Eq. (3)) only for sufficiently low .
5.3 Rate of end monomers nucleation
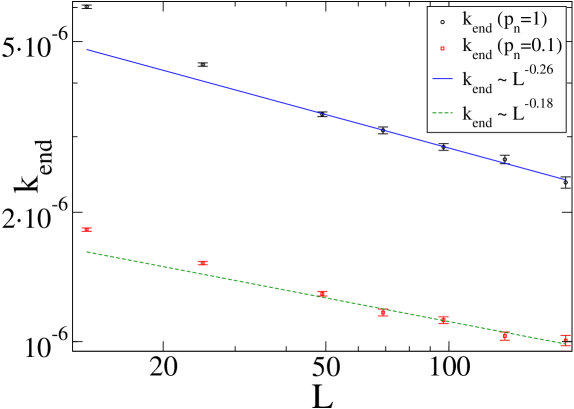
We finally studied the renaturation dynamics for end monomers. In this case we define the nucleation time as the time needed to nucleate the monomers at one edge of the strand, at position . Figure 3 shows the data of as a function of for two different values of the local nucleation probability. For we find as best fit to the data , while for . We also considered a smaller value of and found (data not shown). This suggests that a limiting value of the exponent has been reached. Kramers’ theory would predict a scaling for the renaturation rate of the end monomers as (see Eq. 3). Again for sufficiently low (high local nucleation barriers) the simulations results are in agreement with Kramers’ theory.
6 Discussion
In this paper we investigated a simple polymer lattice model of DNA renaturation. We focused on the scaling of the renaturation rate as a function of the polymer length. Three different rates were considered: the rates of renaturation for middle monomers (), for end monomers () and for the whole strands (). We also introduced a local nucleation probability which is associated to an additional local free energy barrier. In DNA this barrier corresponds to the free energy one has to overcome to form an active nucleus of about 10-15 bases from where a rapid zippering starts.
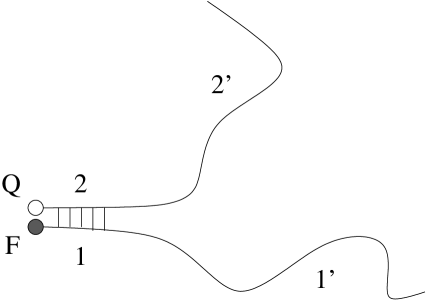
The simulations show that if the local barrier is sufficiently high () the exponents governing the scaling behavior of , and are all in agreement with Kramers’ rate theory. An increase of the local barrier corresponds to an increase of the simulation time since the polymers attempt an increasing number of unsuccessful nucleation events. The process is slow, therefore the probability distribution of finding two monomers at a given distance from each other approaches its equilibrium value. In this regime Kramers’ theory is expected to be valid. In addition, the whole strand renaturation rate scales with an exponent consistent with experimental data [17], which suggests that experimental conditions correspond to the high local barrier regime. Experiments so far focused on the rate , which is usually measured by monitoring the time dependence of the UV absorption spectrum. We argued, and verified in simulations in the high local barrier regime (), that the rate for end monomer nucleation scales as . By appropriately engineering the sequences of the renaturating strands one could mesure in experiments. For this purpose it is sufficient to consider two sequences which are complementary in end bases and non-complementary for the remaining bases (see Fig. 6). As hybridization can only occur at the edges, the dynamics is governed by . The detection can be done by a quencher-fluorophore pair as used in molecular beacons [19, 1]. The scaling of is determined by increasing while keeping fixed. A modification of the sequence architecture, e.g. using complementary stretches in the middle of the sequence, would allow one to determine the renaturation rate for a single monomer .
We also performed simulations in the low local barrier regime (). In this case the exponents for , and deviate from Kramers’ rate theory predictions. The renaturation is “fast” so that two complementary monomers in the approaching strands do not feel additional local barriers. In this regime it is natural to expect that at least one of the hypothesis behind Kramers’ theory breaks down, namely the assumption that the two approaching strands can be considered as being in quasi-equilibrium conformations. It would be tempting to think that renaturation becomes a diffusion-limited reaction in this regime, but this is actually not true as there is still a free energy barrier (Eq. (7)) generated by the self-avoidance interactions between the strands. A better quantitative understanding of this low local barrier regime remains challenging. We also expect that the exponents in this fast renaturation regime would be influenced by hydrodynamics effects which are not built in in our simulations. This is an important point to bear in mind in view of possible comparison with experimental data. Hydrodynamics should not influence however the regime as renaturation is slow and occurs between strands in quasi-equilibrium regime.
Another remark concerns the limit of validity of Eq. (3). As the rate grows with (due to the increasing number of nucleation sites as grows) we expect a deviation from Eq. (3) at some length beyond which renaturation becomes “too fast” in the sense discussed above: in this regime conformations of the approaching polymers are far from equilibrium. The scaling of as described by Kramers’ theory should hold for .
In conclusion, our simulations of renaturation show that the process has a very rich dynamical behavior. A key quantity appears to be the local free energy barrier for monomer-monomer nucleation. Different regimes appear in the limit of high barrier and of low barrier. The former regime is well-understood within the framework of Kramers’ rate theory, while a better analytical understanding of the latter one remains challenging.
Acknowledgements:
We are grateful to G.T. Barkema, H. Orland, J.-L. Sikorav and C. Vanderzande for interesting discussions.
References
References
- [1] T. Ambjornsson, S. K. Banik, O. Krichevsky, and R. Metzler. Sequence sensitivity of breathing dynamics in heteropolymer DNA. Phys Rev Lett, 97(12):128105, Sep 2006.
- [2] M. Baiesi and R. Livi. Multiple time scales in a model for dna denaturation dynamics. J. Phys. A: Math. Theor., 42:082003, 2009.
- [3] A. Bar, Y. Kafri, and D. Mukamel. Loop dynamics in DNA denaturation. Phys. Rev. Lett., 98(3):038103, 2007.
- [4] C. R. Cantor and P. R. Schimmel. Biophysical Chemistry, part III: The behavior of biological Macromolecules. W. H. Freeman, New York, 1980.
- [5] E. Carlon, E. Orlandini, and A. L. Stella. Roles of stiffness and excluded volume in DNA denaturation. Phys. Rev. Lett., 88:198101, 2002.
- [6] M. S. Causo, B. Coluzzi, and P. Grassberger. Simple model for the DNA denaturation transition. Phys. Rev. E, 62:3958, 2000.
- [7] M. Doi and S. F. Edwards. The Theory of Polymer Dynamics. Oxford University Press, New York, 1989.
- [8] B. Duplantier. Polymer network of fixed topology: Renormalization, exact critical exponent in two dimensions, and in . Phys. Rev. Lett., 57:941, 1986.
- [9] R. Everaers, S. Kumar, and C. Simm. Unified description of poly- and oligonucleotide DNA melting: nearest-neighbor, Poland-Sheraga, and lattice models. Phys. Rev. E, 75(4 Pt 1):041918, 2007.
- [10] H. C Fogedby and R. Metzler. DNA bubble dynamics as a quantum coulomb problem. Phys. Rev. Lett., 98(7):070601, 2007.
- [11] H. P. Hsu, W. Nadler, and P. Grassberger. Scaling of star polymers with 1-80 arms. Macromolecules, 37:4658–4663, 2004.
- [12] Y. Kafri, D. Mukamel, and L. Peliti. Melting and unzipping of DNA. Eur. Phys. J. B, 27:132, 2002.
- [13] G. S. Manning. On the application of polyelectrolyte limiting laws to the helix-coil transition of DNA. V. ionic effects on renaturation kinetics. Biopolymers, 15(7):1333–1343, 1976.
- [14] D. Panja, and G. T. Barkema. Rouse modes of self-avoiding flexible polymers J. Phys. Chem., 131:154903, 2009.
- [15] L. Schäfer, C. von Ferber, U. Lehr, and B. Duplantier. Renormalization of polymer networks and stars. Nuclear Physics B, 374(3):473 – 495, 1992.
- [16] K. S. Schmitz and J. M. Schurr. Role of orientation constraints and rotational diffusion in bimolecular solution kinetics. J. Phys. Chem., 76:534–545, 1972.
- [17] J. L. Sikorav, H. Orland, and A. Braslau. Mechanism of thermal renaturation and hybridization of nucleic acids: Kramers’ process and universality in Watson-Crick base pairing. J. Phys. Chem. B, 2009.
- [18] K. J. Thrower and A. R. Peacocke. Kinetic and spectrophotometric studies on the renaturation of deoxyribonucleic acid. Biochem. J., 109(4):543–557, 1968.
- [19] S. Tyagi and F. R. Kramer. Molecular beacons: probes that fluoresce upon hybridization. Nat. Biotechnol., 14(3):303–308, 1996.
- [20] C. Vanderzande. Lattice Models of Polymers. Cambridge University Press, Cambridge, 1998.
- [21] R. M. Wartell and A. S. Benight. Thermal denaturation of DNA molecules: A comparison of theory with experiments. Phys. Rep., 126:67, 1985.
- [22] J. G. Wetmur and N. Davidson. Kinetics of renaturation of DNA. J. Mol. Biol., 31(3):349–370, 1968.