Trends in Metal Oxide Stability for Nanorods, Nanotubes, and Surfaces
Abstract
The formation energies of nanostructures play an important role in determining their properties, including the catalytic activity. For the case of 15 different rutile and 8 different perovskite metal oxides, we find that the density functional theory (DFT) calculated formation energies of (2,2) nanorods, (3,3) nanotubes, and the (110) and (100) surfaces may be described semi-quantitatively by the fraction of metal–oxygen bonds broken and the bonding band centers in the bulk metal oxide.
pacs:
73.22.-f 71.15.Mb 73.21.-bThe search for cleaner and more sustainable forms of energy provides a strong impetus to the development of more affordable, active, selective and stable new catalysts to convert solar radiation into fuels DOE ; Crabtree . Just as the Haber-Bosch process fueled the population explosion of the 20 century HaberBosch1 ; HaberBosch2 , it is now hoped that new catalytic processes will provide sustainable energy in the 21 century DOE ; Crabtree .
Metal oxides are used extensively as catalysts, electrocatalysts, and photo-electrocatalysts review ; ElectrocatalysisRef24 ; ElectrocatalysisIrSnRuRef25 ; ElectrocatalysisIrTiRef26 ; ElectrocatalysisTiO2110Ref27 ; Rossmeisl200783 ; Rossmeisl2008 ; Fujishima1972 ; Khan2002 ; Hoffmann1995 ; Turner ; FirstPhotocatalysis ; Gratzel2001 . One important property of oxides is their high stability in harsh oxidizing environments compared to their pure metal counterparts.
The structure of oxide nanoparticles may be determined by the surface energy. For instance, for TiO2 it has recently been shown that it is the surface energies which determine whether it takes the anatase or rutile structure at the nanoscale TiO2SurfaceEnergies ; SurfaceEnthalpiesTiO2 . Typically, oxide catalysts are in the form of nanoparticles or highly porous materials. The catalytic properties of these materials are determined to a high degree by the surface Surfaces , and control of the surface structure will allow control of the reactivity TiO2 ; TiO2Nanowires ; TiO2AnataseNTs ; TiO2Rev1 . However, formation energies of metal oxide surfaces are difficult to measure experimentally, and only a few values are available in the literature TiO2SurfaceEnergies ; SurfaceEnthalpiesTiO2 . This makes the calculation of trends in surface and nanostructure energies an essential first step in understanding the properties of oxide catalysts, and the eventual design of novel catalytic materials.
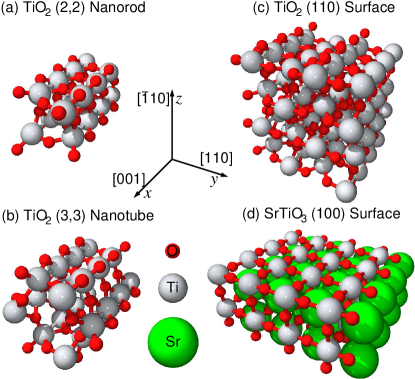
In this study we provide DFT calculated (2,2) nanorod, (3,3) nanotube, and (110) surface formation energies for 15 different rutile metal oxides, along with the (100) surface formation energies for 8 different perovskite metal oxides TiO2 . Both the (2,2) nanorod and (3,3) nanotube structures are obtained by first rolling up a sheet of the material in the PtO2 structure. But due to its small diameter, the (2,2) nanorod has a bonding structure resembling that of the bulk metal after relaxation, as shown in Fig. 1.
All DFT calculations have been performed with the plane wave code dacapo using the RPBE exchange-correlation (xc)-functional RPBE ; ASE , converged plane wave cutoffs of 350 eV and 400 eV for rutile and perovskite metal oxides respectively, along with a density cutoff of 500 eV. The occupation of the Kohn-Sham orbitals was calculated at eV, with all energies extrapolated to K. The product of the supercell dimensions and the number of k-points Monkhorst is 25 Å in all repeated directions. For the anti-symmetric perovskite surface slab calculations a dipole correction has been employed DipoleCorrection .
We have performed structural relaxations until a maximum force below 0.05 eV/Å was obtained. At the same time we have minimized the strain on the unit cell in all periodically repeated directions, and employed more than 10 Å of vacuum between repeated nanorods, nanotubes, and surface slabs. Schematics of the TiO2 (2,2) nanorod, (3,3) nanorod, and (110) surface, along with the SrTiO3 (100) TiO2 and SrO terminated surfaces termination are shown in Fig. 1. The supercells used have been repeated four times along the nanorod and nanotube axis in Fig. 1(a) and 1(b), and four times in the surface plane for the surfaces shown in Fig. 1(c) and 1(d). For the TiO2 (110) surface our four layer thick slab yields surface formation energies of 0.44 J/m2 in reasonable agreement with the GGA PWXC 12 layer thick slab value of 0.50 J/m2 TiO2SurfaceEnergies , and the B3LYP B3LYP 9 layer thick slab value of 0.67 J/m2 SnO2SurfaceEnergies . Differences amongst these values are attributable to the choice of xc-functional and number of layers, especially for uneven slab calculations, which tend to yield higher energies and converge slower TiO2SurfaceEnergies . As expected, these values are below the experimental nanoparticle surface energy of J/m2 for TiO2, as shown in Fig. 2 SurfaceEnthalpiesTiO2 .
Spin polarized calculations have been performed only for CrO2 and MnO2 rutile metal oxides, while all perovskites have been calculated spin polarized. However, spin only proved to be important for the energetics of CrO2, MnO2, SrCrO3, SrMnO3, SrFeO3, SrCoO3, and SrNiO3. A table of these results is provided in Ref. SupplementaryMaterial, .
Serious questions have been raised as to whether standard DFT calculatons can describe metal oxides with sufficient accuracy. For the purposes of the present study, it is worth noting that it has recently been demonstrated that DFT calculations do reproduce semi-quantitatively the formation energies of bulk rutile and perovskite metal oxides Martinez ; Calle .
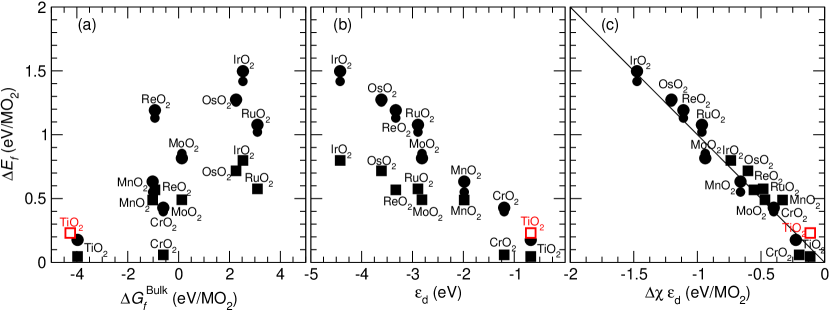
The formation energies of the various surfaces and nanostructures from Fig. 1 are shown in Fig. 2. In the following we shall analyze the nature of the formation energies, and relate them to other characteristics of the materials. An obvious choice of descriptor for the (110) metal oxide surface formation energy might be the bulk heat of formation , which is well described by DFT for rutile metal oxides Martinez . However, as shown in Fig. 2(a), these quantities appear to be poorly correlated. We instead observe a strong correlation between and the -band center for the bulk rutile metal oxides, as shown in Fig. 2(b). Here, is the average energy, relative to the Fermi level , of the density of states (DOS) projected onto the metal’s atomic -orbitals in the metal oxide , so that dband2007 . For the nanorod and nanotube formation energies, we also find little correlation with , but a strong correlation with .
This suggests metal oxide surface and nanostructure formation energies may be considered perturbations of the bulk metal oxide’s electronic structure due to bond breaking. In this case should be well described by the fraction of metal–oxygen (M–O) bonds which are broken , times the M–O bond energy in the bulk . For the case of (110) surface formation per MO, while for nanorod and nanotube formation per MO. Assuming , we indeed find that , as shown in Fig. 2(c).
This correlation may be explained qualitatively by recalling that the -band is most stable when the average energy of the DOS is , i.e. . In most cases this is equivalent to having a half full -band dband2007 . This is nearly the case for TiO2, where eV, and the (110) surface becomes very stable ( eV/TiO2). As the -band shifts down in energy, the energy stored in the M–O bonds increases accordingly, so that .
A more detailed analysis based on the molecular orbitals of the bulk metal oxide is presented in Refs. SupplementaryMaterial, ; ActaCrystalA, ; RutileBandStructure, ; GoodenoughReview, . To summarize, as the number of electrons increases, the M–O coordinately unsaturated (cus) bond becomes stronger. It is only this bond which is broken during (110) surface, nanorod and nanotube formation for rutile metal oxides. As shown in Ref. SupplementaryMaterial, , this occurs as we progress from non-cus bonding (2), M–M bond distortions (3), M–O cus bonding (4), non-bonding M orbitals with reduced distortions (5,6), to stronger M–O bonds (7). Further, for a fixed number of electrons we also find that the bond strength increases as the DOS shifts down in energy. In effect, the energy stored in rutile metal oxide M–O bonds is then equal to the energy cost for “shifting” the bonding metal orbitals so that their DOS is symmetric about the Fermi level. In such a case, both bonding with cus O atoms and distortions of the octahedral structure are minimized.
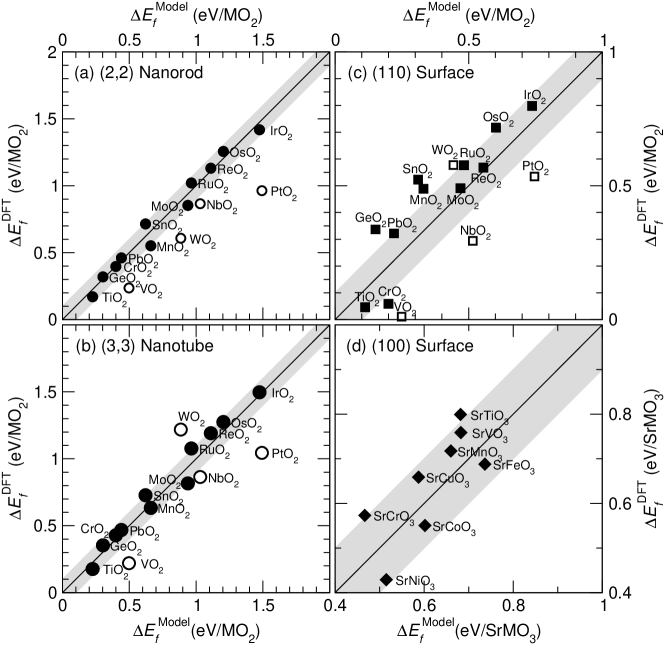
It is worth noting that we obtain near quantitative agreement between the DFT calculated formation energies and this simple model, when applied to naturally occurring transition metal rutile oxides. We now show how this model may be extended to post transition metal oxides (GeO2, SnO2, and PbO2) and 3 transition metal perovskites (SrMO3), as shown in Fig. 3.
For post transition metals, the -band is fully occupied, and does not participate in the M–O bonding. Instead, the M–O bonding should occur via the occupied portion () of the metal’s -band. In any case, we find that the M–O bond energy for post transition metal oxides is approximately negative one third the -band center , so that . This approximation yields near-quantitative formation energies for post transition metal nanorods, nanotubes, and (110) surfaces, as seen in Fig. 3(a), (b), and (c), respectively.
Since perovskite metal oxides share the MO6 octahedral structure of rutile metal oxides, with interstitial Sr Perovskites ; Cheng20051921 , it is reasonable to expect that the same correlation with the metal -band centers should hold. From the DFT calculations for the perovskite (100) surface, we obtain the average of the formation energies for both the MO2 and SrO terminated surfaces. As such, our model predicts , where per SrMO3 and per SrMO3. From Fig. 3(d), we find this is indeed the case.
In Fig. 3(a), (b), and (c) we also plot the DFT calculated formation energies versus for transition metals whose most stable metal oxide phase is not rutile. For these compounds, denoted by open symbols in Fig. 3, we find our model typically overestimates formation energies.
For the HexABC layer structure of PtO2 TiO2 we find the formation energies are completely independent of and , as shown in Ref. SupplementaryMaterial, . However, this is also predicted by our model, since no M–O bonds are broken () when forming the HexABC layer. Instead, the energy cost to form the HexABC layer is related to the preference of oxygen to be either or hybridized in the metal oxide.
In conclusion, we have demonstrated that the formation energies for nanotubes, nanorods, and surfaces of metal oxides may be determined semi-quantitatively from the fraction of M–O bonds which are broken and the bonding band centers and in the bulk metal oxide. We anticipate such models will prove useful in predicting the formation energy of doped metal oxide surfaces and nanostructures, their reactant adsorption energies, and their activities.
Acknowledgements.
The authors acknowledge financial support from the Danish Center for Scientific Computing and NABIIT. J.I.M. acknowledges the financial support of the STREP EU APOLLON-B Project, and F.C.-V. acknowledges financial support from the Strategic Electrochemistry Research Center (SERC). The Center for Atomic-scale Materials Design (CAMD) is sponsored by the Lundbeck Foundation.References
- (1) J. Hemminger, G. Crabtree, and M. Kastner, eds., The Energy Challenges Report: New Science for a Secure and Sustainable Energy Future (Argonne National Laboratory, Argonne, Illinois, 2008).
- (2) G. M. Whitesides and G. W. Crabtree, “Don’t forget long-term fundamental research in energy”, Science 315, 796 (Feb. 2007), doi:10.1126/science.1140362.
- (3) V. Smil, “Detonator of the population explosion”, Nature 400, 415 (Jul. 1999), doi:10.1038/22672 Millennium Essay.
- (4) J. W. Erisman, M. A. Sutton, J. Galloway, Z. Klimont, and W. Winiwarter, “How a century of ammonia synthesis changed the world”, Nat. Geosci. 1, 636 (Sep. 2008), doi:10.1038/ngeo325.
- (5) J. Murphy, S. Srinivasan, and B. E. Conway, eds., Electrochemistry in Transition: From the 20th to the 21st Century (Plenum, New York, 1992).
- (6) S. Trasatti, “Electrocatalysis in the anodic evolution of oxygen and chlorine”, Electrochim. Acta 29(11), 1503 (1984), doi:10.1016/0013-4686(84)85004-5.
- (7) A. Marshall, B. Børresen, G. Hagen, S. Sunde, M. Tsypkin, and R. Tunold, “Iridium oxide-based nanocrystalline particles as oxygen evolution electrocatalysts”, Russ. J. Electrochem. 42(10), 1134 (Oct. 2006), doi:10.1134/S1023193506100223.
- (8) E. Guerrini, H. Chen, and S. Trasatti, “Oxygen evolution on aged IrOx/Ti electrodes in alkaline solutions”, J. Solid State Electrochem. 11(7), 939 (Jul. 2007), doi:10.1007/s10008-006-0238-4.
- (9) S. Chrétien and H. Metiu, “O2 evolution on a clean partially reduced rutile TiO2(110) surface and on the same surface precovered with Au1 and Au2: The importance of spin conservation”, J. Chem. Phys. 129(7), 074705 (2008), doi:10.1063/1.2956506.
- (10) J. Rossmeisl, Z.-W. Qu, H. Zhu, G.-J. Kroes, and J. Nørskov, “Electrolysis of water on oxide surfaces”, J. Electroanal. Chem. 607(1-2), 83 (2007), doi:10.1016/j.jelechem.2006.11.008.
- (11) Á. Valdés, Z.-W. Qu, G.-J. Kroes, J. Rossmeisl, and J. K. Nørskov, “Oxidation and photo-oxidation of water on TiO2 surface”, J. Phys. Chem. C 112(26), 9872 (2008), doi:10.1021/jp711929d.
- (12) A. Fujishima and K. Honda, “Electrochemical photolysis of water at a semiconductor electrode”, Nature 238, 37 (1972), doi:10.1038/238037a0.
- (13) S. U. M. Khan, M. Al-Shahry, and W. B. Ingler, “Efficient photochemical water splitting by a chemically modified n-TiO2”, Science 297, 2243 (2002).
- (14) M. R. Hoffmann, S. T. Martin, W. Y. Choi, and D. W. Bahnmann, “Environmental applications of semiconductor photocatalysis”, Chem. Rev. 95, 69 (1995), doi:10.1021/cr00033a004.
- (15) O. Khaselev and J. A. Turner, “A monolithic photovoltaic-photoelectrochemical device for hydrogen production via water splitting”, Science 280(5362), 425 (Apr. 1998), doi:10.1126/science.280.5362.425.
- (16) A. Heller, “Hydrogen-evolving solar cells”, Science 223(4641), 1141 (Mar. 1984), doi:10.1126/science.223.4641.1141.
- (17) M. Grätzel, “Photoelectrochemical cells”, Nature 414(6861), 338 (2001).
- (18) H. Perron, J. Vandenborre, C. Domain, R. Drot, J. Roques, E. Simoni, J.-J. Ehrhardt, and H. Catalette, “Combined investigation of water sorption on TiO2 rutile (110) single crystal face: XPS vs. periodic DFT”, Surf. Sci. 601, 518 (2007), doi:10.1016/j.susc.2006.10.015.
- (19) M. R. Ranade, A. Navrotsky, H. Z. Zhang, J. F. Banfield, S. H. Elder, A. Zaban, P. H. Borse, S. K. Kulkaml, G. S. Doran, and H. J. Whitfield, “Energetics of nanorystalline TiO2”, PNAS 99(2), 6476 (2001), doi:10.1073/pnas.251534898.
- (20) J. Rogal and K. Reuter, Ab initio atomistic thermodynamics for surfaces: A primer. (Educational Notes RTO-EN-AVT-142, Neuilly-sur-Seine, 2007), ISBN isbn978-92-837-0057-9.
- (21) D. J. Mowbray, J. I. Martínez, J. M. García Lastra, K. S. Thygesen, and K. W. Jacobsen, “Stability and electronic properties of TiO2 nanostructures with and without B and N doping”, J. Chem. Phys. 131, 014101 (2009), doi:10.1063/1.3148892.
- (22) D. N. Tafen and J. P. Lewis, “Structure, stability, and electronic properties of thin TiO2 nanowires”, Phys. Rev. B 80, 014104 (2009), doi:10.1103/PhysRevB.80.014104.
- (23) A. Bandura and R. Evarestov, “From anatase (1 0 1) surface to tio2 nanotubes: Rolling procedure and first principles lcao calculations”, Surface Science 603(18), L117 (2009), doi:10.1016/j.susc.2009.07.041.
- (24) D. V. Bavykin, J. M. Friedrich, and F. C. Walsh, “Protonates titanates and TiO2 nanostructured materials: Synthesis, properties, and applications”, Adv. Mater. 18, 2807 (2006), doi:10.1002/adma.20050296.
- (25) J. I. Martínez, H. A. Hansen, J. Rossmeisl, and J. K. Nørskov, “Formation energies of rutile metal dioxides using density functional theory”, Phys. Rev. B 79, 045120 (2009), doi:10.1103/PhysRevB.79.045120.
- (26) D. Lide, Handbook of Chemistry and Physics, 87th ed. (CRC-Press, 2006–2007).
- (27) M. Pourbaix, Atlas of Electrochemical Equilibria in Aqueus Solutions (Pergamon, London, 1966).
- (28) B. Hammer, L. B. Hansen, and J. K. Norskov, “Improved adsorption energetics with density functional theory using revised Perdew-Burke-Ernzerhof functionals”, Phys. Rev. B 59(11), 7413 (1999), doi:10.1103/PhysRevB.59.7413.
- (29) S. R. Bahn and K. W. Jacobsen, “An object-oriented scripting interface to a legacy electronic structure code”, Comput. Sci. Eng. 4(3), 56 (May 2002).
- (30) H. J. Monkhorst and J. D. Pack, Phys. Rev. B 13, 5188 (1976), doi:10.1103/PhysRevB.13.5188.
- (31) L. Bengtsson, “Dipole correction for supercell calculations”, Phys. Rev. B 59(19), 12301 (1999), doi:10.1103/PhysRevB.59.12301.
- (32) A. G. Schrott, J. A. Misewich, M. Copel, D. W. Abraham, and Y. Zhang, “A-site surface termination in strontium titanate single crystals”, Appl. Phys. Lett. 79(12), 1786 (2001), URL http://link.aip.org/link/?APL/79/1786/1, doi:10.1063/1.1404129.
- (33) J. P. Perdew and Y. Wang, “Accurate and simple analytic representation of the electron-gas correlation energy”, Phys. Rev. B 45(23), 13244 (1992), doi:10.1103/PhysRevB.45.13244.
- (34) A. D. Becke, “Density-functional thermochemistry. iii. the role of exact exchange”, J. Chem. Phys. 98(7), 5648 (Apr. 1993), doi:10.1063/1.464913.
- (35) A. Beltrán, J. Andrés, J. R. Sambrano, and E. Longo, “Density functional theory study on the structural and electronic properties of low index rutile surfaces for TiO2/SnO2/TiO2 and SnO2/TiO2/SnO2 composite systems”, J. Phys. Chem. A 112, 8943 (2008), doi:10.1021/jp801604n.
- (36) See supplementary material for further details.
- (37) J. I. Martínez, F. Calle-Vallejo, and J. Rossmeisl (2009), private communication.
- (38) T. Bligaard and J. K. Nørskov, “Ligand effects in heterogeneous catalysis and electrochemistry”, Electrochim. Acta 52, 5512 (2007), doi:10.1016/j.electacta.2007.02.0414.
- (39) B. Jiang, J. M. Zuo, N. Jiang, M. O’Keeffe, and J. C. H. Spence, “Charge density and chemical bonding in rutile, TiO2”, Acta Crystal. A 59, 341 (2003).
- (40) D. B. Rogers, R. D. Shannon, A. W. Sleight, and J. L. Gillson, “Crystal chemistry of metal dioxides with rutile-related structures”, Inorg. Chem. 8(4), 841 (1969), doi:10.1021/ic50074a029.
- (41) J. B. Goodenough, “Metallic oxides”, Prog. Solid State Chem. 5, 145 (1971), doi:10.1016/0079-6786(71)90018-5.
- (42) H. Yokokawa, Ann. Rev. Mater. Res. 33, 581 (Apr. 2003), doi:10.1146/annurev.matsci.33.022802.093856.
- (43) Z. Cheng, S. Zha, L. Aguilar, and M. Liu, “Chemical, electrical, and thermal properties of strontium doped lanthanum vanadate”, Solid State Ionics 176(23-24), 1921 (2005), doi:DOI: 10.1016/j.ssi.2005.05.009.