University of Tsukuba
E-mail
On behalf of the CDF and DØ Collaborations.
Abstract:
Measurements of Flavor Changing Neutral Current (FCNC) processes (rare decays, flavor mixing) play a key role to pursue new physics beyond the Standard Model.
We present recent analysis results about some FCNC transitions performed by CDF and D0 collaborations, including the first observation of the mode, the forward-backward asymmetry measurement in , and updated measurements of ,
using data corresponding to integrated luminosities from to .
We also show the CDF/D0 combined measurement of the mixing phase using of data per experiment.
1 Introduction
In order to pursue new physics beyond the Standard Model (SM),
the Tevatron collider with provides powerful approach with hadrons.
At the Tevatron quarks are pair-produced with enormous cross section [1], which is three orders of magnitude higher than at colliders, and generate all sorts of hadrons.
This provides privileged access to SM-suppressed processes such as FCNC transitions and
violation in mixing.
These approaches from flavor sector at Tevatron are complementary to
direct searches for BSM processes like Supersymetry (SUSY) particles,
and also physics at the experiments.
In this paper we focus on studies for some promising FCNC processes;
, ,
,
and
mixing,
performed by CDF and D0 collaborations.
2 Rare decays
2.1 and
The and decays are dominated
by the FCNC transition.
In the SM framework, the quark transition is forbidden at the tree level.
It may occur via / penguin diagram or a box diagram at the lowest order.
A new physics process could enhance the decay amplitude and it might be seen as an interference with the SM amplitude.
Therefore we measure various observables related to the magnitude or the complex phase, like branching ratio, polarization or forward-backward asymmetry.
CDF selects two oppositely charged muon candidates with a momentum transverse to the beamline,
, greater than 1.5 or 2.0, depending on the trigger selection.
We then reconstruct signal candidates, where stands for , , or , and
stands for or respectively.
The is reconstructed in the mode , and
the is reconstructed as .
To enhance separation of signal from background we employ an artificial neural network (NN) technique.
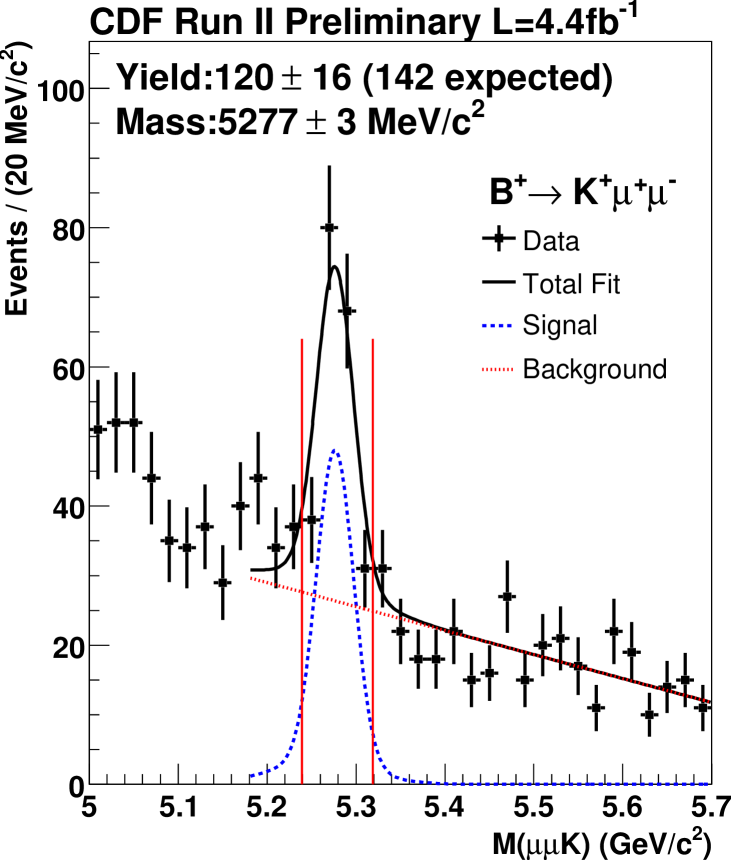
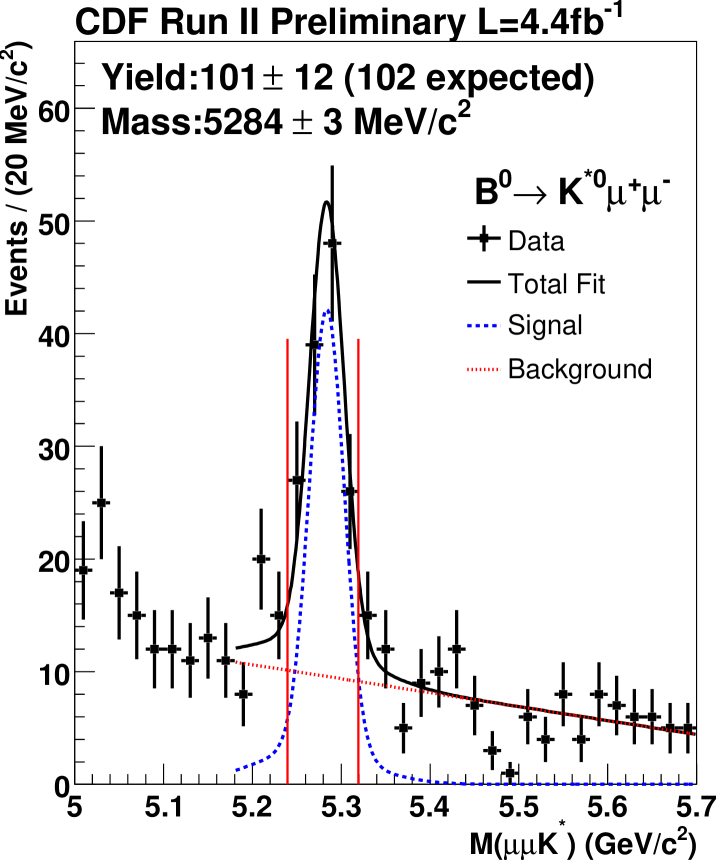
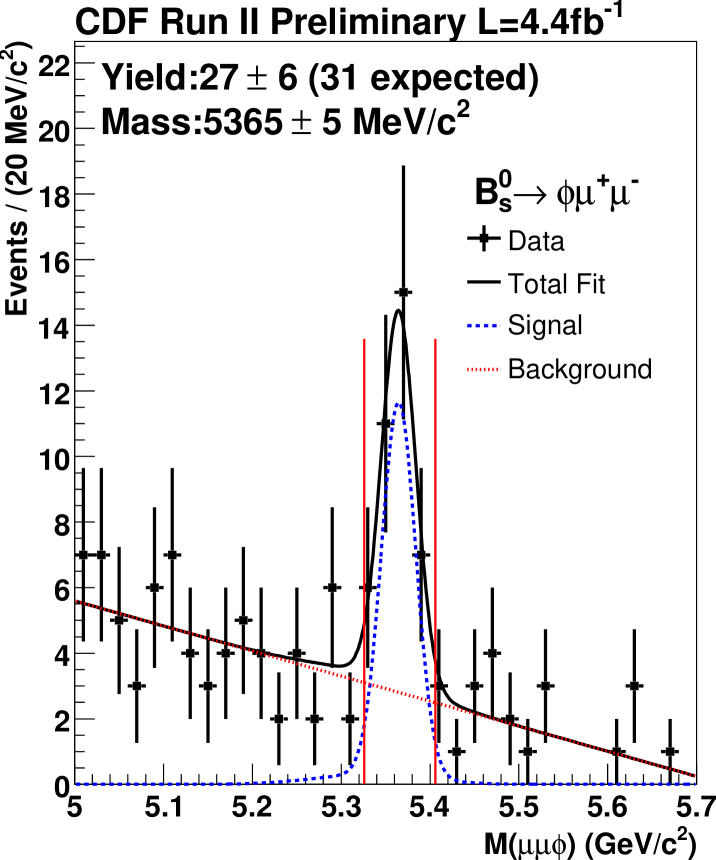
Fig. 1 shows invariant mass distribution for each rare decay.
Figure 1: The invariant mass of (left), (middle), and (right)
for , respectively.
The signal yield is obtained by an unbinned maximum log-likelihood fit of the invariant mass distribution.
From the mass fit with of data [2],
we obtain (), (), and () signal yields,
with , , and statistical significance, respectively.
This is the first observation of the mode.
Obtained yields are consistent with world average and theoretical expectations.
We measure the branching fractions of rare decays relative to the corresponding reference channels, ,
which have same final states as rare decays but with an intermediate resonance.
Using PDG [3] values for BR of reference decays we obtain
,
,
.
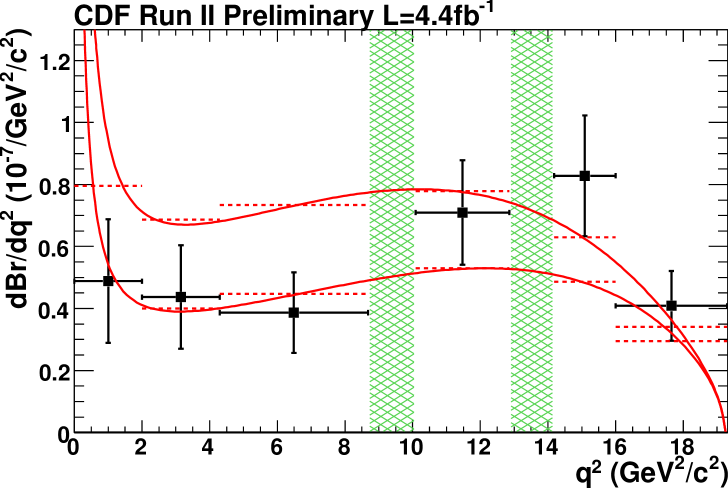
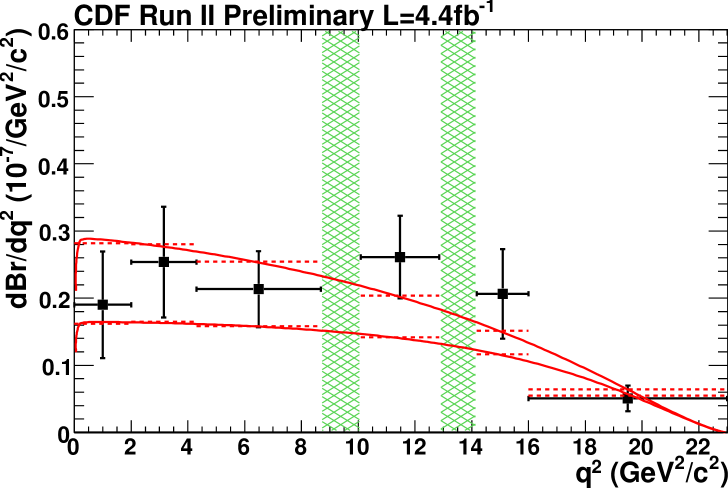
We measure the differential decay rate with respect to the dimuon mass.
The signal region is divided into six bins, where .
To obtain the number of signal events in each bin we use
the same procedure used in the global yield fit.
Fig. 2 shows the differential branching fraction for and .
Figure 2: Differential BR of (left) and (right).
Hatched regions are charmonium veto regions.
Solid lines are the SM expectation [4], which use maximum- and minimum- allowed form factor.
Dashed line is the averaged theoretical curve in each bin.
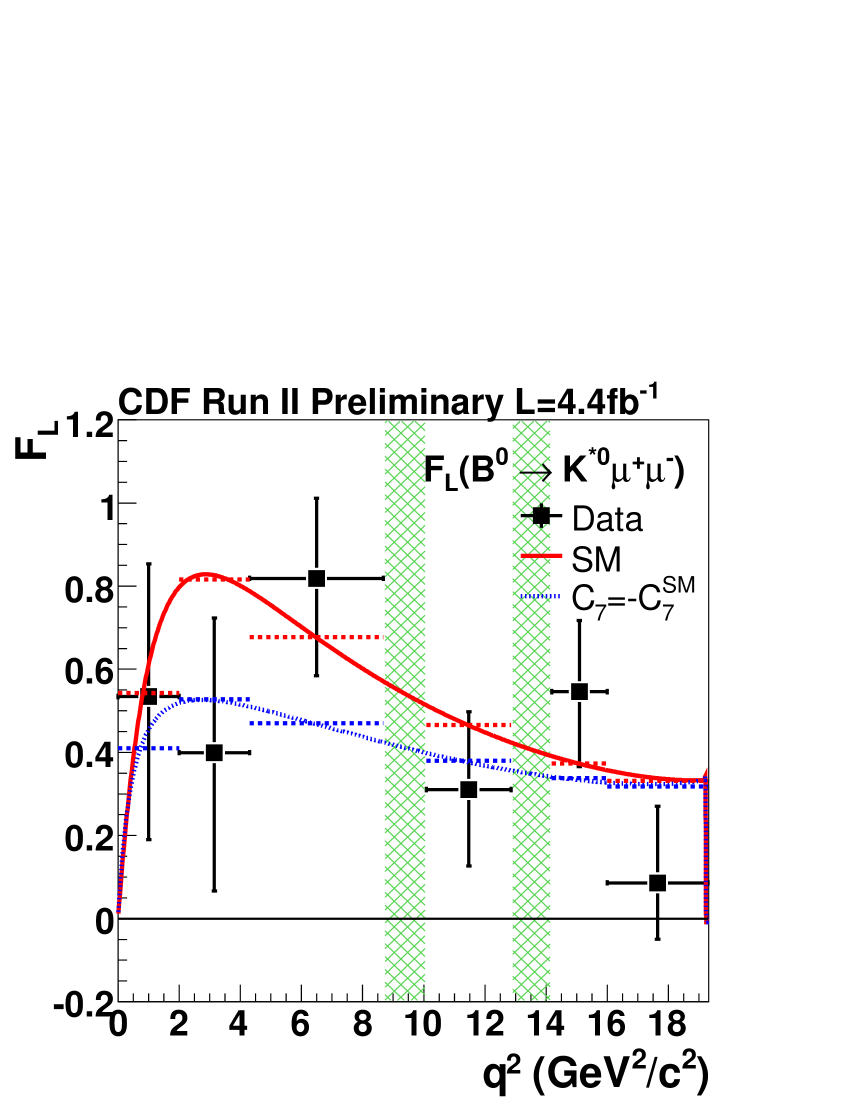
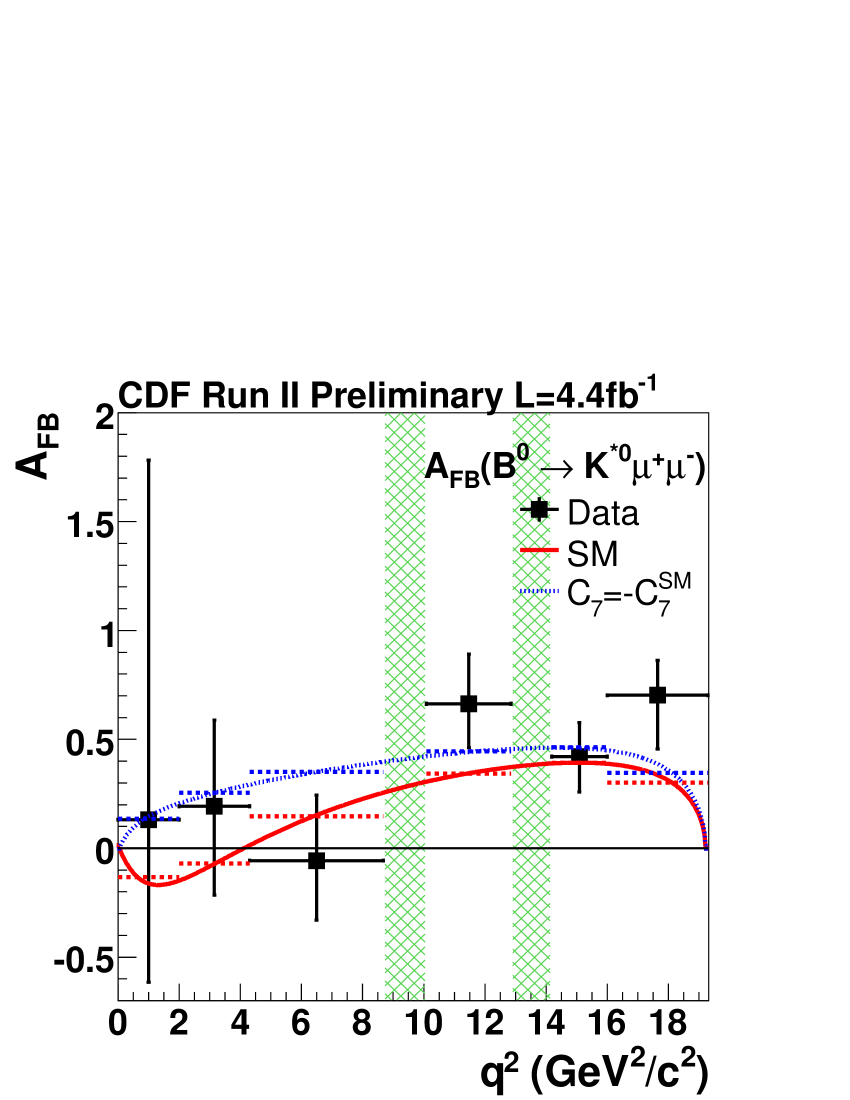
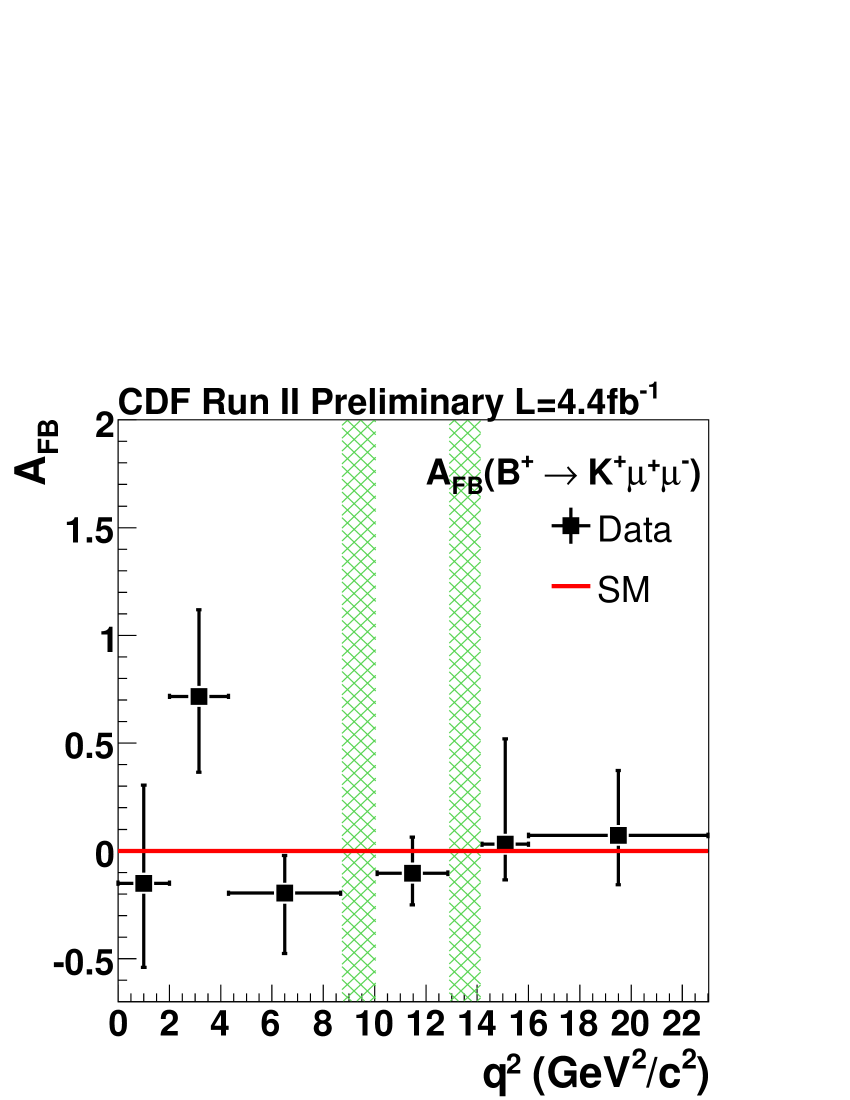
The forward-backward asymmetry () and longitudinal polarization () are extracted from and distributions, respectively, where
is the helicity angle between () direction and the opposite of the () direction in the dimuon restframe, and
is the angle between the kaon direction and the direction opposite to the meson in the rest frame.
We measure and for and also for .
Fit results are shown in Fig. 3.
Both and are consistent with the SM and also an example of SUSY model.
Our results are also consistent and competitive with B-factories measurements [5, 6].
Figure 3: (left) and (middle) fit results as a function of for and
(right) as a function of for .
The points show data.
Solid (dotted) curve is the SM (an example of SUSY) expectation [4].
Dashed line is the averaged expectation in each bin.
Hatched regions mean charmonium veto.
2.2
The decays are also dominated by FCNC process. The decay rates are
further suppressed by the helicity factor, .
The decay is also suppressed with respect to the decay
by the ratio of CKM elements, .
The SM expectations for these branching fractions are
and [7].
As many new physics models can enhance the BR significantly,
these decays provide sensitive probes for new physics.
CDF selects two oppositely charged muon candidates within a dimuon invariant mass windows of
.The muon candidates are required to have , and ,
where is the transverse component of the sum of the muon momentum vectors.
For CDF analysis, we employ NN to select signal events.
The event selection is checked with
control samples of and sideband in data that the background estimates are correctly predicted.
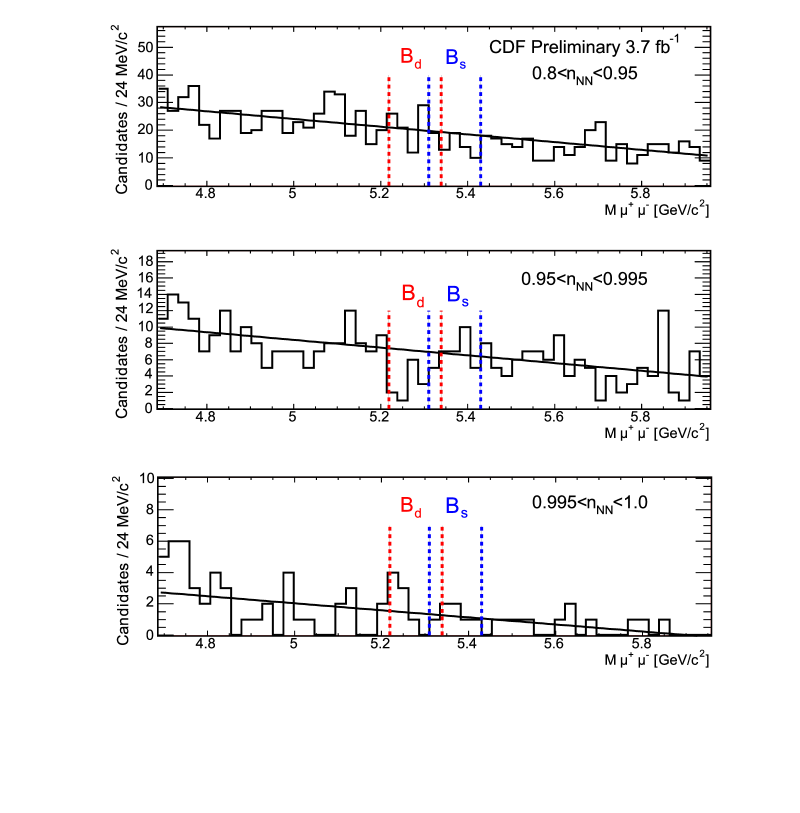
The invariant mass distributions for the three different NN ranges are shown in Fig. 4,
using 3.7 of data.
In the absence of signal, we extract 95% (90%) C.L. limits of [8] and
[8], which are currently the world’s best upper limits
for both processes.
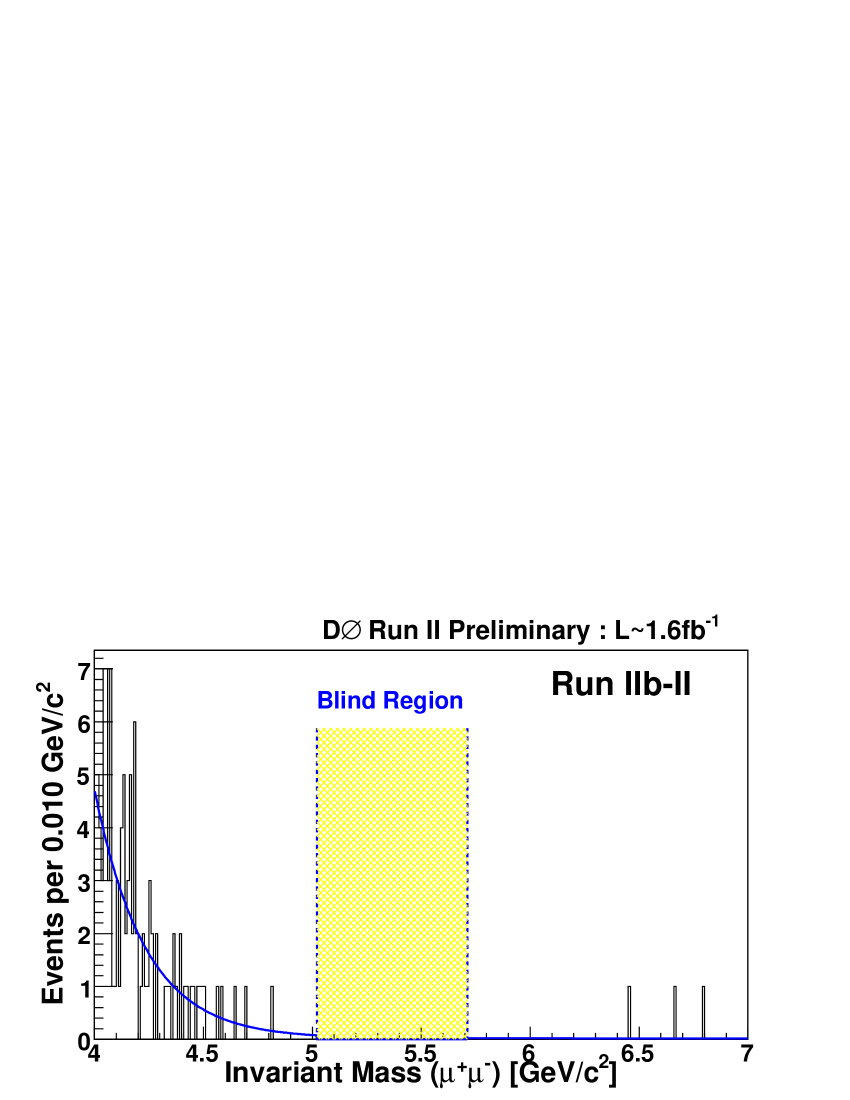
D0 performs a similar analysis but employs a Boosted Decision Tree (BDT) instead of NN.
With 5 of data, D0 has studied the sensitivity to the
branching fraction of decays. An expected upper limit on the branching fraction is
at the 95(90)% C.L. [9].
Figure 4: Left: Dimuon invariant mass distribution for CDF events satisfying all selection criteria for the three ranges of NN.
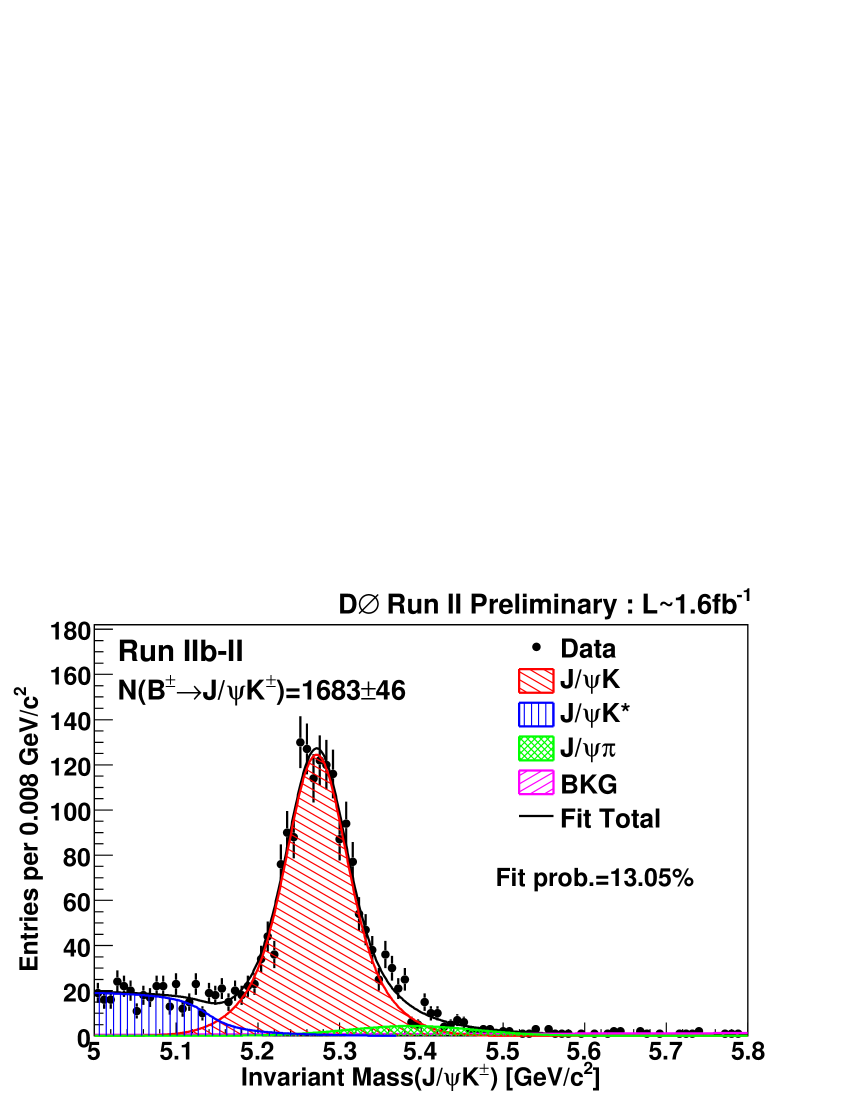
Right top: Dimuon invariant mass distribution for D0 events after the BDT cut. Search box remains blinded.
Right bottom: events used as a control sample, in D0 data after applying the BDT cut.
3 Measurement of the mixing phase
Analogously to the neutral system, violation in system may occur also through
interference of decays with and without the - mixing.
The mixing occurs via second order weak processes. It is described in the SM by and , mass and decay width difference of the two mass eigenstates, and .
The quantity is sensitive to new physics effects
that affect the phase ,
where and are the off-diagonal elements of the mass and decay matrices.
In the SM, the is predicted to be small as 0.004 [10].
If new physics has different phase from the SM,
the could be dominated by .
In this case we can access the phase by studying the time-evolution of decays.
The violating phase is defined as the phase between the direct decay amplitude and mixing followed by decay amplitude.
The is described by CKM matrix elements as and predicted to be small, 0.02 [10].
Since contributes to both and ,
large would indicate existence of new physics contribution.
To extract and , an unbinned maximum likelihood is performed.
The consists of both -even and -odd final states.
Although the observed asymmetry might be diluted by the opposite components,
we can perform unbiased measurement taking into account time evolution of angular distributions of the decay products.
Information about mixing is obtained from flavor tagging of meson, which is based on
kaon tracks associated with the meson and
the properties and decay tracks of the other hadron in the event.
Since there is an exact symmetry in the signal probability density function, which contains the strong phases among the three partial waves,
the likelihood function shows two symmetric minima in the - plane.
Both CDF and D0 have performed flavour tagged analysis on 2.8 of data [11, 12].
CDF selected about 3200 signal events with NN, while D0 selected about 2000 signal events with a cut based selection.
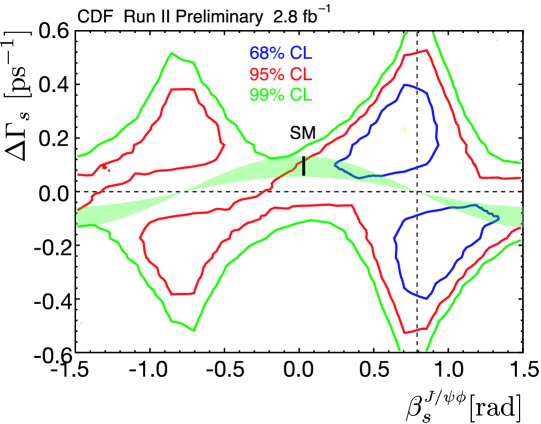
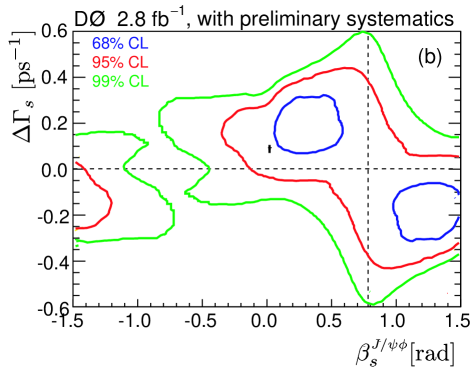
Fig. 5 (top left) shows the confidence regions for CDF and
Fig. 5 (top right) shows the fit result for D0.
D0 updates the result from their previous publication result, which restricted the strong phases and to the values measured in the system.
D0 removes the constraints and also includes systematic uncertainties on .
Currently the compatibility with the SM point is 1.8 for CDF and 1.2 for D0.
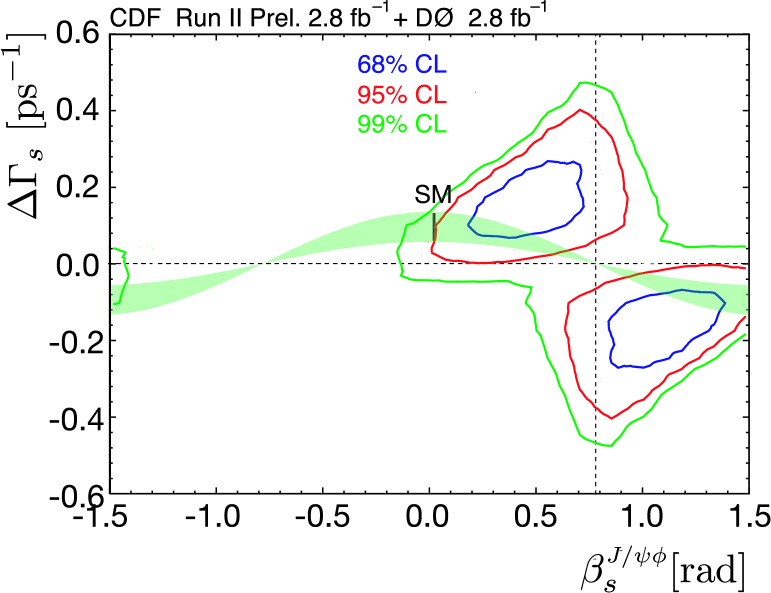
We then combine both profile likelihoods. Detail of combination is described in Ref. [13].
Fig. 5 (bottom) shows the combined results of CDF and D0, which exhibit a deviation from the SM.
Figure 5:
Two-dimensional profile likelihood as confidence contours of and for CDF’s preliminary analysis using of data (top left) and
D0’s published analysis using of data,
but allowing strong phases, to float and systematic uncertainties are included (top right),
and the combined results (bottom).
The SM expectation and uncertainty (, )=
(, ) [10] is indicated by the black line.
The region allowed in new physics model given by
is also shown (light green band).
4 Conclusion
At the Tevatron a rich physics program is ongoing.
CDF reports the first observation of and measures in hadron collisions,
which is competitive to B-factories.
CDF updates the analysis using and continues to improve its world-leading upper limit.
D0 continues to improve their analysis and with their expected limit is
at the 95(90)% C.L..
Both CDF and D0 have updated their measurements with using of data.
Combined result of both experiments shows a deviation from the SM.
The Tevatron is performing well with planed running through 2011 will provide double the datasets used for results presented here.
References
[1]
T. Aaltonen et al. (CDF Collaboration),
Phys. Rev. D79, 092003 (2009), arXiv:0903.2403.
[2]
CDF Collaboration, Public Note 10047.
[3]
C. Amsler et al. (Particle Data Group),
Phys. Lett. B667, 1 (2008).
[4]
A. Ali, P. Ball, L. T. Handoko, and G. Hiller,
Phys. Rev. D61, 074024 (2000), arXiv:hep-ph/9910221.
[5]
J. T. Wei et al. (BELLE Collaboration),
Phys. Rev. Lett. 103, 171801 (2009), arXiv:0904.0770.
[6]
B. Aubert et al. (BABAR Collaboration),
Phys. Rev. D79, 031102 (2009), arXiv:0804.4412.
[7]
A. J. Buras,
Phys. Lett. B566, 115 (2003), arXiv:hep-ph/0303060.
[8]
CDF Collaboration, Public Note 8042.
[9]
D0 Collaboration, Conferece Note 5906.
[10]
A. Lenz and U. Nierste,
JHEP 06, 072 (2007), arXiv:hep-ph/0612167.
[11]
CDF Collaboration, Public Note 9458.
[12]
V. M. Abazov et al. (D0 Collaboration),
Phys. Rev. Lett. 101, 241801 (2008), arXiv:0802.2255.
[13]
CDF and D0 Collaborations, CDF Public Note 9787 and D0 Conference Note 5928.