The Radio Jet Interaction in NGC 5929: Direct Detection of Shocked Gas
Abstract
We report the discovery of kinematic shock signatures associated with a localized radio jet interaction in the merging Seyfert galaxy NGC 5929. We explore the velocity-dependent ionization structure of the gas and find that low ionization gas at the interaction site is significantly more disturbed than high ionization gas, which we attribute to a local enhancement of shock ionization due to the influence of the jet. The characteristic width of the broad low-ionization emission is consistent with shock velocities predicted from the ionization conditions of the gas. We interpret the relative prominence of shocks to the high density of gas in nuclear environment of the galaxy and place some constraints of their importance as feedback mechanisms in Seyferts.
Subject headings:
galaxies: Seyfert — galaxies: jets — line: profiles — shock waves — galaxies: interactions1. Introduction
Most Seyfert AGN are associated with weak nuclear radio sources which show radio spectral indices and morphologies (if resolved) consistent with synchrotron-emitting jets and lobes (Ulvestad & Wilson, 1984; Nagar et al., 1999), though their physical properties are poorly constrained. However, they are effective avenues of kinetic and thermal feedback from the active nucleus and may play an important role in determining the evolution of the central spheroid.
In the small fraction of Seyferts with kpc-scale radio jets, several studies have uncovered clear signatures of interactions between the jet and surrounding gas, in the form of disturbed emission line profiles in the inner Narrow-Line Region (NLR), as well as close associations between resolved jet structures and NLR gas (e.g. Whittle et al., 1988; Capetti et al., 1996; Falcke et al., 1998; Cooke et al., 2000; Cecil et al., 2002; Whittle & Wilson, 2004). Depending on the physical make-up of the jet, relativistic or ram pressure can drive fast shocks, compressing, sweeping up and altering the appearance of the NLR. Postshock gas, with a temperature of several K, is a source of ionizing photons which couple the shock properties to the ionization state of the surrounding gas (e.g. Dopita & Sutherland, 1996). Shocks and winds can also change the distribution of ISM phases in the NLR by destroying and ablating clouds (Fragile et al., 2005). While the active nucleus is usually the dominant source of ionization even in strongly jetted Seyferts (e.g. Whittle et al., 2005), widespread shocks driven by a jet can alter the ionization of the NLR by affecting the properties of the ISM.
Studies of shock structure and energetics (Dopita & Sutherland, 1996; Allen et al., 2008) predict strong differences between the emission line spectrum of dense post-shock gas and gas that is ionized by, but not in direct dynamical contact with, the shock (the precursor). Therefore, a clear signature of shock ionized gas is a difference between the line profiles of low and high ionization lines, which are preferentially produced by post-shock and precursor gas, respectively (Whittle et al., 2005).
In this work, we present an HST/STIS spectroscopic study of NGC 5929, a local Seyfert galaxy with a well-studied bi-polar radio jet. Previous ground-based spectroscopic studies find evidence of a localized interaction between the jet and the near-nuclear emission line gas (Whittle et al., 1986; Wakamatsu & Nishida, 1988; Taylor et al., 1989; Wilson & Keel, 1989; Ferruit et al., 1997). The datasets and analysis methods used are briefly reviewed in . Direct shock features and a picture of the interaction are developed in and . We discuss the role of shocks in Seyferts and AGN feedback in . NGC 5929 has a systemic heliocentric velocity of km s-1 based on the stellar aborption line redshift of Nelson & Whittle (1995), which corresponds to pc arcsec-1 (H km s-1 Mpc-1).
2. Observations and Reductions
2.1. STIS Dataset
Our principal dataset is two medium-dispersion STIS G430M long-slit spectra covering the lines of the [O III] doublet and H (HST Program: GO 8253; PI : Whittle). The data was spectrophotometrically calibrated using the CALSTIS pipeline. For each spatial increment, the continuum was modeled using a lower order polynomial and subtracted. These spectra were combined to generate a continuum-free 2-D spectrum from both STIS slits The equivalent width of H is always greater than 10 Å in the NLR of NGC 5929, and Å at the location of the interaction. Therefore, corrections to the emission line strengths and profiles due to Balmer absorption are negligible.
| Aperture | Dataset | Exp. (s) | Nuc. Offset (”) |
|---|---|---|---|
| NGC 5929 A | O5G403010 | 1524 | 0.198 |
| NGC 5929 B | O5G403020 | 600 | 0.390 |
2.2. HST and Radio Images
Emission line maps of NGC 5929 in [OIII]+H were prepared from archival HST narrow/medium-band WF/PC-1 images (Program: GO 3724; PI: Wilson). Details of these maps can be found in Bower et al. (1994). In addition, a high S/N F606W WFPC2 archival image of the galaxy was used to trace the stellar and dust geometry in and around the NLR. A reduced and calibrated 5 GHz radio map of NGC 5929 was obtained from the MERLIN archive (http://www.merlin.ac.uk/archive/). This data was first presented in Su et al. (1996).
The various HST datasets were registered to a common astrometric frame using image cross-correlation techniques. The dust lane in NGC 5929 crosses the NLR, effectively obscuring the true position of the nucleus. Lattanzi et al. (1997) use the astrometric information of stars in the WF/PC-1 images of the galaxy to compare the locations of the continuum peak and the unresolved core in a MERLIN radio map. Assuming the radio core corresponds to the true nucleus, they find that the WF/PC-1 continuum peak is offset by NW from the radio core. We have included this small correction in our final registered images (see Panel 4 in Figure 1 for a sense of the amount of correction involved).
3. The NLR of NGC 5929
3.1. Descriptive Framework
NGC 5929 is part of a major galaxy merger with NGC 5930 (Arp 90). Clear signs of tidal tails and disturbed gaseous kinematics are seen in ground-based two-dimensional spectra of the merger system (Lewis & Bowen, 1993), and twisting, filamentary dust structure is visible in the nuclear region (Panel 4 of Fig. 1)
The radio source has been imaged at high resolution with the VLA (Ulvestad & Wilson, 1984; Wilson & Keel, 1989) and MERLIN (Su et al., 1996). It exhibits a triple structure, with two bright compact steep-spectrum hotspots on either side of a faint flat-spectrum core that is unresolved even in the highest resolution maps. Low surface brightness emission joins the hotspots to the radio core along PA , which is also the rough orientation of the elongated emission line distribution.
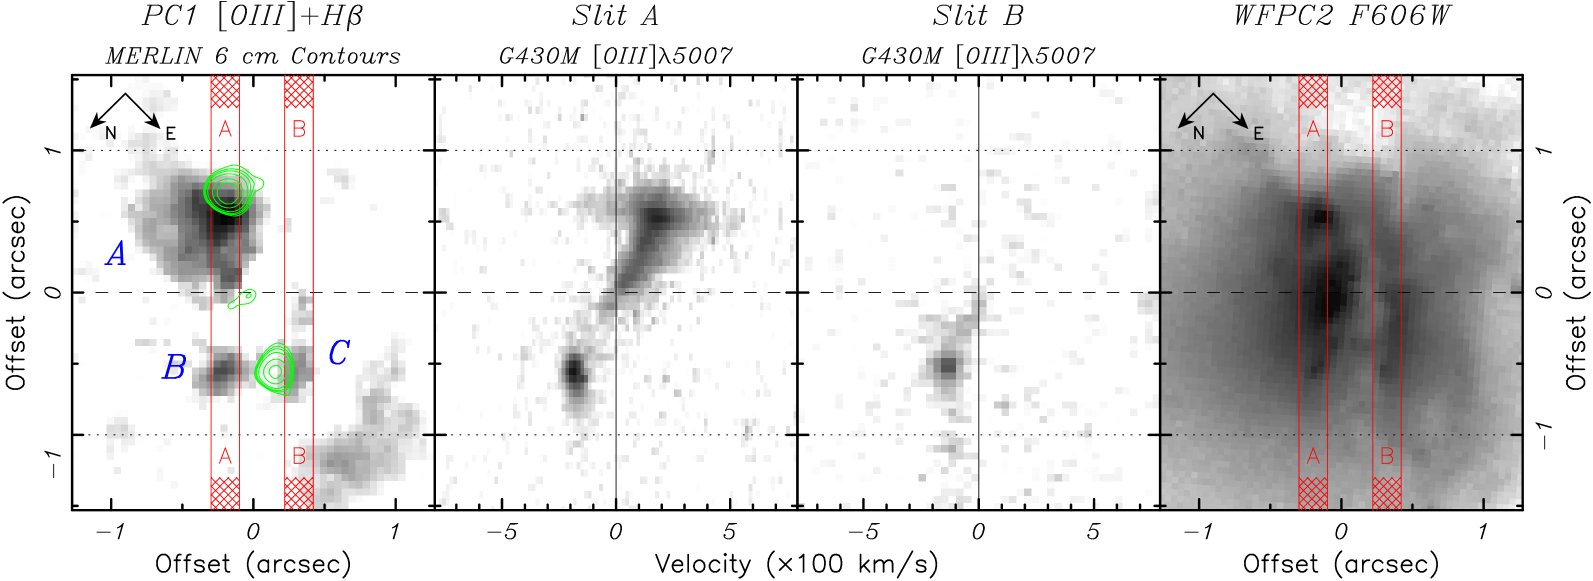
The diverse imaging and spectroscopic datasets are showcased together in Figure 1. In Panel 1, the [O III]H emission line image is displayed in greyscale, with the STIS slit positions and radio map contours overplotted. Three emission line regions, identified by Bower et al. (1994) are labelled A, B and C. The SW radio hotspot coincides with the edge of Region A, while the NW radio hotspot lies near Region B. From the broadband image in Panel 4, the emission line features are revealed as parts of a possibly contiguous region, crossed by a dust lane that obscures the line and continuum emission and modulates the appearance of the NLR. This dust structure is part of a filamentary network extending to several kpc (Malkan et al., 1998).
The [OIII] line from the two medium-resolution STIS spectra are plotted in Panels 2 & 3 of Figure 1. The slits are oriented NE-SW from the bottom to the top of the panel, and a dashed horizontal line marks the reference position on the slit, i.e, the point along the slit closest to the nucleus of the galaxy. Solid vertical lines indicate the systemic velocity.
The [O III] line from both STIS spectra shows clear velocity structure. A detailed treatment of the kinematics of the NLR is not the aim of this Letter and will be addressed in a later paper. A brief description will suffice here. Slit A traverses the brighter emission line regions and therefore gives the best picture of the ionized gas kinematics. The velocity of the line peak increases along this slit from almost systemic at the reference position to a maximum value of km s-1at a nuclear radius of SW (104 pc). This broad gradient is mirrored, though less clearly, to the NE in both Slits A and B. The gradient between the nucleus and Regions B and C are similar in both slits, implying that both Regions are part of the same gaseous complex, bisected in projection by the dust lane. The FWHM of the [O III] line goes through a rapid transition from km s-1 to greater than km s-1 at a nuclear distance of in the brightest portion of Region A. Regions B and C, on the other hand, exhibit uniformly narrow line profiles.
3.2. Ionization Conditions
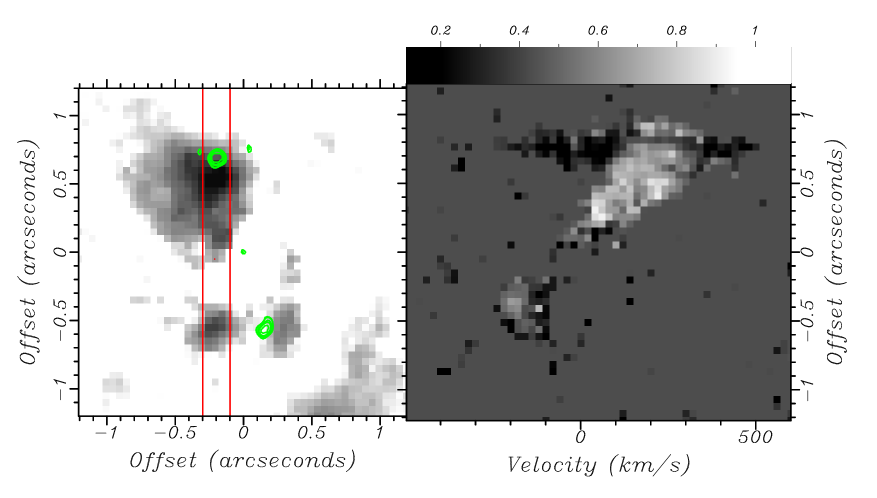
In Figure 2, a map of the [OIII]/H line ratio from the Slit A spectrum is plotted, alongside the WF/PC-1 [O III] image, overlayed with the contours of the 5 GHz radio map and the boundaries of the STIS aperture. The ratio image was created by first rebinning the two-dimension spectrum of each line onto a common velocity range and then dividing them to generate a map of the [O III]/H ratio as a function of velocity and slit position. This ratio of is quite sensitive to ionization state, yet insensitive to dust reddening.
The [O III]/H ratio is in the range of , intermediate between Seyferts and LINERs (Kewley et al., 2006). Variations in ionization are seen across the NLR. The average excitation of Region B is towards the low end of the observed range, with average [O III]/H, while the inner part of Region A is more highly ionized ([O III]/H). However, surrounding the position of the bright knot in Region A, a sharp drop in the ratio is seen. Interestingly, this change in ionization is velocity dependent. In the high velocity wings of the lines, the [O III]/H drops to almost unity implying a very low ionization state, while the central core of the lines remain at a more modest ionization. This trend is different from most Seyferts where the high velocity gas tends to be of equal or higher ionization than low velocity material (e.g., Pelat et al., 1981).
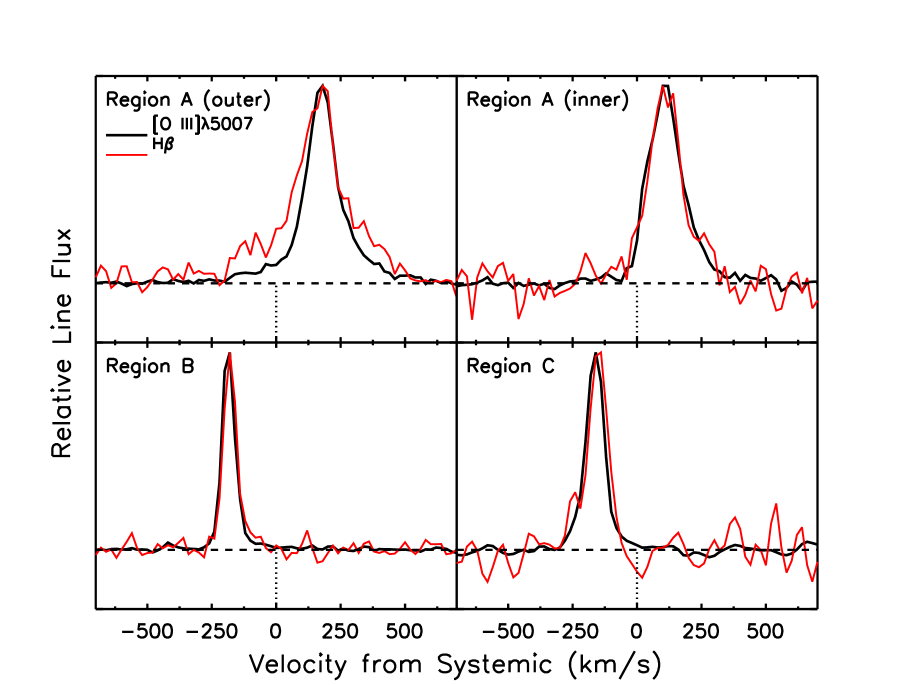
This difference between the average ionization of the NLR and Region A is brought out well by comparing the velocity profiles of [O III] and H in different parts of the NLR, as is done in Figure 3. The width of the H line compared to [O III] is substantially higher in Region A, compared to both the inner part of the same Region and the profiles in Region B and C.
What is the reason for this peculiar ionization behaviour? We believe this results from strong shocks driven by the radio plasma into the ISM. The compressed gas in the post-shock cooling zone is expected to share the high velocities of the shock, yet is predicted to have [O III]/H in the range of , depending on the shock speed and local magnetic field (Dopita & Sutherland, 1996). The enhancement of line emission from shocks and possibly a precursor region, over and above the emission from gas photoionized by the AGN, could then account for the appearance of the bright emission-line knot in Region A associated with the radio hotspot. A moderate contribution to the line emission from shocks is also consistent with the HST spectroscopic study of Ferruit et al. (1999). From the relative strengths of the [SII] and lines, which are produced profusely in the post-shock cooling zone, they estimate high temperatures (greater than K) and somewhat low electron densities (around cm-3) for the [SII]-emitting gas. These values are quite reasonable for normal diffuse ISM that has been compressed by a shock front. Based on a simple double gaussian decomposition of the H line integrated across the knot, we estimate an approximate linewidth of km s-1 for the broad component, which includes the high velocity wings. This nicely matches the predicted shock velocities from Ferruit et al. (1999) which were based on comparisons to shock ionization models of Dopita & Sutherland (1996). While it is difficult to directly associate shock speeds with integrated line kinematics, this broad consistency adds credence to a shock-driven origin for the emission of the knot in Region A.
4. The Nature of the Jet Interaction
Our combination of high spatial resolution optical spectroscopy and imaging provide the best existing view of the compact jet-ISM interaction in NGC 5929. High velocity gas is only seen at the location of the south-western radio hotspot, while in other parts of the NLR, linewidths are narrow and a velocity gradient expected from virial motion is seen, consistent with ground-based slit and IFU spectroscopy (Keel, 1985; Stoklasová et al., 2009).
We adopt a simple model for the jet interaction, following that of Whittle et al. (1986). The radio jet plows through the ISM as it propagates outward, driving strong shocks at its head (the radio hotspot). As this shocked gas cools and gets denser, it becomes the [S II]-emitting gas described by Ferruit et al. (1999) and creates the broad H emission. Allen et al. (2008) model the properties of post-shock gas as a function of shock velocity , pre-shock density and magnetic field strength. Taking a magnetized shock as fiducial, the [S II]-derived densities and km s-1(from the linewidth of the broad H component) imply a pre-shock density of cm-3 and a shock cooling length around tens of parsecs. The pre-shock density estimate has a large uncertainty and could be as low as 1 cm-3 if the shocks are weakly magentized, which would also decrease the cooling length significantly. However, since Seyfert jets are generally associated with mG level magnetic field, we adopt our estimates for magnetic shocks as most likely. The cooling length we derive is resolved in our HST images and may explain the small offset of between the location of the radio hotspot and the peak of the line emission in Region A. This interpretation is very tentative, since patchy dust obscuration is the region may also cause such an offset.
Su et al. (1996) estimate flux densities, radio spectral indices and source sizes for the various components of the radio source, from which we calculate radio source equipartition pressures, using the relations of Miley (1980) and assuming that the radio emitting plasma has a filling factor of unity and an ion fraction , and that the radio spectrum extends from 0.01 GHz to 100 GHz with a constant spectral index of -0.82. The equipartition synchrotron pressure of the radio hotspot is dyne cm-2, which may be compared to the ram pressure of the shock front, dyne cm-2. The two pressures are comparable, consistent with the view that the shocked gas surrounds and confines the radio hotspot. It is worthwhile to note that such pressures are considerably higher than those typically found in Seyfert radio sources, which may indicate that this is a relatively young jet ejection event. Eventually, interactions with the surrounding gas will confine the jet flow into a static lobe, like those found in late-stage interactions (Capetti et al., 1996; Whittle & Wilson, 2004).
5. Discussion: Shock Signatures in Seyferts
Why do we see such obvious signatures of shocks in this object and not in others? This may be due to the weakness of the AGN: NGC 5929 has an absorption-corrected hard X-ray luminosity of erg s-1 – low compared to average local Seyferts (Cardamone et al., 2007). Or perhaps the nuclear environment of the galaxy is dense and gas-rich due to its ongoing merger. This will lower the ionization parameter of nuclear radiation and produce a more compact emission line region. In both scenarios, the influence of the nucleus at larger radii will be relatively unimportant, making shock ionized line emission visible against the general background of centrally ionized gas. If this is indeed the case, it implies that radiative shock ionization from nuclear outflows is widespread in Seyfert NLRs, but is usually secondary to nuclear photoionization processes and only visible in low-luminosity Seyferts or those with dense nuclear environments. A rich nuclear environment raises another possibility that the jet is impacting a dense molecular cloud, enhancing the shock luminosity. This may explain why no clear shock signatures are seen around the NE radio hotspot, though the obscuration of the main dust lane prevents a direct view of this region.
The luminosity of the broad H component is erg s-1. Following Dopita & Sutherland (1996), the H flux scales with the total radiative flux from the shock, with a weak dependence on , giving shock luminosities of erg s-1 – comparable or slightly less than the total luminous output of the AGN (taking a X-ray bolometric correction of ). Using standard relationships from Osterbrock (1989), the H luminosity can be used to derive the mass of ionized gas in the broad component: M⊙. If this mass of gas was accelerated to , it would have a total kinetic energy of ergs. Taking the approximate acceleration timescale to be the crossing time of the region of size 03 (48 pc) at (around yr), a lower limit on the ‘kinetic luminosity’ of the jet is estimated to be erg s-1. This is few to several percent of the total AGN energy output. Given that jet outflows are a relatively common feature of Seyfert activity and couple strongly to the ISM through shocks, jet driven feedback can effectively carry as much as energy as the AGN photon luminosity to kpc scales, and transfer a tenth or less of this energy in the form of kinetic energy to the NLR. This can have important consequences for the suppression of bulge star-formation and the energy budget and dynamics of circum-nuclear gas.
References
- Allen et al. (2008) Allen, M.G, et al. 2008, ApJS, 178, 20
- Baldwin et al. (1987) Baldwin, J.A., Wilson, A.S., & Whittle, M. 1987, ApJ, 319, 84
- Bower et al. (1994) Bower, G.A. et al. 1994, AJ, 107, 1686
- Capetti et al. (1996) Capetti, A., Axon, D.J., Macchetto, F., Sparks, W.B., & Boksenberg, A. 1996, ApJ, 469, 554
- Cardamone et al. (2007) Cardamone, C.N, Moran, E. C, & Kay, L.E 2007, AJ, 134, 1263
- Cecil et al. (2002) Cecil, G., et al. 2002, ApJ, 568, 627
- Cooke et al. (2000) Cooke, A.J., et al. 2000, ApJS, 129, 517
- de Vaucouleurs et al. (1991) de Vaucouleurs, G., de Vaucouleurs, A., Corwin, H.G., Buta, R.J., Paturel, G., and Fouqué, 1991, ”Third Reference Catalogue of Bright Galaxies”, Springer-Verlag
- Dopita & Sutherland (1996) Dopita, M.A, & Sutherland, R.S. 1996, ApJS, 102, 161
- Falcke et al. (1998) Falcke, H., Wilson, A.S., & Simpson, C. 1998, ApJ, 502, 1999
- Ferruit et al. (1997) Ferruit, P., Pécontal, E., Wilson, A.S., & Binette, L. 1997, å, 328, 493
- Ferruit et al. (1999) Ferruit, P., Wilson, A.S., Whittle, M., Simpson, C., Mulchaey, J.S., & Ferland, G.J. 1999, ApJ, 523, 147
- Fragile et al. (2005) Fragile, C.P., Anninos, P., Gustafson, K., & Murray, S.D. 2005, ApJ, 619, 327
- Hao et al. (2005) Hao, L., et al. 2005, AJ, 129, 1795
- Heckman et al. (1981) Heckman, T.M., Miley, G.K., van Breugel, W.J.M., & Butcher, H.R. 1981, ApJ, 247, 403
- Keel (1985) Keel, W.C. 1985, Nature, 318, 43.
- Kewley et al. (2006) Kewley, L.J., Groves, B., Kauffmann, G., & Heckman, T. 2006, MNRAS, 372, 961
- Lattanzi et al. (1997) Lattanzi, M.G., Capetti, A., & Macchetto, F.D. 1997, A&A, 318, 997
- Lewis & Bowen (1993) Lewis, J.R., & Bowen, D.V. 1993, MNRAS, 264, 818
- Malkan et al. (1998) Malkan, M.A., Gorjian, V., & Tam, R. 1998, ApJS, 117, 25
- Miley (1980) Miley, G.H. 1980, ARA&A, 18, 165
- Nagar et al. (1999) Nagar, N., Wilson, A.S., Mulchaey, J.S., & Gallimore, J.F. 1999, ApJS, 120, 209
- Nelson & Whittle (1995) Nelson., C.H., & Whittle, M. 1995, ApJS, 99, 67
- Osterbrock (1989) Osterbrock, D.E. 1989, Astrophysics of Gaseous Nebulae and Active Galactic Nuclei (University Science Books)
- Pelat et al. (1981) Pelat, D., Alloin, D, & Fosbury, R.A.E. 1981, MNRAS, 195, 787,
- Su et al. (1996) Su, B.M., Muxlow, T.W.B., Pedlar, A., Holloway, A.J., Steffen, W., Kukula, M.J., & Mutel, R.L. 1996, MNRAS, 279, 1111
- Stoklasová et al. (2009) Stoklasová, I., Ferruit, P., Emsellem, E., Jungwiert, B., Pécontal, E., & Sánchez, S. 2009, A&A, 500, 1287
- Taylor et al. (1989) Taylor, D., Dyson, J.E., Axon, D.J., & Pedlar, A. 1989, MNRAS, 240, 487
- Ulvestad & Wilson (1984) Ulvestad, J.S., & Wilson, A.S. 1984, ApJ, 285, 439
- Ulvestad & Wilson (1989) Ulvestad, J.S., & Wilson, A.S. 1989, ApJ, 343, 659
- Wakamatsu & Nishida (1988) Wakamatsu, K., & Nishida, M.T. 1988, ApJ, 325, 596
- Whittle et al. (1988) Whittle, M. et al., 1988, ApJ, 326, 125
- Whittle et al. (1986) Whittle. M., Haniff, C.A, Ward, M.J., Meurs, E.J.A, Pedlar, A., Unger, S.W., Axon, D.J., & Harrison, B.A. 1986, MNRAS, 222, 189
- Whittle & Wilson (2004) Whittle, M., & Wilson, A.S. 2004, AJ, 127, 606
- Whittle et al. (2005) Whittle, M., Rosario, D.J., Silverman, J.D., Nelson, C.H., & WIlson, A.S., 2005, AJ, 129, 104
- Wilson & Keel (1989) Wilson, A.S., & Keel, W.C 1989, AJ, 98, 5