11email: takeda.yoichi@nao.ac.jp,kawanomoto.satoshi@nao.ac.jp, ando.hys@nao.ac.jp,sakurai@solar.mtk.nao.ac.jp 22institutetext: Gunma Astronomical Observatory, 6860-86 Nakayama, Takayama-Mura, Agatsuma-gun, Gunma 377-0702, Japan
22email: honda@astron.pref.gunma.jp
Behavior of Li abundances in solar-analog stars II.††thanks: Based on observations carried out at Okayama Astrophysical Observatory (Okayama, Japan).
Abstract
Context. We previously attempted to ascertain why the Li i 6708 line-strengths of Sun-like stars differ so significantly despite the superficial similarities of stellar parameters. We carried out a comprehensive analysis of 118 solar analogs and reported that a close connection exists between the Li abundance () and the line-broadening width (; mainly contributed by rotational effect), which led us to conclude that stellar rotation may be the primary control of the surface Li content.
Aims. To examine our claim in more detail, we study whether the degree of stellar activity exhibits a similar correlation with the Li abundance, which is expected because of the widely believed close connection between rotation and activity.
Methods. We measured the residual flux at the line center of the strong Ca ii 8542 line, , known to be a useful index of stellar activity, for all sample stars using newly acquired spectra in this near-IR region. The projected rotational velocity () was estimated by subtracting the macroturbulence contribution from that we had already established.
Results. A remarkable (positive) correlation was found in the versus (vs.) diagram as well as in both the vs. and vs. diagrams, as had been expected. With the confirmation of rotation-dependent stellar activity, this clearly shows that the surface Li abundances of these solar analogs progressively decrease as the rotation rate decreases.
Conclusions. Given this observational evidence, we conclude that the depletion of surface Li in solar-type stars, probably caused by effective envelope mixing, operates more efficiently as stellar rotation decelerates. It may be promising to attribute the low-Li tendency of planet-host G dwarfs to their different nature in the stellar angular momentum.
Key Words.:
Stars: abundances – Stars: activity – Stars: atmospheres – Stars: solar-type – Stars: rotation1 Introduction
Since Li nuclei are burned and destroyed on their arrival at the hot stellar interior ( K), we can gain valuable information from the surface Li composition of a star about the past history and the physical mechanism of stellar envelope mixing. It has been known, however, that Li abundances () in Sun-like stars exhibits puzzling behaviors:
-
•
A markedly large diversity (by more than dex) of is seen despite the similarity of stellar parameters.
-
•
Planet-host stars tend to show appreciably lower than non-planet-host stars (cf. Israelian et al. 2004, 2009).
As these characteristic trends cannot be explained by the naive classical picture of surface Li being determined by age (which relates to the duration time of gradual Li depletion by way of convective mixing) and (which affects the depth of the convection zone), it has been important to find the hidden parameter(s) responsible for these observed findings.
To elucidate this problem, Takeda et al. (2007, hereinafter referred to as Paper I) conducted an extensive high-precision study of stellar parameters as well as of for 118 solar analogs and found that values, exhibiting a large dispersion themselves, are closely correlated with the line-width, which is characterized by the macroscopic velocity dispersion () including the rotational as well as the macroturbulent broadening effect.
We then speculated that (equatorial rotation velocity) would be the most important factor affecting , since the star-to-star variation in may be responsible for the spread in , any considerable fluctuation in the macroturbulent velocity field among similar solar-type stars being difficult to imagine.
The motivation of the present paper, the second in a series, is to check (or substantiate) the hypothesis that stellar rotation is the decisive factor which determines the surface Li content of solar-analogs. One useful way to accomplish this would be to examine the stellar activity, which is considered to be of dynamo origin and thus deeply related to the intrinsic rotational rate. That is, if we could confirm that is closely correlated with the degree of activity, our speculation would be reasonably justified.
As an indicator of stellar activity, we adopt (8542) (), which is the residual flux (normalized by the continuum) at the line center of Ca ii 8542.09, the strongest line of the near-IR 8498/8542/8662 triplet of mulptiplet 2 for the 2D–2Po transition. This is known to reflect the chromospheric activity of a star; i.e., as the activity is enhanced, the core flux increases because of the greater amount of filled-in emission from the chromosphere (see, e.g., Linsky et al. 1979). This quantity is known to be well correlated with the more traditional Ca ii H+K emission index () and thus serves as a useful tool for diagnosing the activity level of late-type stars (e.g., Foing et al. 1989; Chmielewski 2000; Busà et al. 2007).
In this study we aim to determine (8542) (a measure of stellar activity111Of course, this (8542) index depends not only on the chromospheric activity but also on atmospheric parameters such as (effective temperature), (surface gravity), and [Fe/H] (metallicity) (e.g., Mallik 1997; Chmielewski 2000). However, in the present sample of solar analogs similar to each other, the mutual differences of these stellar parameters are of secondary importance and can be neglected to a first approximation.) for each of the 118 stars studied in Paper I (a bona-fide sample of solar analogs), based on our new spectroscopic data obtained at Okayama Astrophysical Observatory, and examine whether or not they show any correlation with , to test our conclusion in Paper I.
The remainder of this paper is organized as follows. In Sect. 2, we describe the observational material and the measurement of (8542). Before discussing the results of stellar activity, the projected rotational velocity () for each star is derived in Sect. 3 by appropriately subtracting the contribution of macroturbulence from the macrobroadening parameter () discussed in Paper I. The discussion about the resulting relationship between (8542), , and is presented in Sect. 4, where we show that the arguments in Paper I have been confirmed, and our conclusions are summarized in Sect. 5. Two additional appendices are included. Appendix A describes the results of our reanalysis of stellar parameters (including Li abundance) for HIP 41484, since another star (actually HIP 41184) was erroneously observed and analyzed as if it were HIP 41484 in Paper I. Appendix B is devoted to discussing the sensitivity difference between two representative activity indicators, Ca ii triplet in near-IR (multiplet 2) and Ca ii H+K lines in violet region (multiplet 1), based on some test results of non-LTE line profiles simulated with trial models.
2 Residual line-center flux of Ca ii 8542
To acquire data for studying stellar activities from Ca ii near-IR triplet, the observations of 118 solar-analog stars (the same sample as in Paper I) were carried out in five different months (2007 February and April; 2008 May, August, and December) by using the HIgh-Dispersion Echelle Spectrograph (HIDES; Izumiura 1999) at the coudé focus of the 188 cm reflector of Okayama Astrophysical Observatory (OAO). This HIDES, equipped with a 4K2K CCD detector at the camera focus, enabled us to obtain an echellogram covering the wavelength range222Since the beginning of 2008, three mosaicked CCD chips had become newly available in HIDES, resulting in a three-times wider wavelength coverage than before. Accordingly, for the data of 2008 May, August, and December, spectra in two adjacent wavelength ranges (6300–7600 and 8800–10000 ) were also recorded in addition to the target region of 7600–8800 . of 7600–8800 with a resolving power of (for the normal slit width of 200 m) in the mode of red cross-disperser. The observational dates for each of the 118 stars are given in Table 1.
The data reduction (bias subtraction, flat-fielding, aperture-determination, scattered-light subtraction, spectrum extraction, wavelength calibration, continuum normalization) was performed using the “echelle” package of IRAF.333IRAF is distributed by the National Optical Astronomy Observatories, which is operated by the Association of Universities for Research in Astronomy, Inc., under cooperative agreement with the National Science Foundation. Several spectral frames taken on a night were coadded to improve the signal-to-noise ratio, values as high as S/N 100–200 being finally accomplished in most cases.
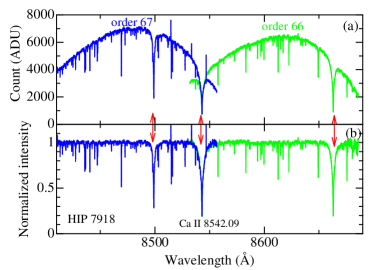
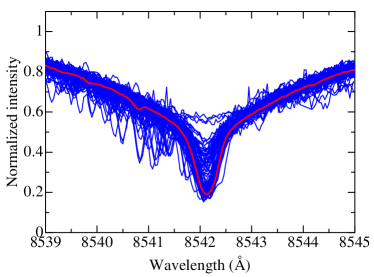
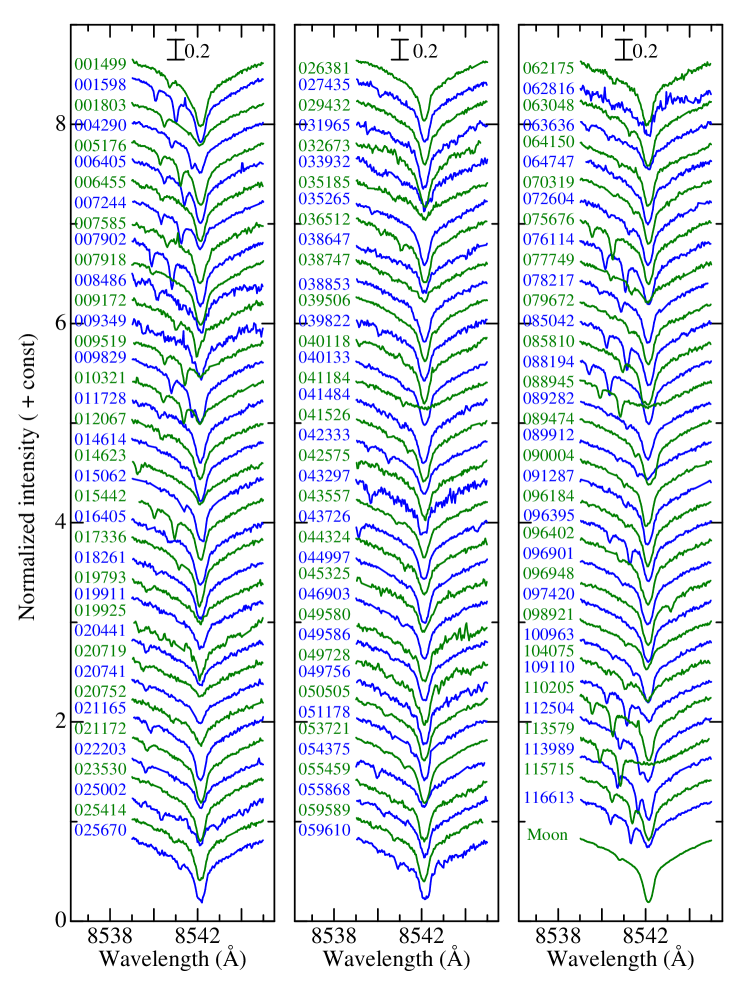
An example spectrum of the Ca ii triplet region is shown in Fig. 1 (for HIP 7918). Unfortunately, the strongest Ca ii line at 8542. 09 , which we use for diagnosing the stellar activity, is situated close to the edge of the spectral order. Although this did not cause any essential disadvantage for the present purposes, we realized that, because of the difficulty in empirically determining the precise continuum level, a careful readjustment of the continuum normalization was necessary, which we carried out using Kurucz et al.’s (1984) solar spectrum atlas as a reference standard. That is, the wing region ( , where is the distance from the line center of 8542.09 ) of each star’s spectrum was adjusted so as to match the corresponding wing of the reference solar spectrum. This procedure worked satisfactorily well for all the program stars, as they are analogous to the Sun. These reduced normalized spectra of the core region are displayed in Fig. 2 for all 118 stars (plus Moon), and the superposition of all the core-region spectra is depicted in Fig. 3. The resulting values of the residual flux at the line center of Ca ii 8542, , are summarized in Table 1.
3 Rotational velocity from line width
To ascertain/determine the effect of rotation on the surface Li content as well as stellar activity, we need to extract , the projected rotational velocity, from values for the -folding width of the Gaussian macrobroadening function [] including both rotation and macroturbulence, which were already derived in Paper I, by appropriately eliminating the effect of macroturbulence. For this purpose, we adopt the simple line-broadening model also invoked by Takeda & Tajitsu (2009; cf. Sect. 3.2 therein), where all broadening components are involved in the form of convolution of Gaussians. According to this model, we may assume the relation (see Eq. (1) and footnote 5 of that paper)
| (1) |
where is the -folding width of the Gaussian macroturbulence function, which is related to the radial-tangential macroturbulence dispersion, , as . Therefore, for a given , the corresponding can be derived if is known. The problem is, however, that an appropriate assignment of is not easy, because it depends on depth (i.e., decreasing with atmospheric height), as is well known for the solar atmosphere (see, e.g., Takeda 1995a). We thus proceeded as follows: We recall that was derived in Paper I by performing spectrum fitting of the 6080–6089 region. The strengths of conspicuous lines (those of Ti, Fe, Ni) in these region are typically on the order of several tens m, whose mean forming depths were estimated to be . With the help of Eq. (1) in Paper I, we may then adopt 1.5 km s-1 as a reasonable value of the Gaussian macroturbulence dispersion in the present case. Accordingly, we may derive for each star as
| (2) |
Thus obtained results are given in Table 1.
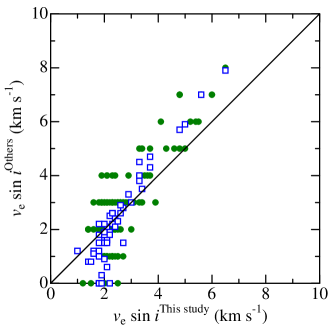
While any high accuracy (e.g., compared to the case of detailed Fourier analysis of line profiles) cannot be expected in these values, given the rough assumptions involved, we consider that they are surely of the correct order-of-magnitude and practically useful. Figure 4 shows the comparison of our results with the data of Nordström et al. (2004) and Valenti & Fisher (2005), from which we can recognize an almost reasonable consistency, even though some slight systematic trend of deviation is seen.
4 Results and discussion
4.1 Rotation–lithium–activity connection
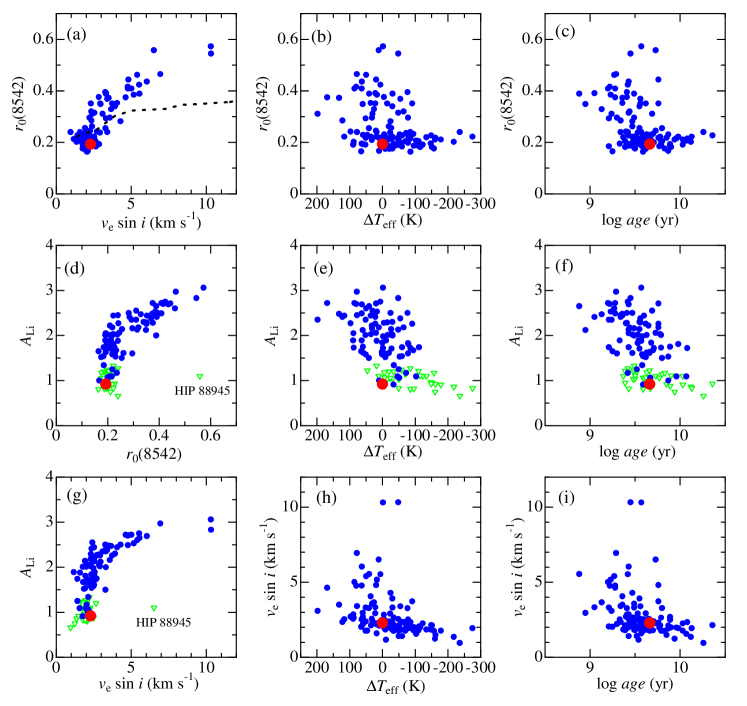
The results of comparisons between , , and are depicted in Figs. 5(a), (d), and (g), respectively.
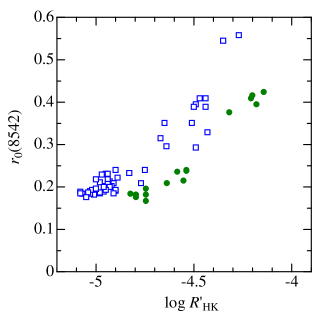
In Fig. 5(a), we can see that is closely correlated with (i.e., chromospheric activity is enhanced with increasing rotational velocity), which matches the reasonable belief that activity is related to rotation-induced stellar dynamo. Figures 5(d) and (g) clearly show evidence of the result we attempt here to prove: the surface Li content () tends to decline with a decrease in stellar activity () as well as in rotational rate ().444 We should remark that the residual intensity at the core gets more or less raised as becomes higher due to the blurring effect (caused by correspondingly wider rotational broadening function being convolved). However, we can see from Fig. 5(a) (see the dotted line therein) that this effect is quantitatively insignificant compared to the main trend (symbols) which must thus be real. Since the comparatively higher rotator ( km s-1) with rather enhanced activity () have Li abundances close to the solar-system value of , from which progressively decreases with decreasing as well as , we can confidently state that Li becomes increasingly depleted as the rotation is reduced in these solar-analog stars.
We should here recall that the rotational velocity (or angular momentum) is closely related to other parameters, such as the effective temperature () or the stellar age (), because the deceleration of the rotation rate must be more effective for lower stars with thicker convection zones, and older stars should have decelerated more than younger ones. As implied by Figs. 5(b), (e), and (h) (-dependence) and Figs. 5(c), (f), and (i) (-dependence), such tendencies are recognized in the sense that rotational velocities tend to be decelerated more (or alternatively, activities as well as Li abundances tend to be lower) for older, cooler stars. However, since these trends are not so tight as those seen in the mutual correlations between , , and (Figs. 5(a), (d), and (g)), we may regard stellar rotation as the most important factor in controlling the surface Li abundance as well as the chromospheric activity among the various influential parameters.
4.2 Angular momentum and envelope mixing
We have thus seen that Li depletion in the surface of Sun-like stars progressively increases as stellar rotation becomes slower, as illustrated by the close correlation between and in addition to the -dependence of . That planet-host solar-analog stars tend to be Li-poor compared to their non-planet-host counterparts, as first discovered by Israelian et al. (2004), may possibly be understood by, or at least partly related to, the difference in rotational properties between the two groups. This argument is supported by the finding of Gonzalez (2008), who reported (based on the literature data) that planet-harboring stars showing Li abundance anomalies (low Li) also exhibit anomalies in terms of both and (i.e., slow rotation and low activity).
In contrast, Israelian et al. (2009) could not find any meaningful Li vs. activity correlation or any tendency toward markedly small for planet-harboring stars, while they confirmed the low-Li tendency of planet-host stars in a more convincing manner. We note, however, that their discussion is based on the data of stars with comparatively low- ( km s-1) as well as low-activity ( which corresponds to according to Fig. 7) since their sample of planet-host stars are distributed across a limited parameter range (cf. their Fig. 2a and b). It is difficult to discuss any existence of parameter correlations in this low-rotation/activity region because of the progressive increase in the relative importance of errors. The relations that we have found between , , and (8542) (being manifest when viewed over a rather wide range of these parameters; cf. Fig. 5(a), (d), (g)) would become appreciably unclear when we confine ourselves to this restricted region. Therefore, we can neither exclude nor accept their result based on their data alone (especially since they used imhomogeneous literature data of and collected from several references). To settle this issue, far more precise evaluation of the stellar rotation rate as well as the stellar activity would be needed (e.g., direct determination of the rotation period by detecting the modulation of activity indicator based on long-term observations).
After recognizing that a lithium deficiency is more likely to take place in slower-rotation stars or planet-host stars, the next task is to find a reasonable explanation. Several possibilities for a rotation–mixing connection have been proposed, such as a turbulent diffusion mixing caused by magnetic rotational braking and an envelope mixing triggered by tidal forces from planets (see Gonzalez (2008) or Israelian et al. (2009) and the quoted references therein). Based on detailed theoretical simulations, Bouvier (2008) showed that slow rotators develop a high degree of differential rotation between the radiative core and the convective envelope, eventually promoting lithium depletion by enhanced mixing, while fast rotators experience little similar core–envelope decoupling. The Li-deficient tendency in planet-host stars may thus be caused by their slow rotation resulting from a long lasting star–disk interaction during the pre-main sequence phase. This line of theoretical approach should be pursued further. In any case, we should bear in mind that the observed evidence of – relation does not necessarily imply a direct physical connection, but may be the result of a long complex evolution involving different phases (such as the pre-main sequence).
4.3 Sensitivity of Ca ii 8542 as an activity index
We point out problems that remain to be clarified. We are confident about the global rotation–activity–lithium relation in the regions of 3 km s km s-1, , and , as shown in Figs. 5(a), (d), and (g). However, little can be said about the comparatively low-rotation/activity/Li regions of km s-1, , and , where tends to converge for the value of , and as well as are indefinite because they are close to the detection limit. This situation is apparent in the histograms of , , and shown in Figs. 6(a)–(c). How could this large dispersion in (of more than dex) be explained at , despite being stabilized at (cf. Fig. 2(d))?
In our opinion, this implies that the core flux of Ca ii 8542 line is no longer a useful indicator; i.e., this line is too insensitive to any change in activity at this low-activity level. We confirmed by means of our non-LTE line-formation calculation (cf. Appendix B) that the core-flux of Ca ii 8542 is not so sensitive to a mild chromospheric temperature rise (unless the temperature becomes sufficiently high to reach a certain threshold level; cf. Fig. B.1(c)), which makes itself rather unsuitable to studying the stellar activity at a lower level. This must be the reason for the convergence of at .
In contrast, our non-LTE calculation suggested that the core emission of Ca ii K line at 3934 is sensitive to the chromospheric temperature enhancement of any degree (cf. Fig. B.1(b)), from which we may conclude that Ca ii H+K violet lines are more useful and practical (than Ca ii near-IR triplet lines) at least for investigating the mild stellar activity of comparatively slow rotators. We can see from Fig. 7 that, while a reasonable correlation exists between and index (measure of the core emission strength of Ca ii H+K lines), still exhibits an appreciable dispersion around , whereas stabilizes at . This means that we still may have a chance to study the rotation–activity–lithium connection of comparatively slow rotators ( km s-1, where Ca ii IR triplet is no more effective) by studying the Ca ii H+K lines. Additional investigation along these lines would be worthwhile as we proceed to the next step .

5 Conclusion
In our previous study of Paper I, we carried out a comprehensive spectroscopic analysis of 118 solar analogs to clarify why the strengths of Li i 6708 line in these Sun-like stars are considerably diversified despite that they have stellar parameters quite similar to each other, and interestingly found a close relationship between the Li abundance and its line-width. We then proposed that stellar rotation may be the most important parameter in determining the surface Li content.
In this paper, we have tried to test this hypothesis by examining whether any correlation exists between the stellar activity and the Li abundance, as expected because of the widely believed rotation–activity connection. As an indicator of stellar activity, we used the residual line-center flux of the strong Ca ii 8542 line (), which was measured from the high-dispersion near-IR spectra obtained with the 188 cm reflector and the HIDES spectrograph at Okayama Astrophysical Observatory. The projected rotational velocity () was reasonably accurately estimated by subtracting the contribution of the macroturbulence effect from the line-broadening width () as we already established in Paper I.
Clear correlations have been confirmed in the diagrams vs. , vs. , and vs. ), which support the arguments that (1) the stellar activity surely depends upon the rotational rate, and that (2) the atmospheric Li abundance of solar-analog stars declines progressively as the rotational velocity decreases.
We thus concluded that a Li-depletion mechanism in these Sun-like stars, most probably caused by effective envelope mixing, operates more efficiently as the stellar rotation slows down. In this context, it may be interesting/enlightening to interpret the observational finding of a low-Li tendency of planet-host G dwarfs within the framework of the rotational properties (i.e., difference in the angular momentum), as stated in the theoretical prediction by Bouvier (2008). Additional detailed investigations along those lines would be worthwhile.
However, the cause of this interconnection, which is found for comparatively high-rotation/activity/Li stars, remains unclear for the group of stars with low-rotation/activity/Li, where tends to converge and stabilize at and can no longer be a useful activity indicator. Since we found from our non-LTE calculation that Ca ii H+K violet lines at 3968/3934 are more sensitive and useful (than Ca ii IR triplet lines) for investigating the mild stellar activity of comparatively slow rotators, it would be beneficial to revisit this problem by studying these Ca ii H+K lines in greater detail.
Acknowledgements.
We thank the staff of the Okayama Astrophysical Observatory for their kind and elaborate support in the observations. Constructive comments from an anonymous referee concerning the interpretation of low-Li tendency in planet-host stars are also acknowledged.References
- (1) Andretta, V., Busà, I., Gomez, M. T., & Terranegra, L. 2005, A&A, 430, 669
- (2) Bouvier, J. 2008, A&A, 489, L53
- (3) Burgess, A., Chidichimo, M. C., Tully, J. A. 1995, A&A, 300, 627
- (4) Busà, I., Aznar Cuadrado, R., Terranegra, L., Andretta, V., & Gomez, M. T. 2007, A&A, 466, 1089
- (5) Chmielewski, Y. 2000, A&A, 353, 666
- (6) Cunto, W., & Mendoza, C. 1992, Rev. Mex. Astron. Astrofis., 23, 107
- (7) Drake, J. J. 1991, MNRAS, 251, 369
- (8) Foing, B. H., Crivellari, L., Vladilo, G., Rebolo, R., & Beckman, J. E. 1989, A&AS, 80, 189
- (9) Gonzalez, G. 2008, MNRAS, 386, 928
- (10) Israelian, G., Santos, N. C., Mayor, M., & Rebolo, R. 2004, A&A, 414, 601
- (11) Israelian, G., Delgado Mena, E., Santos, N. C., et al. 2009, Nature, 462, 189
- (12) Izumiura, H. 1999, in Proc. 4th East Asian Meeting on Astronomy, Observational Astrophysics in Asia and its Future ed. P. S. Chen (Kunming: Yunnan Observatory), 77
- (13) Jørgensen, U. G., Carlsson, M., & Johnson, H. R. 1992, A&A, 254, 258
- (14) Kurucz, R. L. 1979, ApJS, 40, 1
- (15) Kurucz, R. L., Furenlid, I., Brault, J., & Testerman, L. 1984, Solar Flux Atlas from 296 to 1300 nm (Sunspot, New Mexico: National Solar Observatory) [digital version available at http://kurucz.harvard.edu/sun.html]
- (16) Kurucz, R. L., & Bell, B. 1995, Kurucz CD-ROM, No. 23 (Harvard-Smithsonian Center for Astrophysics) [also available at http://kurucz.harvard.edu/LINELISTS.html]
- (17) Linsky, J. L., & Avrett, E. H. 1970, PASP, 82, 169
- (18) Linsky, J. L., Hunten, D. M., Sowell, R., Glackin, D. L., & Kelch, W. L. 1979, ApJS, 41, 481
- (19) Mallik, S. V. 1997, A&AS, 124, 359
- (20) Maltby, P., Avrett, E. H., Carlsson, M., et al. 1986, ApJ, 306, 284
- (21) Mashonkina, L., Korn, A. J., & Przybilla, N. 2007, A&A, 461, 261
- (22) Nordstöm, B., Mayor, M., Andersen, J., et al. 2004, A&A, 418, 989
- (23) Strassmeier, K., Washuettl, A., Granzer, Th., Scheck, M., & Weber, M. 2000, A&AS, 142, 275
- (24) Takeda, Y. 1991, A&A, 242, 455
- (25) Takeda, Y. 1995a, PASJ, 47, 337
- (26) Takeda, Y. 1995b, PASJ, 47, 463
- (27) Takeda, Y., Kawanomoto, S., Honda, S., Ando, H., & Sakurai, T. 2007, A&A, 468, 663 (Paper I)
- (28) Takeda, Y., & Tajitsu, A. 2009, PASJ, 61, 471
- (29) Valenti, J. A., Fisher, D. A. 2005, ApJS, 159, 141
- (30) Watanabe, T., & Steenbock, W. 1985, A&A, 149, 21
- (31) Wright, J. T., Marcy, G. W., Butler, R. P., & Vogt, S. S. 2004, ApJS, 152, 261
Appendix A Reanalysis of HIP 41484
In the course of this study, we noticed that the near-IR spectrum of HIP 41484 obtained for this study and the red-region spectrum used in Paper I were apparently inconsistent with each other. After careful inspection of the observational information (e.g., telescope pointing log), we then realized that the red spectrum obtained for this star in 2005 November 26 was not that of HIP 41484 but that of HIP 41184 (which was also one of our solar-analog targets); i.e., we had mistakenly observed the incorrect star because of the similarity in their HIP number.555As a result, HIP 41184 was unintentionally observed twice. In Fig. 6 and 8 in Paper I, the two spectra labeled as “41184” and “41484” actually correspond to the same star (HIP 41184).
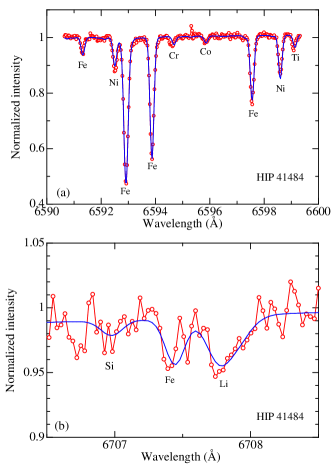
Since an erroneous spectrum was eventually used in Paper I, all the spectrum-related quantities derived therein were also wrong. We thus carried out an entire reanalysis of HIP 41484 based on the new spectrum used for this study, where a long wavelength range of 6300–10000 was fortunately available (thanks to the 3 mosaicked CCDs; cf. footnote 2) in addition to the main region of 7600–8800 including the Ca ii triplet. The atmospheric parameters (, , , and [Fe/H]) were derived from the Fe i and Fe ii lines 6300–7600 region. Since the 6080–6089 region used in Paper I to evaluate the line-broadening width by the spectrum-fitting method was not available in the present case, we instead used the 6591–6599 region for this purpose (Fig. A.1(a)). The Li abundance was determined from the Li i doublet at 6708 (Fig. A.1(b)). Otherwise, all the relevant stellar parameters were established in the same way as in Paper I. The results of this reanalysis are summarized in Table A.1.
| Sp | G5V | Spectral type |
| (K) | 5864 | Effective temperature |
| (cm s-2) | 4.33 | Surface gravity |
| (km s-1) | 0.92 | Microturbulence |
| {Fe/H} | +0.05 | Metallicity () |
| 6.32 | Apparent visual magnitude | |
| (mas) | 45.89 (0.84) | Hipparcos parallax |
| 4.63 | Absolute visual magnitude | |
| B.C. | Bolometric correction | |
| 4.51 | Absolute bolometric magnitude | |
| 0.096 | Bolometric luminosity | |
| Mass (from tracks) | ||
| (yr) | Age (from tracks) | |
| Mass (from isochrones) | ||
| (yr) | Age (from isochrones) | |
| (K) | +87.6 | StarSun |
| (cm s-2) | StarSun | |
| (km s-1) | StarSun | |
| {Fe/H} | +0.060 | StarSun metallicity ([Fe/H]) |
| (km s-1) | Heliocentric radial velocity | |
| (kpc) | 7.337 | Mean galactocentric distance |
| 0.136 | Orbital eccentricity | |
| (kpc) | 0.172 | Max. separation from galactic plane |
| (km s-1) | +30.5 | Space velocity (radial) |
| (km s-1) | Space velocity (tangential) | |
| (km s-1) | Space velocity (vertical) | |
| (6708) (m) | 11.0 | Equivalent width of Li i 6708 |
| (NLTE) | 1.73 | Non-LTE Li abundance |
| +0.06 | Non-LTE correction | |
| (km s-1) | 2.90 | Macrobroadening velocity |
| (km s-1) | 2.64 | Projected rotational velocity |
These are the revised parameters of HIP 41484 established based on the new spectrum data for this star, since the values of spectroscopically determined quantities (e.g., atmospheric as well as line-broadening parameters, radial velocity, and Li abundance) for this star reported in Paper I turned out to be erroneous because a wrong spectrum (actually that of HIP 41184) was used. See Paper I for more details of the meanings of these quantities and the procedures for their determinations.
Appendix B Ca ii H+K doublet and near-IR triplet as stellar-activity indicators
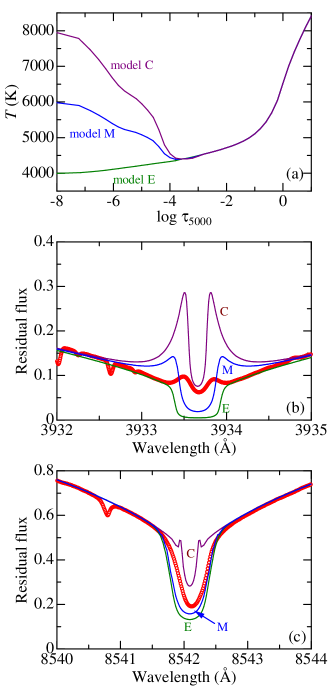
It is well known that the cores of strong Ca ii lines, such as the resonance H+K doublet lines (at 3968 and 3934 ) or the near-IR triplet lines (at 8498/8542/8662 ), reflect the temperature structure of the upper atmosphere and may be used as useful indicators of chromospheric activity. However, does any difference exists between these two activity indicators in their practical applications; do they have any specific strong or weak points depending on situations? To answer this, we tried to compute the profiles of Ca ii 3934 and Ca ii 8542 lines for several test model atmospheres with different chromospheric effects, and examine how the core fluxes of these two lines respond to the temperature profile of upper atmospheres.
We must take into account non-LTE effects, because the dilution of the line source function in the upper optically-thin layer determines the intensity/flux level at the core. Non-LTE statistical-equilibrium calculations directed specifically toward studying the formation of these strong Ca ii lines in the chromosphere have been few in number.666 More precisely, several other non-LTE studies of calcium lines in late-type stars (e.g., Watanabe & Steenbock 1985; Drake 1991; Jørgensen et al. 1992; Mashonkina et al. 2007), focusing mainly on non-LTE abundance corrections, do not explicitly address the chromospheric effect (core emission) on the formation of these activity-sensitive Ca ii lines under question. Except for the pioneering work on a simple 3-level Ca ii model ion (e.g., Linsky & Avrett 1970 for the H+K lines; Linsky et al. 1979 for the 8542 line), the only relevant non-LTE study quotable here may be, to our knowledge, that of Andretta et al. (2005), who computed (based on a model atom comprising 18 Ca i and 5 Ca ii levels) the 8498/8542/8662 line profiles for various solar models including a semi-empirical one with the chromosphere.
We dealt with this problem here using a more detailed atomic model of calcium (111/50 terms and 2376/313 radiative transitions for Ca i/Ca ii), comprising up to Ca i 4 16 3D (48830 cm-1 from the ground level) and Ca ii 3 16 2D (93895 cm-1 from the ground level), which was constructed from the atomic-line database compiled by Kurucz & Bell (1995). The electron collision cross-sections relevant to the lowest 7 terms of Ca ii were taken from Burgess et al. (1995). The data from TOPbase (Cunto & Mendoza 1992) were adopted for the photoionization cross-sections for the lowest 7 and 10 terms of Ca i and Ca ii, respectively. As for other computational details (e.g., electron-collision rates as well as photoionization rates for the remaining terms not mentioned above, collisional ionization rates, treatment of collisions with neutral-hydrogen atoms), we followed the recipe described in Sect. 3.1.3 of Takeda (1991).
We tested three solar atmospheric models ( K, , [Fe/H] = 0.0) that have different temperature profiles only at the upper layer of . Model C has a chromospheric temperature structure similar to that of the semi-empirical solar model of Maltby et al. (1986). Model E is equivalent to Kurucz’s (1979) ATLAS6 solar model (without any temperature rise), and Model M corresponds to the mean of these two (cf. Fig. B.1(a)). The pressure/density structures of these models were obtained by integrating the equation of hydrostatic equilibrium. We refer to Sect. 2.1 of Takeda (1995b) for more details about how Models C and E were constructed. We applied a depth-dependent microturbulence by adopting the turbulent velocity fields given in Table 11 of Maltby et al. (1986).
The resulting profiles of Ca ii 3934 and 8542 lines are depicted in Figs. B.1(b) and (c), respectively, where the corresponding solar flux spectra of Kurucz et al. (1984) are also shown for comparison. It can be seen that the computed profiles for Model C, which is likely to be the most realistic among the three, do not reproduce the true solar spectra well (i.e., the core flux level is too high), indicating that our modeling is still imperfect. However, our intention here is not to accomplish excellent fitting between theory and observation, but to ascertain/determine whether and how the sensitivity to the upper temperature differs between these two lines. From this standpoint, we can recognize an important result in these figures: The strength of the core emission in the Ca ii 3934 line progressively increases in accordance with the temperature rise in the upper layer as Model EModel MModel C (Fig. B.1(b)). In contrast, the residual core flux of Ca i 8542 line barely differs for Models E and M, while that for Model C is appreciably higher (Fig. B.1(c)), which means that this indicator is not very useful for studying the moderate temperature enhancement (mild chromospheric activity) because of its rather inefficient response until the temperature rise goes over a certain threshold level. Consequently, we may conclude that those who intend to study the nature of comparatively mild stellar activity in slower rotators should use the Ca ii H+K lines at 3934/3968 , rather than the Ca ii triplet lines at 8498/8542/8662 .
| HIP | (8542) | {Fe/H} | Date | Remark | ||||||
|---|---|---|---|---|---|---|---|---|---|---|
| 001499 | 0.190 | 2.01 | (1.1) | 9.59 | 46.7 | 0.08 | 0.04 | +0.198 | 2008-08-11 | |
| 001598 | 0.222 | 1.94 | 1.81 | 9.98 | 79.2 | 0.14 | 0.05 | 0.274 | 2008-08-11 | |
| 001803 | 0.389 | 5.55 | 2.65 | 8.88 | +40.6 | 0.08 | +0.19 | +0.230 | 2008-08-11 | |
| 004290 | 0.320 | 2.34 | 2.18 | 9.44 | 64.7 | 0.08 | +0.12 | 0.129 | 2008-08-12 | |
| 005176 | 0.195 | 2.52 | 1.89 | 9.33 | +63.4 | 0.12 | +0.06 | +0.166 | 2008-08-15 | |
| 006405 | 0.213 | 2.07 | 1.71 | 9.55 | 27.9 | 0.07 | 0.01 | 0.133 | 2008-08-12 | |
| 006455 | 0.227 | 1.41 | 1.74 | 9.43 | 60.1 | +0.05 | +0.00 | 0.089 | 2008-12-02 | |
| 007244 | 0.351 | 2.31 | 2.29 | 9.56 | 14.3 | +0.07 | +0.11 | 0.036 | 2008-08-14 | |
| 007585 | 0.209 | 2.34 | 1.84 | 9.68 | +0.2 | 0.01 | +0.04 | +0.067 | 2007-02-05 | |
| 007902 | 0.182 | 2.13 | (0.9) | 9.39 | 151.0 | 0.07 | 0.10 | +0.004 | 2008-08-13 | |
| 007918 | 0.191 | 2.57 | 1.89 | 9.56 | +89.5 | 0.12 | +0.12 | +0.025 | 2007-02-05 | |
| 008486 | 0.311 | 2.41 | 2.55 | 9.69 | +30.2 | +0.00 | +0.09 | 0.055 | 2007-02-06 | |
| 009172 | 0.282 | 4.29 | 2.50 | 9.47 | 24.8 | +0.06 | +0.16 | +0.040 | 2008-08-13 | |
| 009349 | 0.245 | 2.26 | 2.06 | 9.73 | +19.7 | 0.06 | +0.03 | +0.012 | 2007-02-07 | |
| 009519 | 0.465 | 6.94 | 2.97 | 9.29 | +78.0 | 0.03 | +0.20 | +0.139 | 2008-08-15 | |
| 009829 | 0.211 | 1.77 | (0.9) | 10.03 | 178.6 | 0.16 | 0.06 | 0.295 | 2008-08-13 | |
| 010321 | 0.395 | 3.27 | 2.50 | 9.41 | 76.6 | +0.09 | +0.09 | 0.026 | 2008-08-15 | |
| 011728 | 0.205 | 2.11 | (1.0) | 9.48 | 50.7 | 0.05 | +0.01 | +0.033 | 2008-12-03 | |
| 012067 | 0.240 | 1.97 | (1.3) | 9.42 | 85.3 | 0.06 | 0.09 | +0.197 | 2008-12-02 | |
| 014614 | 0.220 | 2.49 | 1.58 | 9.58 | +1.2 | 0.09 | +0.03 | 0.102 | 2008-12-01 | |
| 014623 | 0.389 | 3.31 | 2.00 | 9.49 | 30.8 | +0.01 | +0.09 | +0.116 | 2008-12-02 | |
| 015062 | 0.222 | 2.32 | 2.02 | 9.47 | 30.6 | +0.03 | 0.08 | 0.276 | 2008-08-14 | |
| 015442 | 0.233 | 1.80 | 1.67 | 9.70 | 94.5 | +0.03 | 0.10 | 0.200 | 2008-08-14 | |
| 016405 | 0.184 | 2.65 | (1.2) | 9.48 | 34.4 | 0.15 | +0.02 | +0.264 | 2008-12-02 | |
| 017336 | 0.164 | 2.07 | (0.8) | 9.59 | 85.5 | +0.09 | 0.06 | 0.119 | 2008-08-14 | |
| 018261 | 0.242 | 2.71 | 2.27 | 9.40 | +97.4 | 0.04 | +0.01 | +0.013 | 2008-12-02 | |
| 019793 | 0.385 | 5.17 | 2.53 | 9.23 | +16.7 | 0.03 | +0.25 | +0.165 | 2008-12-02 | |
| 019911 | 0.351 | 3.73 | 2.26 | 9.76 | 91.1 | 0.12 | +0.14 | 0.133 | 2008-12-03 | |
| 019925 | 0.262 | 2.39 | 1.61 | 9.47 | 19.5 | +0.04 | 0.01 | +0.064 | 2007-02-07 | |
| 020441 | 0.376 | 2.84 | 2.28 | 9.41 | 4.5 | 0.02 | +0.03 | +0.136 | 2008-12-03 | |
| 020719 | 0.462 | 5.40 | 2.60 | 9.27 | +49.8 | 0.13 | +0.23 | +0.128 | 2008-12-03 | |
| 020741 | 0.391 | 3.33 | 2.41 | 9.05 | +21.7 | 0.11 | +0.18 | +0.164 | 2008-12-03 | |
| 020752 | 0.375 | 4.63 | 2.72 | 9.28 | +168.9 | 0.01 | +0.16 | +0.163 | 2008-12-02 | |
| 021165 | 0.220 | 2.53 | 1.61 | 9.66 | 4.5 | 0.20 | +0.03 | 0.164 | 2008-12-03 | |
| 021172 | 0.196 | 1.85 | (1.0) | 9.63 | 147.4 | 0.15 | 0.08 | 0.110 | 2008-12-02 | |
| 022203 | 0.340 | 3.92 | 2.30 | 9.55 | 30.4 | 0.17 | +0.12 | +0.123 | 2008-12-03 | |
| 023530 | 0.211 | 1.24 | (0.8) | 9.94 | 160.7 | 0.08 | 0.06 | 0.238 | 2008-12-01 | |
| 025002 | 0.369 | 3.40 | 2.38 | 9.56 | 54.6 | 0.03 | +0.09 | 0.096 | 2007-02-07 | |
| 025414 | 0.220 | 1.85 | (1.1) | 9.37 | 134.4 | +0.05 | 0.11 | +0.095 | 2008-12-01 | |
| 025670 | 0.218 | 2.05 | (1.2) | 9.52 | 20.1 | +0.06 | 0.10 | +0.090 | 2008-12-02 | |
| 026381 | 0.240 | 0.96 | (0.7) | 10.26 | 236.2 | +0.03 | 0.08 | 0.442 | 2008-12-01 | planet-host star |
| 027435 | 0.231 | 1.92 | 1.53 | 9.87 | 52.6 | +0.02 | 0.06 | 0.204 | 2008-12-03 | |
| 029432 | 0.200 | 2.14 | 1.06 | 9.67 | 51.4 | 0.06 | +0.00 | 0.111 | 2008-12-03 | |
| 031965 | 0.167 | 2.11 | 1.00 | 9.87 | +10.2 | 0.11 | +0.01 | +0.051 | 2007-02-05 | |
| 032673 | 0.176 | 1.83 | (1.0) | 9.50 | 30.9 | +0.14 | 0.07 | +0.075 | 2007-02-05 | |
| 033932 | 0.373 | 3.50 | 2.48 | 9.36 | +132.4 | 0.07 | +0.11 | 0.112 | 2008-12-05 | |
| 035185 | 0.444 | 4.81 | 2.71 | 9.76 | +19.5 | 0.23 | +0.27 | 0.003 | 2008-12-01 | |
| 035265 | 0.191 | 1.77 | 2.01 | 9.79 | +51.8 | 0.05 | +0.06 | 0.009 | 2007-02-05 | |
| 036512 | 0.218 | 1.42 | 1.25 | 9.52 | 49.8 | +0.03 | 0.12 | 0.085 | 2008-12-03 | |
| 038647 | 0.315 | 2.55 | 2.13 | 9.43 | 48.3 | 0.03 | 0.03 | +0.012 | 2007-02-05 | |
| 038747 | 0.424 | 5.53 | 2.75 | 9.42 | +6.3 | 0.07 | +0.11 | +0.025 | 2008-12-02 | |
| 038853 | 0.222 | 2.53 | 2.44 | 9.60 | +116.6 | 0.22 | +0.06 | 0.064 | 2008-12-02 | |
| 039506 | 0.227 | 2.14 | (0.9) | 10.36 | 148.9 | 0.14 | 0.16 | 0.610 | 2008-12-01 | |
| 039822 | 0.231 | 1.97 | (1.2) | 9.63 | 5.6 | 0.11 | 0.08 | 0.215 | 2008-12-03 | |
| 040118 | 0.202 | 1.36 | (0.9) | 10.12 | 218.0 | 0.01 | 0.13 | 0.420 | 2007-04-19 | |
| 040133 | 0.184 | 2.36 | 1.54 | 9.59 | 59.6 | 0.11 | 0.03 | +0.127 | 2008-12-01 | |
| 041184 | 0.545 | 10.32 | 2.83 | 9.45 | 48.4 | +0.00 | +0.54 | +0.105 | 2008-12-01 | |
| 041484 | 0.202 | 2.64 | 1.73 | 9.79 | +87.6 | 0.04 | 0.10 | +0.060 | 2008-05-21 | cf. Appendix A |
| 041526 | 0.222 | 2.13 | 2.03 | 9.78 | +34.9 | 0.16 | 0.01 | 0.018 | 2008-12-03 | |
| 042333 | 0.293 | 3.31 | 2.35 | 9.21 | +51.2 | +0.04 | +0.05 | +0.153 | 2008-12-03 | |
| 042575 | 0.236 | 2.03 | 1.17 | 9.42 | 72.6 | 0.02 | 0.04 | +0.073 | 2008-12-05 | |
| 043297 | 0.296 | 2.22 | 1.60 | 9.30 | 78.3 | +0.01 | +0.05 | +0.081 | 2008-05-27 | |
| 043557 | 0.255 | 3.28 | 1.50 | 9.80 | +41.2 | 0.03 | +0.05 | 0.061 | 2007-02-05 | |
| 043726 | 0.240 | 1.59 | 1.88 | 9.57 | +17.5 | +0.04 | +0.01 | +0.125 | 2008-05-26 | |
| 044324 | 0.285 | 2.35 | 2.41 | 9.34 | +122.2 | +0.04 | +0.09 | 0.008 | 2008-12-03 | |
| 044997 | 0.198 | 1.84 | (1.2) | 9.49 | 57.8 | +0.14 | 0.28 | +0.055 | 2008-12-02 | |
| 045325 | 0.311 | 3.09 | 2.35 | 9.24 | +197.8 | +0.07 | +0.03 | +0.184 | 2008-12-05 | |
| 046903 | 0.238 | 2.91 | 2.02 | 9.53 | 23.8 | 0.04 | +0.12 | 0.031 | 2008-12-02 | |
| 049580 | 0.215 | 2.48 | 1.98 | 9.58 | 2.0 | 0.08 | 0.12 | +0.003 | 2007-02-07 | |
| 049586 | 0.222 | 2.21 | (1.3) | 9.49 | +18.1 | 0.09 | +0.04 | +0.204 | 2008-12-02 | |
| 049728 | 0.175 | 2.01 | (1.0) | 9.60 | 21.1 | 0.04 | 0.02 | 0.064 | 2007-02-06 | |
| 049756 | 0.185 | 2.14 | 1.34 | 9.58 | 35.1 | 0.14 | +0.01 | +0.027 | 2007-02-06 | |
| 050505 | 0.218 | 1.49 | (0.9) | 9.85 | 162.1 | 0.01 | 0.11 | 0.165 | 2007-04-19 | |
| 051178 | 0.229 | 1.77 | (1.2) | 9.66 | +46.2 | +0.04 | 0.07 | 0.174 | 2008-12-02 | |
| 053721 | 0.193 | 2.69 | 1.75 | 9.89 | +59.5 | 0.25 | +0.14 | 0.010 | 2008-12-02 | planet-host star |
| 054375 | 0.353 | 4.06 | 2.44 | 9.36 | +35.9 | 0.12 | 0.08 | +0.147 | 2008-05-26 | |
| 055459 | 0.218 | 2.39 | 1.58 | 9.58 | +51.1 | 0.04 | +0.03 | +0.072 | 2007-02-05 | |
| 055868 | 0.256 | 1.92 | 2.14 | 9.55 | 26.9 | 0.02 | 0.01 | 0.166 | 2007-04-19 | |
| 059589 | 0.205 | 1.81 | (1.2) | 9.39 | 110.2 | +0.05 | 0.24 | 0.020 | 2008-05-21 | |
| 059610 | 0.229 | 2.22 | 1.62 | 9.63 | +59.1 | 0.13 | +0.07 | 0.066 | 2007-02-06 | planet-host star |
| 062175 | 0.198 | 2.52 | 1.83 | 9.53 | 78.2 | 0.27 | 0.14 | +0.150 | 2008-05-21 | |
| 062816 | 0.296 | 3.57 | 2.16 | 9.49 | +31.8 | 0.03 | 0.08 | +0.069 | 2007-02-07 | |
| 063048 | 0.189 | 1.81 | (1.1) | 9.50 | 107.6 | 0.20 | 0.02 | 0.020 | 2008-05-25 | |
| 063636 | 0.351 | 2.93 | 2.26 | 9.62 | +22.0 | 0.01 | +0.18 | 0.027 | 2007-04-19 | |
| 064150 | 0.187 | 2.21 | (1.0) | 9.63 | 14.4 | +0.01 | +0.03 | +0.067 | 2007-02-05 | |
| 064747 | 0.204 | 1.77 | (1.1) | 9.80 | 70.1 | 0.08 | 0.01 | 0.193 | 2008-05-21 | |
| 070319 | 0.207 | 1.56 | 1.09 | 10.07 | 103.0 | 0.06 | 0.03 | 0.341 | 2007-04-19 | |
| 072604 | 0.191 | 2.26 | (1.1) | 10.03 | 122.9 | 0.23 | 0.19 | 0.147 | 2008-05-22 | |
| 075676 | 0.200 | 2.18 | (1.1) | 9.62 | 6.0 | 0.03 | 0.08 | 0.090 | 2008-08-14 | |
| 076114 | 0.195 | 1.76 | 0.91 | 9.59 | 34.0 | +0.06 | +0.00 | 0.003 | 2008-08-14 | |
| 077749 | 0.416 | 4.77 | 2.70 | 9.22 | +79.9 | +0.15 | +0.12 | +0.234 | 2008-05-27 | |
| 078217 | 0.213 | 1.17 | 1.89 | 9.54 | 10.8 | 0.02 | +0.09 | 0.215 | 2008-05-22 | |
| 079672 | 0.193 | 2.34 | 1.63 | 9.66 | +1.7 | 0.06 | 0.03 | +0.039 | 2007-02-06 | |
| 085042 | 0.187 | 2.01 | (0.8) | 9.43 | 95.8 | +0.00 | 0.02 | +0.035 | 2008-08-14 | |
| 085810 | 0.193 | 2.86 | 2.05 | 9.43 | +88.7 | 0.07 | +0.10 | +0.154 | 2008-08-14 | |
| 088194 | 0.196 | 1.78 | (0.8) | 9.67 | 49.2 | 0.04 | +0.01 | 0.071 | 2008-08-15 | |
| 088945 | 0.558 | 6.51 | (1.1) | 9.73 | +11.4 | 0.08 | +0.42 | 0.025 | 2008-08-14 | outlier (Fig. 5) |
| 089282 | 0.240 | 3.41 | 2.45 | 9.34 | +77.5 | 0.21 | +0.02 | +0.001 | 2008-05-21 | |
| 089474 | 0.189 | 2.50 | (0.9) | 9.89 | 6.1 | 0.25 | +0.04 | +0.010 | 2008-08-14 | |
| 089912 | 0.436 | 6.04 | 2.69 | 9.43 | +62.9 | 0.12 | +0.24 | +0.036 | 2008-05-26 | |
| 090004 | 0.176 | 1.76 | (1.2) | 9.83 | 157.4 | 0.01 | 0.14 | 0.013 | 2008-05-22 | planet-host star |
| 091287 | 0.185 | 2.05 | 1.74 | 9.21 | 111.6 | +0.01 | 0.11 | 0.004 | 2008-05-21 | |
| 096184 | 0.165 | 2.03 | 1.65 | 9.25 | +64.8 | 0.08 | +0.01 | +0.107 | 2008-05-26 | |
| 096395 | 0.218 | 2.30 | 2.18 | 9.76 | +10.9 | 0.05 | 0.02 | 0.119 | 2008-08-14 | |
| 096402 | 0.182 | 1.99 | (1.1) | 9.90 | 115.2 | 0.17 | 0.01 | 0.040 | 2008-05-25 | |
| 096901 | 0.185 | 1.97 | (1.1) | 9.77 | 24.2 | 0.12 | +0.00 | +0.086 | 2008-05-27 | planet-host star |
| 096948 | 0.175 | 1.85 | 1.52 | 9.62 | 8.8 | +0.00 | +0.06 | +0.097 | 2008-05-26 | |
| 097420 | 0.209 | 2.57 | 2.22 | 9.65 | +32.3 | +0.00 | +0.04 | +0.064 | 2008-05-21 | |
| 098921 | 0.329 | 3.66 | 2.47 | 9.13 | +25.7 | 0.01 | +0.17 | +0.158 | 2008-05-27 | |
| 100963 | 0.200 | 2.39 | 1.72 | 9.71 | 1.6 | 0.03 | 0.02 | 0.012 | 2008-05-22 | |
| 104075 | 0.409 | 5.01 | 2.72 | 9.20 | +85.6 | 0.12 | +0.09 | +0.033 | 2008-05-27 | |
| 109110 | 0.409 | 4.78 | 2.49 | 9.28 | +63.3 | +0.04 | +0.19 | +0.052 | 2008-08-12 | |
| 110205 | 0.216 | 1.98 | 1.09 | 9.96 | 46.0 | 0.12 | +0.06 | 0.215 | 2008-08-11 | |
| 112504 | 0.209 | 1.99 | 2.01 | 9.63 | 16.0 | 0.06 | 0.01 | +0.020 | 2008-08-11 | |
| 113579 | 0.573 | 10.31 | 3.06 | 9.57 | 1.8 | 0.24 | +0.48 | +0.049 | 2008-08-11 | |
| 113989 | 0.222 | 1.94 | (0.8) | 10.13 | 274.9 | 0.13 | 0.20 | 0.482 | 2008-08-13 | |
| 115715 | 0.215 | 2.34 | 1.72 | 10.08 | 85.6 | 0.29 | +0.06 | 0.201 | 2008-08-12 | |
| 116613 | 0.349 | 2.96 | 2.12 | 8.95 | +60.1 | 0.05 | +0.12 | +0.127 | 2008-08-12 | |
| Sun/Moon | 0.193 | 2.29 | 0.92 | 9.66 | 2007-02-07 |
Note. Following the HIP number (column 1), is the residual flux at the line center of the Ca ii 8542 line (column 2), is the projected rotational velocity in km s-1 calibrated in this study (cf. Sect. 3) (column 3), is the non-LTE lithium abundance (derived in Sect. 4.3 of Paper I and expressed in the usual normalization of ) (column 4), and is the logarithm of the stellar age (in yr) evaluated from the evolutionary tracks ( defined in Sect. 3.3 of Paper I) (column 5). In columns 6–9 are presented the starSun differences of (effective temperature) (surface gravity), (microturbulence), and Fe/H (metallicity), respectively, which were established precisely in Paper I by using the complete differential analysis (cf. Sect. 3.1.2 therein). Column 10 gives the observational date of each OAO spectrum, which we used for the measurement of .