SS 433’s circumbinary ring and accretion disc viewed through its attenuating disc wind
Abstract
We present optical spectroscopy of the microquasar SS 433 covering a significant fraction of a precessional cycle of its jet axis. The components of the prominent stationary H and H lines are mainly identified as arising from three emitting regions: (i) a super-Eddington accretion disc wind, in the form of a broad component accounting for most of the mass loss from the system, (ii) a circumbinary disc of material that we presume is being excreted through the binary’s L2 point, and (iii) the accretion disc itself as two remarkably persistent components. The accretion disc components move with a Keplerian velocity of in the outer region of the disc. A direct result of this decomposition is the determination of the accretion disc size, whose outer radius attains 8 in the case of Keplerian orbits around a black hole mass of 10 . We determine an upper limit for the accretion disc inner to outer radius ratio in SS 433, , independent of the mass of the compact object. The Balmer decrements, HH, are extracted from the appropriate stationary emission lines for each component of the system. The physical parameters of the gaseous components are derived. The circumbinary ring decrement seems to be quite constant throughout precessional phase, implying a constant electron density of for the circumbinary disc. The accretion disc wind shows a larger change in its decrements exhibiting a clear dependence on precessional phase, implying a sinusoid variation in its electron density along our line-of-sight between 10 and 13. This dependence of density on direction suggests that the accretion disc wind is polloidal in nature.
keywords:
stars: individual: SS 433 – stars: winds, outflows – binaries: spectroscopic1 Introduction
Microquasars are X-ray binaries which undergo a wide range of physical processes including accretion onto a compact object (black hole or neutron star) and the launch of relativistic jets. SS 433, one of the most studied microquasars, became famous as the first known source of relativistic jets in the Galaxy, and it is the only system, X-ray binary or active galactic nucleus (AGN), for which atomic emission lines have so far been associated with the jets, hence implying a baryonic content (i.e., , Milgrom, 1979; Crampton & Hutchings, 1981; Fender et al., 2000).
The optical spectrum of SS 433 is characterised by the presence of numerous broad emission lines with complex profiles, on top of a bright continuum. As at near-infrared and X-ray wavelengths, these emission lines can be divided into two groups: lines that are referred to as stationary, albeit highly variable in strength and profile, and lines that are moving. The latter are thought to originate in the two oppositely-directed relativistic jets moving with a speed . The system SS 433 shows four main periodicities: the binary’s orbital motion, with a period of about 13.08 days (Crampton & Hutchings, 1981); the jet axis precession and nutation, with periods of about 162 and 6 days Katz et al. (1982), respectively, and a recently discovered 550 day precession of the radio ruff (Doolin & Blundell, 2009). A configuration where two jets emerge in opposite directions from the central object (Fabian & Rees, 1979), in which the jet axis undergoes a precession cycle every 162 days was proposed to describe the motion of the emission lines (Milgrom, 1979), and this is referred to as the kinematical model.
The stationary optical and near-infrared spectrum of SS 433 is dominated by hydrogen and He i emission lines (Margon, 1984) and at least 15 per-cent of the flux in the hydrogen lines is contributed by the accretion disc itself (Perez M. & Blundell, 2009). The emission-line spectra of accretion discs, and their evolution with orbital and precessional phases, comprise most of the information we can obtain about the temperature and density variations as well as velocity gradients within the disc (Skidmore et al., 2000).
The Balmer decrements of the stationary lines in SS 433 have not previously been studied due to the high interstellar extinction towards the object, which makes the detection of the H line rather difficult (Panferov & Fabrika, 1997). The decrements are highly dependent on physical parameters of the gas such as its temperature, optical depth and also the nature of the source of radiation (Drake & Ulrich, 1980).
The hard radiation field around compact objects and the expected high electron densities for SS 433 ( cm-3, Panferov & Fabrika, 1997) require that we use an adequate treatment for such environments in order to study the emission-line gas. At high densities, and in the presence of heavy elements, excitation by collisional processes become a relevant factor (Ferland & Rees, 1988). Drake & Ulrich (1980) performed theoretical calculations of the emission-line spectrum from a slab of hydrogen at moderate to high densities (cm-3) over a wide range of physical parameters, including values close to those observed in SS 433’s gas (Panferov & Fabrika, 1997). We compare our estimates with Drake & Ulrich’s findings in Section 4.
The existence of dust mixed with the emitting gas would have effects on the Balmer decrement that are by no means negligible (Osterbrock & Ferland, 2006). SS 433’s optical spectrum reveals evidence of severe dust extinction, such as the remarkably red continuum and the presence of prominent interstellar absorption lines in the form of diffuse interstellar bands (Margon, 1984). In our optical data described in subsequent sections, and in agreement with previous observations (e.g., Murdin et al., 1980; Margon, 1984; Gies et al., 2002, among others), we have detected the diffuse interstellar bands at 4430, 5778 and 5780 Å and also the interstellar lines Ca H , Ca K as well as Na D . Murdin et al. (1980) reported an interstellar absorption (i.e., Galactic extinction) of mag toward SS 433, obtained from infrared measurements. This result has been corroborated by Gies et al. (2002) by fitting the spectral energy distribution, and the currently most accepted value is mag.
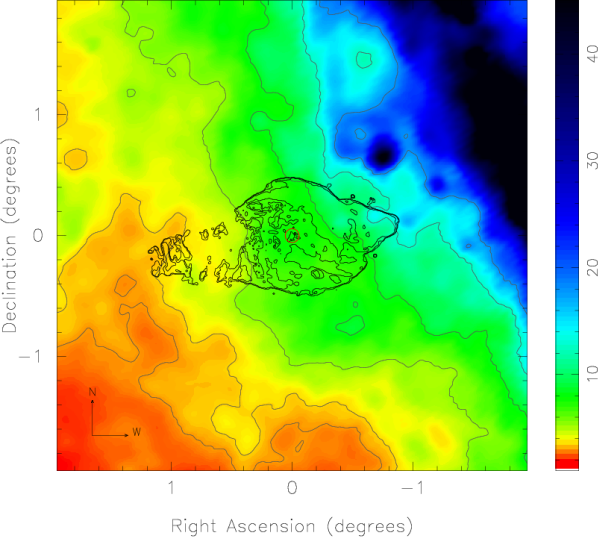
Fig. 1 shows the map of Galactic extinction in the direction of the SS 433/W50 complex. We constructed this extinction image by converting the colour excess map of Schlegel et al. (1998) into an estimate of the reddening, assuming a selective extinction, , equal to the average value for the Galaxy (i.e., , Cardelli et al., 1989), where is the colour excess. It is clear from the image that the 7.8 mag of extinction is consistent with the interstellar absorption gradient. The extinction estimate from this map towards SS 433’s position is mag. Although the value for is quite accurate, the choice of is not. The intrinsic error introduced by implies that the accuracy of the extinction estimate is not better than to a tenth of a magnitude. Therefore, we corrected our spectra (whose reduction is described in Section 2) for mag of interstellar absorption using the reddening law of Cardelli et al. (1989), before calculating the Balmer decrements.
In this paper we decompose the profiles of the stationary emission lines, H and H, with a number of Gaussian components (Section 3). Each model component is identified with its corresponding emitting origin. In Section 4 we analyse the physical conditions of each component present in SS 433 and its behaviour as a function of orbital and precessional phases, via the Balmer decrement. In Section 5 we present our calculations for the accretion disc radii and compare our findings with discs from other objects that share some common features with SS 433.
2 Observations and data reduction
We present optical spectroscopy data covering most of a precessional cycle of SS 433’s jet-axis (and presumably therefore accretion disc). The data were acquired with the Supernova Integral Field Spectrograph (SNIFS) at the University of Hawaii 2.2-m telescope by the Nearby Supernova Factory (Aldering et al., 2002). The spectrograph is composed of two modules, one for blue wavelengths covering the region between 320 nm to 560 nm with a resolution of 1000 at 430 nm, and a module for red wavelengths (520 nm to 1000 nm) with a resolution of 1300 at 760 nm. The data consist of 38 spectra (considering blue and red as one spectrum). The data set can be subdivided in two groups, one spanning from 2006 April 27 to July 30 (precessional phases ), and another one between 2006 October 1 and November 10 (precessional phases ). We use the convention in which orbital phase () zero is when the donor star is eclipsing out the compact object (Goranskii et al., 1998). Precessional phases are calculated based on the ephemeris reported in Fabrika (2004), where precession phase zero is when the moving jet lines are maximally separated hence the inclination of the jet axis with our line-of-sight attains a minimum, i.e., it corresponds to maximum exposure of the accretion disc to the observer.
The data were reduced by the Nearby Supernova Factory group through their standard pipeline. Frequent observations of standard stars and the arc lamp were performed during each night to perform flux calibration and provide an accurate estimate of the wavelength axis. Wavelength calibration was carried out by fitting a high-order polynomial to the lamp spectra. Standard star division was applied to each frame in order to flux calibrate the data. Telluric features were not removed. All the subsequent analyses were carried out using the Perl Data Language (http://pdl.perl.org, Glazebrook et al., 1997).
2.1 Fitting procedure
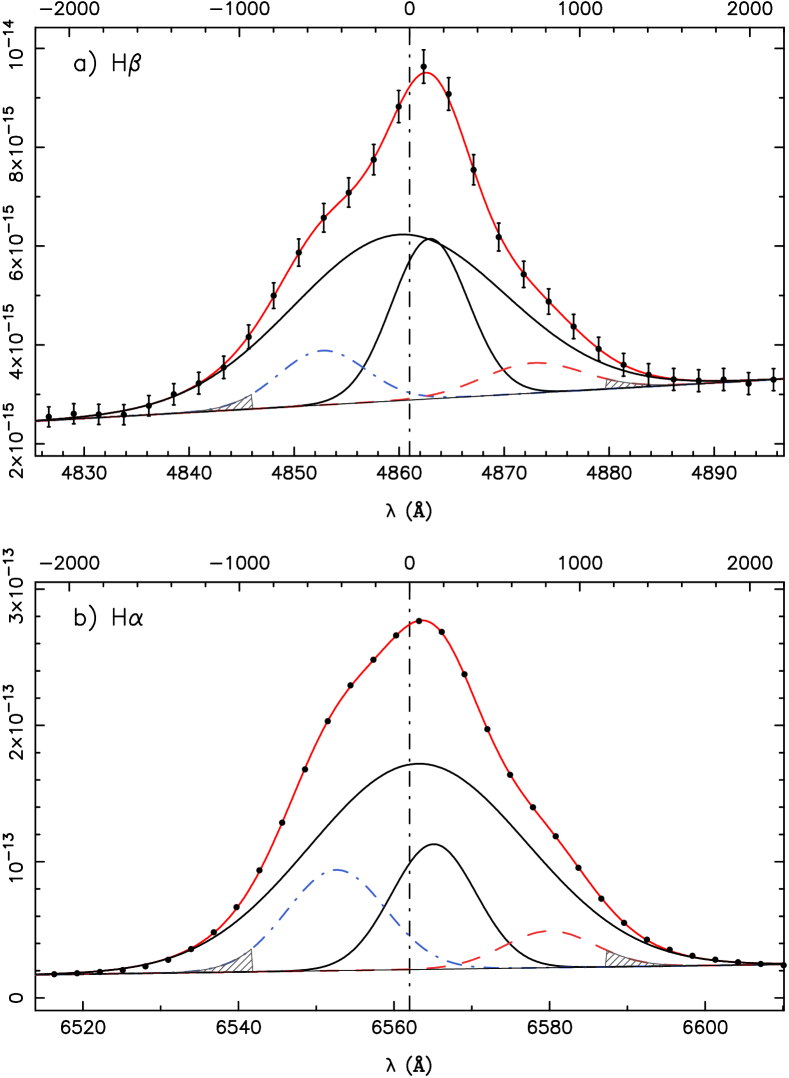
Examples of the reduced spectra in the vicinity of the H and H lines are shown in Fig. 2. This figure also shows the best combination of Gaussian components fitted to those spectra. The blue spectra were rebinned to the spectral resolution of the red spectra (130 pixel-1). The underlying continuum was subtracted by fitting a low-order polynomial (linear in most cases and only in some cases parabolic). The best-fitting parameters were determined by minimisation in the pixel space. We explain the fitting model and the deconstruction of these profiles in the next section.
3 Decomposition of stationary lines
The stationary emission lines in SS 433 possess complex and variable profiles (Blundell et al., 2008; Perez M. & Blundell, 2009). Falomo et al. (1987) fitted the stationary H line profile of their low-resolution spectra using three to four Gaussian components. Their best fit consisted of one broad component plus three narrower components. Blundell et al. (2008) carried out decomposition of the H line using higher-resolution data. They found one broad component (FWHM ) whose width was observed to decrease with precessional phase (i.e., as the jets become more in the plane of the sky) identified as the accretion disc wind, and two narrower, red- and blue-shifted, components which were stationary in wavelength, being radiated from a glowing circumbinary ring. In the data presented in that paper, there was no evidence of the accretion disc lines being apparent, in contrast with their persistent appearance in the data presented here.
Recently, Perez M. & Blundell (2009) were able to model the complex Brackett- (Br) stationary line with usually 5 Gaussian components: a broad wind component (FWHM ), two Gaussian components accounting for the circumbinary ring and they also found the presence of two components being radiated by matter spiralling in the accretion disc. The presence of SS 433’s accretion disc in the near-infrared line seems to be persistent and their separation implies a circular velocity between 500 and 700 . We modelled our optical data following a similar approach.
Following the analysis done by Perez M. & Blundell (2009), the H and H stationary lines were fitted with four Gaussian components in order to account for the complexity of the profiles. Although two narrow components have been used in the past to represent the split lines from the circumbinary ring (Blundell et al., 2008; Perez M. & Blundell, 2009), because of the low resolution of the spectra we present in this paper (130 ) just one central narrow component was needed to represent the contribution from the circumbinary. Fig. 2 shows examples of fitted profiles.
The presence of a P Cygni feature in the stationary lines at certain precessional phases has been noted by several authors (Crampton & Hutchings, 1981; Filippenko et al., 1988; Gies et al., 2002). An absorption feature in the blue wing of the stationary line profile would indeed complicate the analysis and it would have to be taken into account using models of outflowing winds (e.g., Castor & Lamers, 1979). We detected the P Cygni absorption signature at the epochs and we have excluded these data from our analysis.
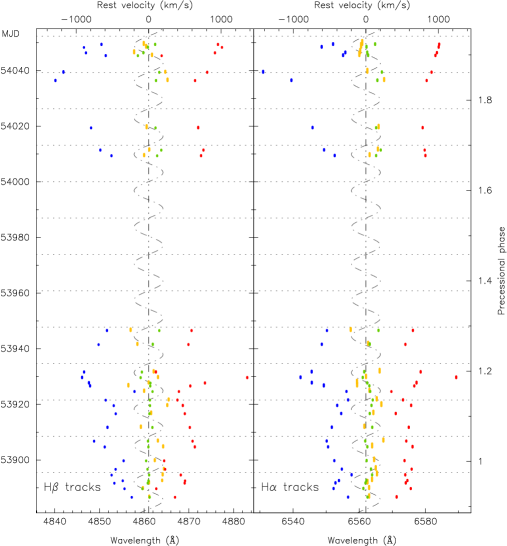
The reason why we identify the accretion disc with two separate components representing each peak of the disc’s profile is based on the model of emission line formation in accretion discs presented by Horne & Marsh (1986), in which the velocity of the outer regions of the disc is represented by half the velocity separation of the line peaks (Horne & Marsh, 1986). This is caused by the Doppler effect and the rotational motion of the matter within the disc. Therefore, the speed with which the radiating material spirals within the accretion disc corresponds to half the difference between the speed at which those lines are moving (given by the relative position of the peaks), under the assumption that the fitted centroids correspond to the tangent speed. This reveals material that is orbiting in the potential well at speeds of about 600 (see blue and red tracks in Fig. 3).
Fig. 3 does not reveal a clear signature of the expected motion for the accretion disc centroid and certainly nothing corresponding to the Fabrika & Bychkova (1990) sinusoidal plot that assumes a circular orbit. It is not possible to identify what would be the correct phasing of the motion of the disc due to lack of knowledge about the circularity or eccentricity of the orbit. For certain eccentricities, there are not necessarily two well-defined peaks, for example. A detailed analysis of this problem requires much more long-term monitoring and sophisticated modelling.
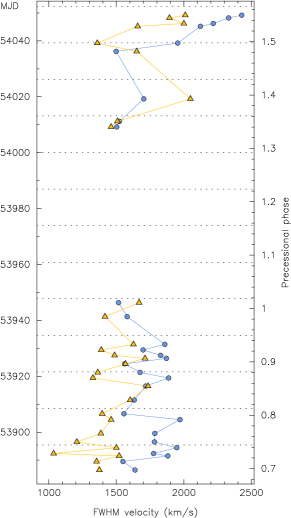
Fig. 3 (left and centre panels) clearly shows that the accretion disc lines appear slower at orbital phase zero. This is when the donor star obscures the inner (faster) region of the accretion disc. This is seen most clearly in H. Additionally, there appears to be an episode around MJD 53930, which corresponds to orbital phase 0.5, where the accretion disc lines seem to be rotating faster than usual and may simply correspond to a time when we have an unimpeded view into the inner, hence faster, part of the accretion disc. The right panel in Fig. 3 shows the evolution of the FWHM of the wind components of the stationary H and H lines. This panel also shows that the wind lines appear to get broader at longer wavelengths, which is consistent with previous near-infrared observations of the Br line, where the wind component has been reported to be broader than in H (Perez M. & Blundell, 2009). It is remarkable that near the end of the data set we present in this paper, the width of the accretion disc wind attains a velocity of almost 2500 , which translates into a factor 1.7 increase in the 10-4 yr-1 mass-loss rate estimated from recombination line fluxes by Perez M. & Blundell (2009).
4 Results
4.1 Basic picture
Modelling of the stationary Balmer emission lines, H (this work and Blundell et al., 2008), H (this work) and Br (Perez M. & Blundell, 2009), yields a clear and consistent interpretation of the radiating components present in the SS 433 system. The main components of the system, as inferred from the decomposition of the stationary line complexes, are: a rotating accretion disc, a fast outflowing wind that accounts for most of the mass loss in the system and a circumbinary ring probably being fed from the L2 point. The moving emission lines from the jets sometimes blend with the stationary ones at around or 0.4, contributing significantly to the intensity variation and profile shape. Moreover, care must be taken since the intensities and profiles of the stationary lines vary strongly during flares (Blundell et al. in prep., Margon, 1984).
4.2 Balmer decrement of stationary lines
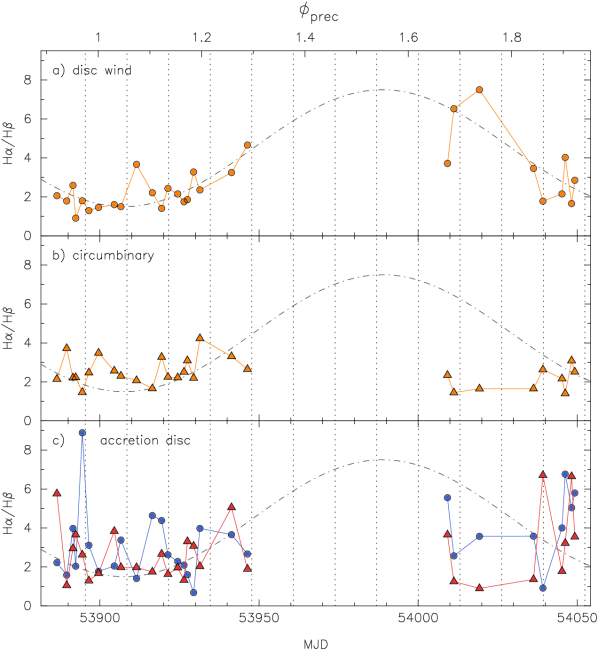
The hydrogen Balmer lines show very variable Balmer decrements in SS 433. Fig. 4 shows that the computed Balmer decrements for the stationary emission-lines scatter from HH . In the interpretation of these results we use the calculations carried out by Drake & Ulrich (1980) who modelled the emission-line spectrum from a slab of hydrogen at high densities, by taking into account important mechanisms such as collisional excitation and de-excitation, as well as self-absorption processes. It is important to chose reasonable temperature and optical depth () parameter values in order to apply their calculations to SS 433. We mainly utilise the decrements computed for a model with K. For a theoretically-modelled accretion flow, Kramer’s approximation for the optical depth yields (Drake & Ulrich, 1980). Since decrements for this exact value are not reported in their paper, we use instead. According to Drake & Ulrich (1980) these ratios ( HH ) then imply up to four orders of magnitude variation in density throughout the precession period. This large inferred variation is not a problem for plausible physical models. We will analyse and discuss the Balmer decrements calculated for each component of SS 433 in the following sub-sections.
4.2.1 Circumbinary disc decrements
The Balmer line ratios of the components corresponding to the circumbinary excretion disc observed by Blundell et al. (2008) are shown in the middle panel of Fig. 4. They are roughly constant throughout precessional phase with an average value of H/H (1 scatter). This implies a moderate electron density of , approximately constant throughout the precessional cycle and given the similarity of this Balmer decrement to the Case B canonical value of 2.8, this is consistent with no attenuation from the accretion disc wind, in accordance with the circumbinary nature of this emitting region (Doolin & Blundell, 2009).
4.2.2 Accretion disc wind decrements
Fig. 4 shows that in the case of the accretion disc wind, the Balmer decrements have a very clear precessional phase dependence, showing a clear tendency towards lower electron density (steeper decrements) as the jet axis becomes more in the plane of the sky. This dependence of density on direction is evidence for the polloidal nature of the wind. The decrement values for the disc wind vary between quite flat H/H between precessional phases 0.95–0.05 and steep H/H for phases 0.65–0.84. These values correspond to variations in electron density of and , respectively.
4.2.3 Accretion disc decrements
The accretion disc lines are the ones that show the most dramatic and scattered fluctuations in decrement. Both lines, H and H, show a similar level of scatter. The average decrement for the red and blue components are H/H and H/H, respectively. Inverted Balmer decrements can be seen at some epochs, implying very high densities and possibly an enhanced inflow of matter from the companion onto the accretion disc. The decrement of the accretion disc itself appears to be dominated by fluctuations in the instantaneous wind density rather than being dominated by any precessional phase dependence.
5 Size of the accretion disc
A direct consequence of Horne & Marsh’s 1986 model of the emission line profile formed in an accretion disc is that the emission close to the inner radius of the disc contributes to the outer wings of the double-peaked profile, while the regions nearer the outer radius provide the emission for the peaks (see fig. 1 in Horne & Marsh, 1986). By considering this along with the assumption that the velocity of the matter spiralling in the accretion disc is Keplerian, we can estimate the size of the disc (Mason et al., 2000).
For a test particle in Keplerian motion at a distance from a central object of mass , the Keplerian speed projected onto the plane of the sky is
| (1) |
where is the angle between the normal to the disc and our line-of-sight. The disc is edge-on when this inclination angle is and pole-on when . In our decomposition of the Balmer lines’ profiles, the Keplerian velocity of the gas at the outer radius of the disc is given by half the separation between the peaks of the two Gaussian components representing the accretion disc, while the Keplerian velocity of the gas closer to the disc inner radius corresponds to half the separation between the red wing of the red-shifted component and the blue wing of the blue-shifted component (see hatched area in Fig. 2).
The most suitable epoch to measure the inner and outer radii of the accretion disc is when the disc is in between the companion star and the observer (orbital phase 0.5) and when the disc is not totally edge-on (i.e., ) at precessional phase close to 0.33 or 0.66. The closest spectrum in our dataset to those epochs was taken on MJD 54009 which corresponds to and . This spectrum is depicted in Fig. 2. Both the half wing separation and the half peak separation for the accretion disc lines were measured from this spectrum.
Half the separation between the peaks of the fitted Gaussian components of the disc yields a Keplerian velocity for the outer part of the disc of 620 , measured from both the H and H emission. The Keplerian velocity of the inner part of the disc was determined by measuring the positions in velocity of the line wings (centre of the hatched areas in Fig. 2) by inspection. Both H and H present wing velocities of 1150 .
The central compact object in SS 433 is most likely to be a stellar mass black-hole, rather than a neutron star (Gies et al., 2002; Fabrika, 2004; Lopez et al., 2006; Blundell et al., 2008). It is evident from Equation 1 that large black-hole masses imply larger outer radii for the accretion disc. The total mass of the accretion disc plus the compact object has been calculated by Blundell et al. (2008) and it attains 16 . However, we point out that there has been a large dispersion reported for the component masses of SS 433 (e.g., Lopez et al., 2006). We will assume that the mass of the black hole itself is of the order of 10 .
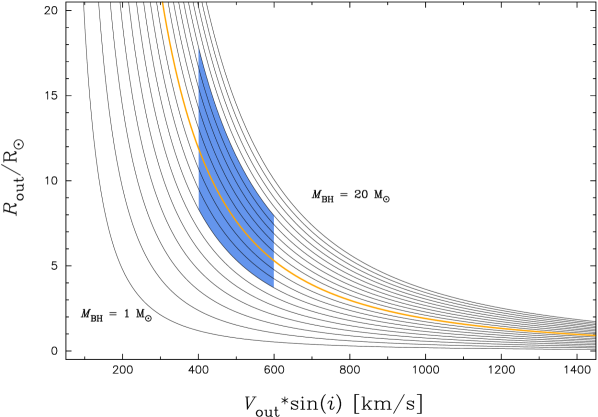
The Keplerian velocity for the inner region of the disc of 1200 implies that the accretion disc’s inner radius is , where . The estimated value for corresponds to an upper limit to the inner radius of the accretion disc at the time of observation. This is a direct consequence of the high obscuration presented in the system due to the accretion disc wind, which hinders the emission propagating from the inner parts of the disc. Additionally, the determination of the full-width at zero intensity (FWZI), or distance between the wings, could be imprecise sometimes and it could add certain degree of uncertainty to the value. Also, it is important to note that the inner radius of an accretion disc is known to recede as a consequence of changes in the accretion rate onto the compact object, for a range of masses of the compact object.
On the other hand, the distance between the peaks of the accretion disc components depicted in Fig. 2 yields a velocity for the disc outer region of about 620 , which if Keplerian yields . Fig. 5 shows how varies as a function of the Keplerian velocity of the outer edge. This is fully consistent with a previous estimate of the overall size of the system, whose semi-major axis of the orbit has been reported to be 80 (Perez M. & Blundell, 2009).
The Keplerian velocity of the outer region of the accretion disc has been reported to be lower in the near-infrared Br line (Perez M. & Blundell, 2009) than in the optical lines analysed in this paper. This is consistent with observations of other accretion discs such as the one in WZ Sge. By analysing Doppler tomography maps, Skidmore et al. (2000) found that the Br emission is being emitted from a region further away from the central object, implying that this emission is more representative of the outer regions of the disc. This is probably the case in SS 433 since the peak separation in Br is smaller than in the Balmer lines. The reported half separation of the peaks of 500 by Perez M. & Blundell (2009) implies an outer radius .
The black-hole mass does not affect the inner to outer radius ratio, since . In the case of SS 433’s disc, (for an outer radius ).
The size of SS 433’s accretion disc is quite large compared with other close binary systems. Mason et al. (2000) determined the size of WZ Sge to be at most 0.43 for a white dwarf with the Chandrasekhar mass. This is about 20 times smaller than SS 433’s disc. The : ratio is approximately the same in both these systems.
6 Conclusions
We have presented optical spectroscopy of the microquasar SS 433 covering a significant fraction of the precessional cycle of its accretion disc. The components of the prominent stationary H and H lines have been identified as arising from three emitting regions: an accretion disc wind which is super-Eddington (Perez M. & Blundell, 2009), in the form of a broad component accounting for most of the mass loss in the system, a circumbinary disc of material probably excreted through the binary’s L2 point, and the accretion disc itself as two persistent components, having an outer region Keplerian velocity of .
A direct result of this decomposition using our UKIRT data published in Perez M. & Blundell (2009) was the determination of the accretion disc size, whose outer radius attains 8 , for an assumed black hole mass of 10 . With the data presented in this paper we determined the accretion disc inner to outer radius ratio in SS 433, to be 0.2, independent of the mass of the compact object.
The Balmer decrements, HH, were extracted from the stationary emission lines for each component of the system. The decrement of the circumbinary ring seems to be quite constant throughout precessional phase, implying a fairly constant electron density of for the circumbinary disc. The accretion disc wind shows larger changes in its decrements as a function of precessional phase, implying variations in its density, , between and cm-3. Thus, the physical parameters of the gaseous components imply rather dense environments emitting the Balmer lines.
Acknowledgments
We thank the referee for a careful reading of the paper. We are very grateful to the Sciences and Technology Facilities Council (stfc) and Conicyt for the award of a STFC-Gemini studentship. We are specially grateful to Greg Aldering, the Nearby Supernova Factory collaboration and the University of Hawaii for their generosity in allowing us to obtain some spectra on SS 433 during interstitial time within their main supernovae follow up campaign. K. B. thanks the Royal Society for a University Research Fellowship.
References
- Aldering et al. (2002) Aldering, G., et al. 2002, SPIE, 4836, 61
- Blundell et al. (2008) Blundell, K. M., Bowler, M. G., & Schmidtobreick, L. 2008, ApJ, 678, L47
- Cardelli et al. (1989) Cardelli, J. A., Clayton, G. C., & Mathis, J. S. 1989, ApJ, 345, 245
- Castor & Lamers (1979) Castor, J. I., & Lamers, H. J. G. L. M. 1979, ApJS, 39, 481
- Crampton & Hutchings (1981) Crampton, D., & Hutchings, J. B. 1981, ApJ, 251, 604
- Doolin & Blundell (2009) Doolin, S., & Blundell, K. M. 2009, ApJL, 698, L23
- Drake & Ulrich (1980) Drake, S. A., & Ulrich, R. K. 1980, ApJS, 42, 351
- Dubner et al. (1998) Dubner, G. M., Holdaway, M., Goss, W. M., & Mirabel, I. F. 1998, AJ, 116, 1842
- Fabian & Rees (1979) Fabian, A. C., & Rees, M. J. 1979, MNRAS, 187, 13P
- Fabrika & Bychkova (1990) Fabrika, S. N., & Bychkova, L. V. 1990, A&A, 240, L5
- Fabrika (2004) Fabrika, S. 2004, Astrophysics and Space Physics Reviews, 12, 1
- Falomo et al. (1987) Falomo, R., Boksenberg, A., Tanzi, E. G., Tarenghi, M., & Treves, A. 1987, MNRAS, 224, 323
- Fender et al. (2000) Fender, R., Rayner, D., Norris, R., Sault, R. J., & Pooley, G. 2000, ApJL, 530, L29
- Ferland & Rees (1988) Ferland, G. J., & Rees, M. J. 1988, ApJ, 332, 141
- Filippenko et al. (1988) Filippenko, A. V., Romani, R. W., Sargent, W. L. W., & Blandford, R. D. 1988, AJ, 96, 242
- Gies et al. (2002) Gies, D. R., Huang, W., & McSwain, M. V. 2002, ApJ, 578, L67
- Glazebrook et al. (1997) The Perl Data Language, Glazebrook K., Economou F., The Perl Journal, 1997, Issue 5, 5 - also reprinted in Dr Dobbs Journal, Fall 1997 issue
- Goranskii et al. (1998) Goranskii, V. P., Esipov, V. F., & Cherepashchuk, A. M. 1998, Astronomy Reports, 42, 209
- Horne & Marsh (1986) Horne, K., & Marsh, T. R. 1986, MNRAS, 218, 761
- Katz et al. (1982) Katz, J. I., Anderson, S. F., Grandi, S. A., & Margon, B. 1982, ApJ, 260, 780
- Lopez et al. (2006) Lopez, L. A., Marshall, H. L., Canizares, C. R., Schulz, N. S., & Kane, J. F. 2006, ApJ, 650, 338
- Margon (1984) Margon, B. 1984, ARA&A, 22, 507
- Mason et al. (2000) Mason, E., Skidmore, W., Howell, S. B., Ciardi, D. R., Littlefair, S., & Dhillon, V. S. 2000, MNRAS, 318, 440
- Milgrom (1979) Milgrom, M. 1979, A&A, 76, L3
- Murdin et al. (1980) Murdin, P., Clark, D. H., & Martin, P. G. 1980, MNRAS, 193, 135
- Osterbrock & Ferland (2006) Osterbrock, D. E., & Ferland, G. J. 2006, Astrophysics of gaseous nebulae and active galactic nuclei, 2nd. ed. by D.E. Osterbrock and G.J. Ferland. Sausalito, CA: University Science Books, 2006,
- Panferov & Fabrika (1997) Panferov, A. A., & Fabrika, S. N. 1997, Astronomy Reports, 41, 506
- Perez M. & Blundell (2009) Perez M., S., & Blundell, K. M. 2009, MNRAS, 397, 849
- Schlegel et al. (1998) Schlegel, D. J., Finkbeiner, D. P., & Davis, M. 1998, ApJ, 500, 525
- Skidmore et al. (2000) Skidmore, W., Mason, E., Howell, S. B., Ciardi, D. R., Littlefair, S., & Dhillon, V. S. 2000, MNRAS, 318, 429