On the Nature of Star Formation at Large Galactic Radii
Abstract
We have compared far-ultraviolet (FUV), near-ultraviolet (NUV), and H measurements for star forming regions in 21 galaxies, in order to characterise the properties of their discs at radii beyond the main optical radius ().
In our representative sample of extended and non-extended UV discs we find that half of the extended UV discs also exhibit extended H emission. We find that extended UV discs fall into two categories, those with a sharp truncation in the H disc close to the optical edge (R25), and those with extended emission in H as well as in the ultraviolet. Although most galaxies with strong H truncations near R25 show a significant corresponding falloff in UV emission (factor 10–100), the transition tends to be much smoother than in H, and significant UV emission often extends well beyond this radius, confirming earlier results by Thilker et al. (2007) and others.
After correcting for dust attenuation the median fraction of total FUV emission from regions outside of is 1.7%, but it can be as high as 35% in the most extreme cases. The corresponding fractions of H emission are approximately half as large on average. This difference reflects both a slightly lower ratio of H to UV emission in the HII regions in the outer discs, as well as a lower fraction of star clusters showing HII regions. Most HII regions in the extended disc have fluxes consistent with small numbers of ionising O-type stars, and this poor sampling of the upper initial mass function in small clusters can probably account for the differences in the emission properties, consistent with earlier conclusions by Zaritsky & Christlein (2007), without needing to invoke a significant change in the stellar IMF itself. Consistent H/FUV ratios and brightest HII region to total H fluxes in the inner and extended discs across our whole galaxy sample demonstrate no evidence for a change in the cluster luminosity function or the IMF in the low gas density outer disc.
keywords:
galaxies: structure - galaxies: stellar content - stars: formation - galaxies: discs1 Introduction
One of the most interesting discoveries of the Galaxy Evolution Explorer (GALEX) satellite has been the presence of very extended ultraviolet (UV) emitting discs around many nearby galaxies. Thilker et al. (2005) first reported an extended UV disc for the spiral galaxy M83. Since then extended discs have be found in many galaxies, most notably NGC 4625 (Gil de Paz et al., 2005). Extended discs typically exhibit emission well beyond the classical optical edge of the galaxy, which is usually defined by R25, the radius at which the surface brightness in the B band drops below 25 magnitudes arcsec-2. In M83 UV knots are found extending to 4 R25, and are associated with large scale filamentary HI structures. These structures are now commonly termed extended ultraviolet discs (XUV-discs).
Subsequent studies have begun to characterise the frequency of XUV-discs and the properties of the star forming regions in these discs. Zaritsky & Christlein (2007) examined a sample of 11 galaxies and found an excess of blue (FUV -NUV 1, NUV 25) sources out to 2 R25 for of their sample. Based on and analysis of the GALEX Nearby Galaxies Survey (NGS; Gil de Paz et al. (2007a)), Thilker et al. (2007) concluded that extended discs are common, and can be divided into two distinct types. Type 1 discs ( 20% occurence) show structured UV bright regions beyond the typical star forming threshold; Type 2 discs (10% occurrence) display diffuse regions of UV emission, but not reaching extreme galactocentric radii. The vast majority of galaxies do not exhibit any significant emission beyond R25, and are not classified as extended, though it should be noted that there were no quantitative definitions to identify extended discs.
HII regions are often but not always associated with the extended UV emission. HII regions located well beyond the main star forming disc were identified in one of the first H surveys of galaxies (e.g. Hodge (1969, 1974); Hodge & Kennicutt (1983)), and have been studied in detail by Ferguson et al. (1998), van Zee et al. (1998), and Lelièvre & Roy (2000). Isolated intergalactic HII regions have also been identified by Gerhard et al. (2002), Sakai et al. (2002) and Cortese et al. (2004) in the Virgo and Abell 1367 clusters, and by Ryan-Weber et al. (2004) for nearby galaxies in groups. The lifetimes of massive ionising stars responsible for H emission are much lower than those of the stars responsible for most of the near-UV emission (of order 10 Myr vs 100 Myr), and this is reflected in the relative numbers of UV and H knots observed by Zaritsky & Christlein (2007).
The formation of massive stars beyond the classical ’edge’ of galaxies raises questions about their formation and properties, as well as their possible impacts on their low gas density environment. Spectroscopy of HII regions at extreme radii in M83 and NGC4625 by Gil de Paz et al. (2007b) showed them to be consistent with regions dominated by a single ionising source star with masses in the range 20-40 M☉. Ages for most of the UV knots are in the range 0–200 Myr, based on their integrated fluxes and colors (e.g., Thilker et al. (2005), Gil de Paz et al. (2005), Zaritsky & Christlein (2007), Dong et al. (2008)). Masses for the regions are more difficult to constrain; Gil de Paz et al. (2005) report a mass range of M☉ for NGC4625, and Werk et al. (2008) gives an upper mass limits in the range 600M☉ to 7000M☉ for HII regions associated with NGC1533. Dong et al. (2008) used the UV to IR spectral energy distributions to estimate the masses of UV knots and measured a range of M☉with a peak M☉ for M83. In a study of the HII regions of NGC628 Lelièvre & Roy (2000) postulated that the cluster mass function of these HII regions may be significantly different to that of the disc. Relatively little is known yet about the chemical abundance properties of the outer discs, but preliminary results show a range of behaviours. Abundance studies of a few systems such as M101 and NGC 628 show a continuous exponential abundance gradient extending into the outermost discs (Kennicutt et al., 2003; Ferguson et al., 1998). However a recent study of HII regions in the XUV disc of M83 show chemical properties that are decoupled from those of the brighter inner disc, with a nearly constant oxygen abundance of 0.3 (O/H)⊙ (Bresolin et al., 2009).
The XUV-discs are also important for understanding star formation thresholds in galaxies. Radial profiles in the H often show sharp turnovers, usually located near the optical R25 radius. Kennicutt (1989); Martin & Kennicutt (2001) showed that the distribution of gas density appears to be roughly continuous across this truncation in contrast to the massive star formation threshold visible in H profiles. These observation have been interpreted as arising from a threshold surface gas density, which could be attributed to gravitation instability (Kennicutt, 1989; Martin & Kennicutt, 2001), gas phase instabilities (Schaye, 2004) or gas cloud fragmentation instability (Krumholz & McKee, 2008). However UV emission, which also traces star formation does not display truncations as pronounced as those seen in H (Thilker et al., 2005). This raises questions about the nature and interpretation of the apparent H thresholds.
A closely related question is the physical origin of the XUV-discs. Dong et al. (2008); Bush et al. (2008) have argued that the XUV -discs can be understood in the context of normal gravitational threshold picture. Although the average gas densities beyond the H thresholds are too low in theory to allow star formation, in localised regions the density may be high enough to prompt star formation in a small volume. Others have suggested that interactions play a role. Interactions may disturb the gas creating regions that collapse and thus form pockets of stars. Gil de Paz et al. (2005) proposed such an interaction between NGC 4625 and its neighbor NGC 4618 and possibly NGC 4625A as a likely trigger for star formation at large radii. Similar processes may be able to account for the presence of HII regions at very large radii in some interacting and merging systems (Ryan-Weber et al., 2004; Oosterloo et al., 2004; Werk et al., 2008), but other factors may contribute such as galactic outflows and spiral density waves. Elmegreen & Hunter (2006) modelled star formation in the outer discs, citing the effects of compression and turbulence as well as the propagation of gaseous arms as continual drivers for low level star formation.
A common question underlying these studies is whether star formation at large radii represents a simple continuation of star formation with in the inner disc, or is it a separate mode of star formation altogether? Perhaps the most radical interpretation of the XUV discs is that they represent low surface density environments in which the stellar initial mass function is truncated at masses well below the 100 M☉ (Pflamm-Altenburg & Kroupa, 2008; Meurer et al., 2009). A strong preferential suppression of massive star formation in the discs could account for the putative excesses of UV emission relative to H emission, and possibly account for the differences in the outer disc profiles at the respective wavelengths.
Before these questions posed above can be answered we need uniform measurements of the UV and H properties of the extended discs for a representative sample of nearby galaxies. Although the published studies to date have highlighted the remarkable properties of a handful of galaxies, most have focussed on case studies of extreme examples such as M83 and NGC 4625. The goal of this study is to address the phenomenon in a broader context, by carrying out detailed photometric measurements in the UV and H for the discs and their individual star-forming regions, for 20 galaxies selected from the Spitzer Infrared Nearby Galaxies Survey (SINGS; Kennicutt et al. (2003)) as well as the prototype galaxy M83. Some of our work parallels an important study of UV radial profiles of nearby galaxies by Boissier et al. (2007), but our study differs in emphasis in focussing especially on the relation of the UV and H discs, and on measurements of the individual star-forming knots.
The remainder of this paper is organized as follows. In Section 2 we describe the GALEX and groundbased H observations that were used in this study, and in Section 3 we describe the processing and analysis of these data, including the treatment of dust attenuation. In Section 4 we present the observed properties of the extended discs in terms of their UV emission, H emission, and star formation properties, and in Section 5 we describe the properties of the populations of star-forming regions in both the inner and outer discs of the galaxies. In Section 6 we discuss the results in the context of the questions raised above, and in Section 7 we present a brief summary of results and conclusions.
2 The Data
2.1 Sample Selection
All the galaxies in our sample were taken from the Spitzer infrared Nearby Galaxies Survey (SINGS) and the GALEX Nearby Galaxy Survey (NGS). SINGS is a multi-wavelength imaging and spectroscopic survey of 75 nearby (D30Mpc) galaxies, including visible, near-infrared, ultraviolet and radio observations. The galaxies were selected to span a range of galaxy types, luminosities, and infrared/optical properties among normal galaxies in this volume. We selected a subset of 20 spiral galaxies, with emphasis on nearby, face-on or moderately inclined objects with major axis diameters in the range ; this was large enough to allow surface photometry of the inner disc whilst allowing for a reasonable background estimation outside the disc. We included all galaxies with known extended discs, but also included a representative sampling of galaxies selected independently from the outer disc struture. The prototype XUV disc galaxy M83 is not in the SINGS sample, so we added it to our sample for purposes of comparison.
The full list of galaxies along with their associated properties is presented in Table 1. Although this sample of galaxies does not cover the full range of possible galaxy types, it provides a representative sample of galaxies both with and without extended UV emission.
| NGC no. | Other | Type | B-Band | FUV | NUV | D25 | Distance | Ref | E(B-V) |
|---|---|---|---|---|---|---|---|---|---|
| Names(s) | Magnitude | Mag | Mag | (arcmin) | (Mpc) | ||||
| (1) | (2) | (3) | (4) | (5) | (6) | (7) | (8) | (9) | (10) |
| 628 | M74 | SAc | 11.4 | 1 | 0.07 | ||||
| 925 | SABd | 10.1 | 2 | 0.08 | |||||
| 1097 | SBd | 16.9 | 3 | 0.03 | |||||
| 1291 | SBa | 9.7 | 4 | 0.01 | |||||
| 1512 | SBab | 10.4 | 4 | 0.01 | |||||
| 1566 | SABbc | 18.0 | 3 | 0.01 | |||||
| 2841 | SAb | 14.0 | 5 | 0.02 | |||||
| 3198 | SBc | 9.8 | 6 | 0.01 | |||||
| 3351 | M95 | SBb | 9.3 | 3 | 0.03 | ||||
| 3521 | SABbc | 9.0 | 4 | 0.06 | |||||
| 3621 | Sad | 6.2 | 3 | 0.08 | |||||
| 4321 | M100, V | SABbc | 16.5 | 12 | 0.03 | ||||
| 4536 | V | SABbc | 16.5 | 12 | 0.02 | ||||
| 4579 | M58, V | SABb | 16.5 | 12 | 0.04 | ||||
| 4625 | SABmp | 9.5 | 4 | 0.02 | |||||
| 5194 | M51a | SABbc | 8.2 | 8 | 0.03 | ||||
| 5236 | M83 | SABc | 4.5 | 9 | 0.07 | ||||
| 5398 | SABdm | 15.0 | 3 | 0.07 | |||||
| 5474 | SAcd | 6.9 | 10 | 0.01 | |||||
| 7552 | SAc | 22.3 | 4 | 0.01 | |||||
| 7793 | SAd | 3.2 | 11 | 0.02 |
Column (1) lists the NGC number. Column (2) shows other common names for the galaxy, and the symbol ’V’ notes galaxies associated with the Virgo cluster. Column (3) indicates galaxy type, taken from the NASA-IPAC Extragalactic Database (NED)111The NASA/IPAC Extragalactic Database (NED) is operated by the Jet Propulsion Laboratory, California Institute of Technology, under contract with the National Aeronautics and Space Administration.. The B-band magnitude in Column (4) and D25 ellipse information in Column (5) are both taken from the RC3 catalogue (de Vaucouleurs et al., 1991). Columns (6) and (7) show the FUV and NUV AB magnitude taken from Gil de Paz et al. (2007a), errors are the same as previously published. Galaxy distances are shown in Column (8). Column (9) indicates the reference from which the galaxy distance was taken; (1) Tully & Fisher (1988); (2) Silbermann et al. (1996); (3) from the Virgo-infall corrected radial velocity adopting H0=70 km s-1 Mpc-1; (4) Kennicutt et al. (2003); (5) Macri et al. (2001); (6) Paturel et al. (2002); (7) Gavazzi et al. (1999); (8) Feldmeier et al. (1997); (9) Thim et al. (2003); (10) Drozdovsky & Karachentsev (2000); (11) assumed to be at the same distance as NGC 300 tanken from Freedman et al. (2001); (12) the distance to the Virgo cluster taken from Mei et al. (2007). Column (10) lists the Galactic colour excess taken from Schlegel et al. (1998).
2.2 GALEX Data
All ultraviolet images were taken from the GALEX data release 3 catalogue (Morrissey et al. 2007). For all but a few objects the galaxy is located at the centre of the field of view. Exceptions to this are M83 where a bright star to the north-east required repositioning of the field, and NGC 4625, where the field was shifted to include both 4625 and its companion 4618. The GALEX satellite boasts an impressive circular field of view and a pixel scale of . The two GALEX bands are centred at 1516 Å (FUV) and 2267 Å (NUV), with bandpass widths of 269 Å and 616 Å FWHM. The spatial resolutions are approximately and in the FUV and NUV bands, respectively (Morrissey et al. 2007). Typical integration times for the NGS were s, one orbit time for GALEX. The observing time yielded limiting sensitivities of 26.6 (26.8) AB mag for the FUV (NUV), or 27.5 (27.6) AB mag arcsec-2, expressed in units of surface brightness evaluated at the scale of the point-spread function. We used the background maps provided with the images as a first order background subtraction on each field; the typical background levels in the GALEX images are approximately 10-4 counts per second for the FUV and 10-3 for the NUV, corresponding to surface brightnesses of ergs s-1 cm-2 Å-1 in the FUV and ergs s-1 cm-2 Å-1 in the NUV.
2.3 H Data
For most of the galaxies in our sample archival narrowband imaging in the H [NII] emission lines was obtained from the SINGS survey. These data were obtained using CCD imagers on the 2.1 m telescope at Kitt Peak National Observatory or the 1.5 m telescope at Cerro Tololo Interamerican Observatory. Corresponding imaging in the band was used for subtraction of underlying stellar continuum emission. Details of the observing parameters and reduction procedures can be found in the online documentation accompanying the SINGS data products.
For M83 we used new narrowband and -band imaging of the galaxy obtained with the 90Prime imager on the Steward Observatory Bok 2.3 m telescope (Williams et al. 2004). The instrument images a field 1.16 1.16 degrees, using four 4096 4097 element CCD detectors with a pixel scale of 0.45 arcsec. A series of dithered exposures was obtained to over a contiguous 1-degree field with an effective exposure time of 75 m in H, using a filter with bandpass 7 nm centered at 658 nm. A shorter set of matching exposures with a Kron-Cousins -band filter was used to provide continuum subtraction. Similarly NGC 4625 was observed with the same imager, but since this galaxy easily fit into one of the CCD fields (30 arcmin square) we used only one of the detectors for those observations. Observations were calibrated using imaging of spectrophotometric standard stars, and also checked using independently calibrated H imaging of the galaxies from Kennicutt et al. (2008).
All of our narrowband observations included emission contributions from H as well as the forbidden lines of [NII]6548,6583. We have chosen to perform our analysis in terms of the combined H + [NII] fluxes, because our primary interest in this paper is in the outer star-forming discs, where the [NII] emission is expected to be weak (0.01 [NII]/H 0.2), and Hence the line emission in these regions should be dominated by H. This assumption is confirmed in spectra of HII regions in the extended disc of M83 (Bresolin et al., 2009), in which [NII]/H typically ranges from 0.12 to 0.3 and NGC 4625 (Gil de Paz et al., 2007b) which has values between 0.05 - 0.15. Ferguson et al. (1998) also took spectra of HII in the extended discs of several galaxies, in particular NGC628 where the [NII]/H ratio drops from 0.4 in the inner disc to 0.06 in the most distant HII region. van Zee et al. (1998) reports similar ratios in a sample of HII regions from the inner discs of mostly spiral face-on galaxies. Our alternative choice would have been to apply a mean correction for [NII] emission (e.g., Appendices 1 and 2 of Kennicutt et al. 2008), but since the integrated [NII]/H ratio of the galaxy is dominated by the metal-rich inner discs, where the [NII] emission is much stronger, this would cause the H fluxes of the outer disc regions to be systematically underestimated. Rather than introduce such systematic errors we have chosen to present the observed H + [NII] fluxes instead.
3 Data Processing & Analysis
Throughout this study we have used Source Extractor (Bertin & Arnouts, 1996) to estimate non-uniform background variations and to define and select sources inside and outside the disc.
3.1 Processing of GALEX Images
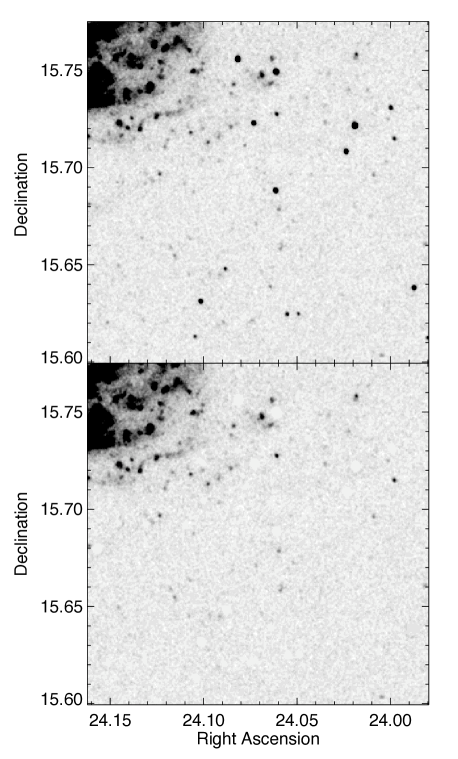
SExtractor was first used to define a master catalogue of objects based on detections from the NUV image, against which detected sources were subsequently matched from the FUV and H images. Both GALEX bands are broad, and thus we expect significant contamination from background galaxies and foreground stars. Fortunately for this study we are primarily interested in young stellar knots with relatively blue UV colors ((FUV - NUV 1), and the low dust contents of the outer discs mean that heavily reddened clusters should be rare. Consequently we excluded as a likely foreground or background contaminant all objects in the outer discs with FUV - NUV 1.5 mag. This removed more than 98% of the foreground stars. This process did not completely remove background sources, however, as can be seen in Figure 1 which shows the south west quadrant of NGC 628 in the NUV both before treatment (top panel) and after (bottom). The spatial distribution of such objects is expected to be homogeneous across each field, and we applied a statistical correction for these in our radial profiles by fitting a constant residual background at very large radii, beyond the UV and HI extents of the discs. We discuss this further in Section 3.5.
3.2 Processing of H images
Contamination from background objects was less problematic for the narrowband H observations, but foreground star contamination is significant. Most starlight is removed in the continuum subtraction process, but residual flux is often present because of variations in stellar colors and mismatches in the point spread function between the narrowband and R-band exposures. Stars were distinguished from HII regions based on their H/R flux ratios, and were masked out with the local background value as determined by SExtractor. This technique results in the removal of of foreground stars, any obvious remaining stars were removed by hand.
3.3 Source Identification & Photometry
Several factors complicate the association of individual UV-emitting regions with HII regions in the outer discs. First, the UV images have lower resolution () compared to the H images () and have a larger pixel size () compared to the H images (). Second, UV light traces a larger proportion of the stellar mass function. In low mass star clusters where we expect few ionising stars, the UV emission is expected to be larger and more diffuse than the H emission; in extreme cases one can find individual UV regions which are associated with several distinct HII objects (also see Gil de Paz et al. (2005)). Third, several earlier studies have shown that many UV knots in the extended disc do not have associated HII regions (Gil de Paz et al., 2005; Thilker et al., 2005; Zaritsky & Christlein, 2007). With these consideration in mind it is unwise to use H images for primary object identification, we have used the catalogue of UV objects produced by SExtractor. This catalogue was created using the FUV and NUV images in the dual image mode of SExtractor. We measured isophotal fluxes, which uses an aperture calculated based on pixels above the threshold detection limit. Although this method may not be the most accurate as it involves no aperture correction, it does allow us to measure the total flux defined by the same area for both UV and H images.
Using this catalogue of UV objects we search for corresponding objects in the H images that occupy the same area. Fluxes were measured from each area covered by all UV objects and statistically compared to background levels in order to detect HII regions. Only objects with H fluxes measured to better than were recorded as detections. It should be noted that no attempt was made to determine how many HII regions corresponded to each individual UV object, we have only attempted to compare total fluxes of these star forming regions.
We treated detections within the inner discs of the galaxies (R R25) in the same manner, i.e., by using the NUV image to define the spatial extent of the star forming region, and measuring the H flux under the same area. In many of the galaxies in our sample the crowding of UV sources and HII regions was such that several physical star clusters and/or HII regions were blended at the resolution of the GALEX images. Since our primary interest is in the properties of the extended outer discs this blending is unimportant for most applications. However we will need to take this blending into account later when comparing the fluxes of regions in the inner and outer discs.
3.4 Surface Photometry & Radial Profiles
Radial profiles in both far-ultraviolet and H have been computed for all galaxies in our sample. Most previous studies have been based on areal surface photometry, i.e., by measuring the summed fluxes of all pixels in radial annuli, and computing an average surface brightness (after background subtraction) as a function of radius. However this method is susceptible to uncertainties when applied in the low surface brightness outer discs, especially in H, due to background noise, contaminants, and larger-scale background variations, because only a tiny fraction of image pixels contain HII regions (Martin & Kennicutt, 2001). To circumvent these problems we also derived radial fluxes by summing the fluxes of objects detected by SExtractor for each radial bin. This latter method has the disadvantage of being prone to to missing very faint and diffuse regions, so we measured UV and H radial profiles using both methods and evaluted the results.
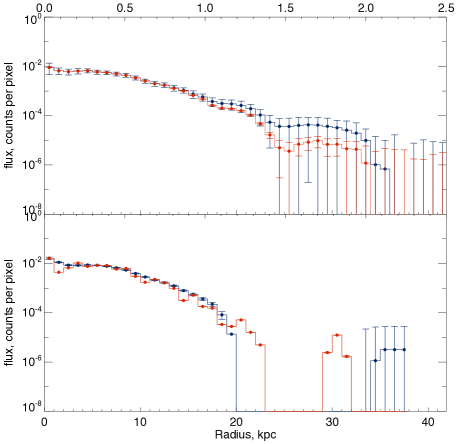
Figure 2 shows FUV and H profiles for the galaxy NGC 628 calculated using both methods. Blue lines show the profiles measured from areal surface photometry, while red profiles were derived from photometry of individual sources. Within a radius of R25 (17kpc) we find there is no discernible difference in profiles between the two methods in either H or FUV (our SeXtractor apertures were defined in such a way as to include the diffuse component of the inner disc). Similar results were seen for all galaxies in our sample.
Beyond the edge of the main star-forming disc differences between the two methods become apparent. In the FUV (top panel of Figure 2) the profiles obtained using both methods show a small turnover at 1.4 R25 with an extended UV disc extending out to 2 R25. However the surface brightness measured in the surface photometry is approximately twice as high relative to the profile from resolved UV knots. Inspection of our image shows that much of the excess emission can be attributed to diffuse FUV emission that is not included in the source photometry measurements.
The areal surface photometry is much more problematic for H, as illustrated in the bottom panel of Figure 2. Qualitatively the profiles derived from the two methods are consistent, but the areal photometry misses a faint extension of the main star forming disc at 1.4 R25 and a faint outer HII region spiral arm near 1.9 R25, as well as producing a spurious feature (albeit with only 1- significance) at larger radii. All of these reflect a limiting surface brightness (mainly caused by background variations in the processes images) that precludes the accurate detection or and measurement of star formation beyond the main, high surface brightness disc. For H the source photometry is clearly superior. For the remainder of this paper we use areal FUV surface photometry to remove the possibility of missing any diffuse emission, whilst the H photometry has been derived using HII region photometry, which is much more robust for those data. We have measured individual FUV profiles from source photometry in order to be able to make self-consistent comparisons with the H profiles.
3.5 Background Estimation
Many of the extended disc objects without HII regions may well be background sources not actually associated with the galaxy in question. It is important to measure the contribution of these background objects when calculating the radial profile of a galaxy or when counting the number of objects which might comprise the extended disc. The GALEX images have a large one degree field of view enabling us to sample an area well beyond even the most extended of discs. Although we mask old objects with UV colours greater than 1.5 there remained a small number of UV objects beyond the extent of the extended disc, these being suspected background contaminates. When calculating the number of UV objects beyond R25 we also count the number of objects in an annulus well beyond the edge of the suspected extended disc. Both the cumulative flux of the objects and the total number of of these objects is scaled to the area of the XUV disc to calculate the true flux of the extended disc and give a better estimate of the number of UV objects which comprise the extended disc.
In the H images foreground stars appear as over-subtracted objects and are thus easy to identify and remove. Background galaxies have H emission red-shifted out of the narrow-band filter range and rarely appear in such images. As such the number of false HII regions is tiny and so we do not correct the number of HII regions found in the XUV disc for unwanted objects.
In both the FUV and H images we subtract the background flux when making radial profiles. To accomplish this we estimate the background flux within an annulus well beyond the extent of the XUV disc. This background estimation is subtracted from all radii less than the background annulus.
3.6 Dust Extinction & Reddening
Interstellar dust attenuates the observed fluxes of star-forming regions. This attenuation is lower in the extended discs (e.g., Boissier et al. 2007), but can be large in the inner star-forming discs, especially in the ultraviolet. Since our main interests in this paper are the outer star-forming discs, where dust attenuation is low, we do not attempt to solve the rather complex and difficult problem of dust obscuration, but we do apply a first-order correction so the properties of the inner and outer discs can be compared on a consistent basis.
Following many previous authors we have estimated the extinction in our objects using the calibrated relation between UV color and extinction, with the latter measured from the ratio of total-infrared to UV flux– the IRX- relation (e.g. Heckman et al. (1995); Meurer et al. (1995, 1999); Calzetti et al. (2000); Kong et al. (2004); Panuzzo et al. (2007); Cortese et al. (2006, 2008)). Various authors have calibrated the relation in terms:
| (1) |
where the slope of the extinction curve ranges from 4.37 to 5.12 (Calzetti (2001); Seibert et al. (2005); Cortese et al. (2006); Hao (2009). The differences arise from differences in the bandpasses of the original datasets and in the galaxy populations. We have chosen to adopt a simple average of these slopes, giving a value ; none of the conclusions of this analysis are sensitive to this choice within the range of values given above. The zeropoint colour depends on the average age of the regions of interest. As discussed below we estimate our extinction corrections using background-subtracted measurements of resolved UV knots which dominate the integrated UV emission.. For the range of ages of these regions (0–100 Myr) evolutionary synthesis models predict corresponding colours in the range (see Section 5 and Figure 9). For simplicity we adopt a mean colour for unreddened young clusters of
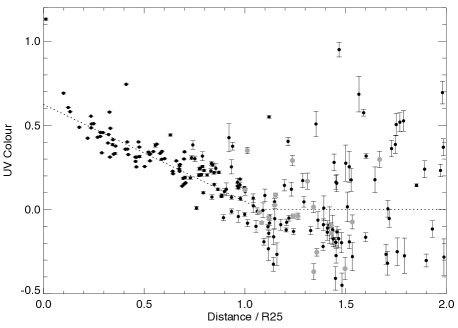
It is unrealistic to apply individual attenuation corrections to each individual UV knot or HII region, because the photometry is not accurate enough, and the colors of the regions are influenced by variations in age and dust geometry. Instead we chose to derive a mean correction as a function of galactocentric radius, as is illustred in Figure 3. For most of the galaxies in our sample the UV regions show a smooth gradient in colour with radius within , and we fitted this to derive a mean attenuation profile. Colours for objects in the extended disc generally did not show such a radial trend; objects associated with HII regions show colors consistent with those of unreddened young clusters, and this implies that the other UV sources were either older (and hence unreddened) clusters or background objects. Consequently we applied no dust corrections beyond the radius where the linear fit above crossed the zeropoint colour . The values for the extended disc were close to zero and for the majority of galaxy this resulted in no dust correction being necessary for these objects. Figure 3 shows the UV colour as a function of radius for the galaxy NGC 3198, there is a strong linear relation in the inner disc. Although the scatter of objects in the extended disc is large the average colour is close to zero. In a few galaxies no discernable colour gradient was apparent in the inner disc, and in those cases we simply derived the mean colour of the young clusters and applied a single average attenuation correction, using equation (1) above.
To estimate the attenuation in the H waveband we applied the relation given by Calzetti (2001) between the extinction in the UV continuum and the Balmer line emission as shown in equation 2.
| (2) |
The resulting disc-averaged extinction corrections for our sample range over 0–2.3 mag in the FUV and 0–1.3 mag in H.
We have used the UV colour to estimate the dust extinction but it would also have been possible to make this calculation using the IR to UV ratio. We have not attempted this in this study, because the SINGS MIPS images are not sensitive enough to detect most of the regions in the outer discs. However a recent study by Muñoz-Mateos et al. (2009) produced attenuation profiles for SINGS galaxies based on the IR/UV ratio. We used these attenuation profiles as a validation check for our method, re-calcualting the FUV and H flux of the extended disc as a fraction of the inner disc flux based on these new attenuation profiles.
Using the Muñoz-Mateos et al. (2009) attenuation curves we were able to make comparisons for 14 galaxies in our sample. Nine of these gave consistent answers between the two methods. For 4 galaxies (NGC 1566, 2841, 3198, 3351) we obtained higher fractions for both the FUV and Ha fluxes of the XUV disc using the IR/UV derived attenuation curves. This is primarily due to the high attenuation close to and beyond R25 in the Muñoz-Mateos et al. (2009) sample. The UV colours of objects beyond R25 in our sample tend to be close to zero indicating little dust extinction, an assumption confirmed by observations of the Balmer decrement of HII regions in the outer disc of M83 (Bresolin et al., 2009). We re-calculated the fractions for these 4 galaxies using the Muñoz-Mateos et al. (2009) attenuation curves but assumed an attenuation of zero beyond R25, this resulted in very similar numbers to those obtained using the UV colours.
There was one galaxy displayed different results, NGC 628. Using the UV colours we calculated a FUV flux fraction of 1.07% compared to the inner-disc and 1.68% for the H fraction. Using the IR/UV attenuation curves these fractions became 4.79% in the FUV and 1.65% in the H. The agreement was improved by assuming zero attenuation beyond R25, 2.71% in the FUV and Ha: 1.20% in the H. We have not published these fractions in Table 2 as most fractions are very similar, we report the fractions for NGC 628 here as an example of how different measures of the dust extinction may influence our results in the most extreme cases.
4 Results
4.1 Classification of Extended Discs
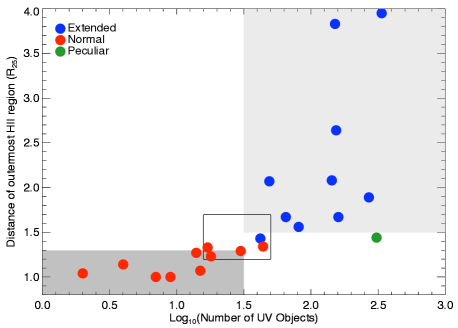
Before we analyze the properties of the discs and their star-forming regions in detail it is useful to examine qualitatively the nature and range in properties of the extended discs in our sample. We began by classifying each of the UV discs as either normal (with a prominent radial truncation in star formation and few if any star-forming regions at larger radii) or extended (star formation extending well beyond the main inner disc, with or without any turnover in emission near R25). The first galaxies identified with extended UV regions (M83 Thilker et al. (2005) and NGC 4625 Gil de Paz et al. (2007b)) are the prototypes of this class. It was quite straightforward to classify the discs as either normal or extended based on visual inspection, and this subdivision is confirmed by comparisons of quantitative measurements. For example Figure 4 plots the radial extents of the discs (the radius of the most distant UV knot, in units of R25) against the number of UV regions located at R R25). Galaxies with more than 30 such regions show star formation extending out to 1.5 R25 or further. Galaxies displaying few associated UV objects have a very limited distribution and are often found close to the parent galaxy. We have adopted these limits, indicated by the shaded regions in Figure 4, as distinguishing extended and normal UV discs. Of course this distinction is somewhat arbitrary, and a few galaxies are found between these regions (we classified those based on visual inspection). However a similar bifurcation of the sample is seen when we compare other properties of the discs, for example the radial extents correlated with the fraction of total star formation in the outer discs. As can be seen in Figure 4 our sample is roughly equally divided between galaxies with normal and extended UV discs. One galaxy in the sample, NGC 1291 has rather unique properties, and is discussed separately in Section 4.4.
4.2 Radial Profiles
We now wish to examine the radial profiles of our larger sample in the context of two key questions: (1) How extended is the star formation traced in the UV?; and (2) How closely do the UV and H emission profiles track each other? A large range of radial profiles is seen in the UV discs and the H discs, and sometimes these behaviours are coupled and sometimes they are not.
We have summarised the general trend of all the radial profiles studied in coloumn (12) of table 2. We have characterised separately the behaviours of the FUV profiles and H profiles, separated by a dash. We subdivide the profiles into two general types, those with a smoothly declining profile (Sm), and those with a truncation (Tr). We classify 12 galaxies as having a smooth (Sm) FUV profile, three as truncated at or near to R25 (Tr) and four as truncated at some point beyond R25 (tr∗). Table 2 also denotes the degree of correspondence between the FUV and H profiles. We note that 9 galaxies have H profiles which match and trace the FUV profile, and these are denoted with the prefix (Ma). For two galaxies (NGC 1291, NGC 1512) the profiles are too erratic to be defined as smooth or having a single truncation, and these are left as undefined (Un) and will be discussed separately.
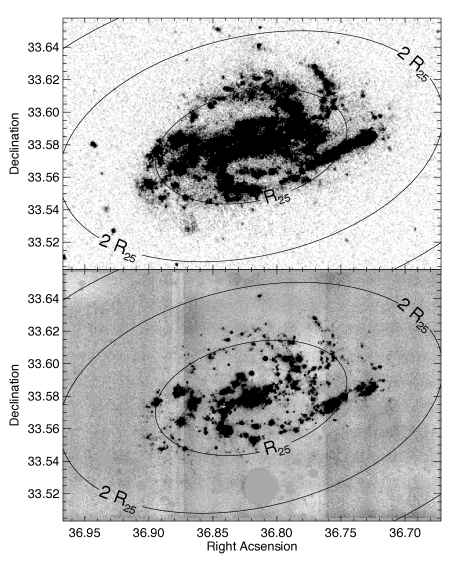
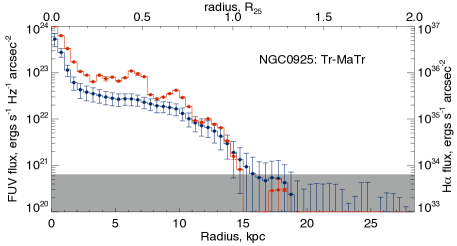
Not surprisingly these disc profile types are closely related in some (but not all) cases to our earlier classification of the discs as normal or extended. All of the normal galaxies display a clear turnover in the H radial profiles near the R25 radius. In these galaxies the FUV radial profile also closesly traces the H profile, with a significant drop in emission at the radius of the H truncation. However the UV profiles tend to be less sharply truncated than their H counterparts. Figure 5 shows the profile of NGC 925, a galaxy we have classed as having a truncated profile in both the FUV and H (Tr-MaTr). The top and middle panels show FUV and H images with the radial scale indicated, while the bottom panel shows the respective radial profiles. A pronounced turnover in the H profile (red curve) is apparent near R25 (note the logarithmic surface brightness scale). The FUV profile (blue points) shows a similar although less pronounced feature at the same radius. The same correspondence can be seen by comparing the images in the upper two panels.
The presence of strong radial turnovers in the the normal discs does not mean that star-forming regions are entirely absent. As seen in Figure 4 and Table 2 regions are often found extending well beyond R25. These can occur as isolated regions or as extended regions of star formation. For example NGC 3521 display a faint spur of star formation to the north and NGC 3351 shows a few objects to the south-east. However the total amount of UV emission located beyond R25 in these galaxies is always 2%, this is discussed further in section 4.5.
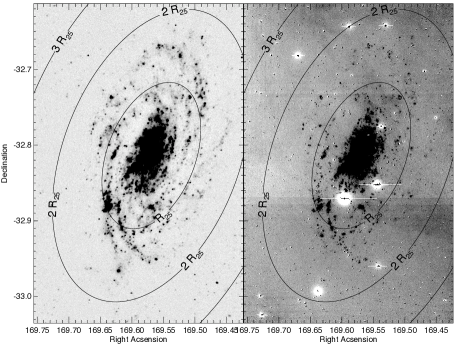
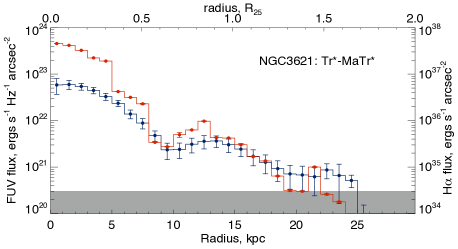
We identified ten galaxies from our sample as having an extended ultraviolet disc, including eight which were also identified by Thilker et al. (2007) as having a Type 1 extended disc (the others are NGC 1097 and NGC 1566). The radial profiles of these discs exhibit a much broader range of behaviour than in the normal discs. Six out of the ten extended galaxies show emission in both the UV and H profiles well beyond R25. One of of these galaxies, NGC 3621, is shown in figure 6. The FUV image in the top left panel shows emission extending to 1.7 R25, and this behavior is traced closely in H, as shown in the top right and bottom panels. Both the UV and H profiles decline smoothly with no indication of a star forming threshold close to R25. Overall the H profile is somewhat steeper than in the FUV, but most if not all of this can be attributed to higher UV extinction in the inner disc. There are hints as well for a systematically higher UV emission in the outermost region of the disc, which is consistent with what is observed in many of the normal discs. In the case of NGC 3621 we do see a truncation in both the UV and H profiles but at a radius of 1.7 R25, clearly in this case the optical ’edge’ does not correspond with the extent of recent star formation. Other examples of galaxies in this sample with extended but matched FUV and H profiles include NGC 628, NGC 1512, NGC 1566, NGC 3198, and NGC 5474. The distinction between these galaxies and normal discs is their radial extent of star formation and a tendency in some cases for the ratio of UV/H emission to be somewhat higher in the outer discs. In NGC 1512, for example, the enormous radial extent to the star formation is the result of a strong tidal interaction that has produced long tidal arms. The UV and H properties of these arms are indistinguishable from those of the inner disc; the low surface brightnesses in azimuthally averaged radial profiles are purely a product of the geometry of the spiral structure, not of the physics of star formation.
Four of the extended galaxies in our sample exhibit a smooth FUV profile extending well beyond the truncated edge of the H disc, as reported by Thilker et al. (2005) for M83; we have classed these galaxies as (Sm-Tr) in table 2. Figure 7 shows images and radial profiles for the Sb galaxy NGC 2841. The SFR throughout this galaxy is quite low, and by the gravitational stability criteria of Kennicutt (1989) and Martin & Kennicutt (2001) the entire disc should be subcritical (below threshold). Nevertheless the H radial profile shows a turnover near R25, with only a few scattered HII regions present beyond that radius. In contrast the FUV profile shows no sign of truncation out to twice the optical radius, though a falloff in surface brightness near the edge of the H disc is visible. Inspection of the FUV image shows that the extended disk emission consists 40 discrete knots, along with a very substantial contribution from diffuse emission. XUV-discs have been shown to display a combination of discrete knots and diffuse emission. Thilker et al. (2007) goes as far as specifying two types of XUV-disc; Type 1 disc with bright UV regions, and Type 2 with more diffuse areas of UV emission. Other galaxies in our sample showing this behaviour include NGC 1097 and the two well-known prototypes, M83 and NGC 4625.
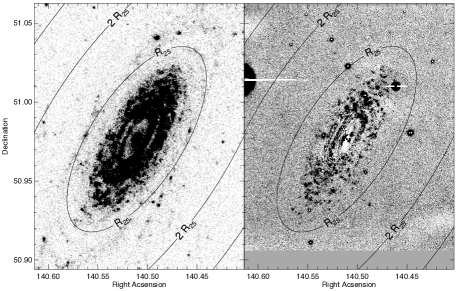
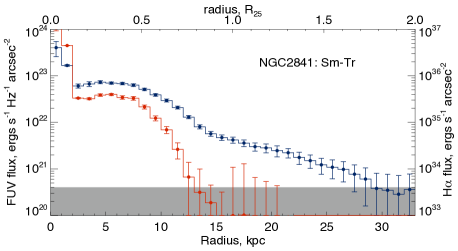
, contours indicate multiples of the optical radius R25. Bottom panel shows the surface photometry for NGC 2841, H emission is shown in red and FUV shown in blue.
4.3 The Effects of Azimuthal Averaging
The interpretation of the radial profiles is often influenced significantly by the azimuthal averaging. As pointed out by Martin & Kennicutt (2001), the radial behaviour of the star formation often varies strongly as a function of azimuth, with regions showing strong radial truncations and others showing an extended transition (or no transition at all). Geometric distortions introduced by spiral arms or lopsidedness can also cause truncations to be blurred and smoothed out in azimuthally averaged data. For each galaxy in our sample surface photometry was always accompanied by visual inspection of the images to ensure all features presented by the photometry were visible in the images.
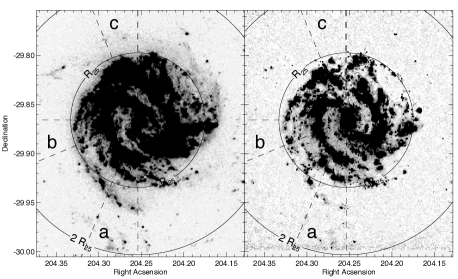
As an example of how galaxy asymmetries can affect the truncation radius Figure 8 shows the FUV and H images of the prototype XUV galaxy M83 in the top panel; below this are 3 the average counts per pixel as a function of radius for 3 segments as labelled in the images. We have also shown a profile for the average of all the azimuthal segments shown as the top plot in the bottom panel of Figure 8. Along some axes, for example segment A in Figure 8 shows a segment in which a spiral arm extends beyond R25, this is reflected in both FUV and H profiles which trace emission out to 1.5 R25 in both cases. In fact the profile of segment A is remarkably similar to that of the complete profile. However the same is not true for segments B and C, both of these segments show a steep truncation in the H profile close to R25. The extent of the FUV also varies in both these segments, from 1R25 in segment B to around 1.3 in segment C. Apart from an isolated HII region in segment B there is no emission beyond the truncation in either the H or FUV for either of these segments, a feature which is lost in the combined profile. The loss of such features due to an asymmetric galactic distribution is not new and was first reported by van der Kruit (1988).
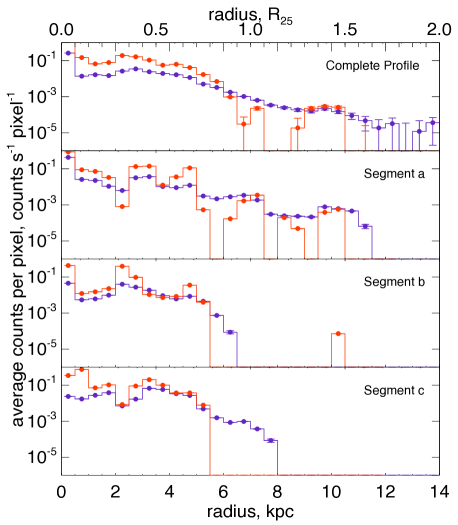
When all of the profiles from individual segments were averaged to create the ’Complete Profile’ shown in figure 8 the typical sharp truncation in the H is largely preserved, while the FUV profile is smoothed into such an extended transition radially that little turnover is observed at the same radius. This is produced by a combination of effects, the presence of UV arms and features outside of the main turnover in HII regions, as well as azimuthal asymmetry in the galaxy, which also tends to smooth the UV transitions together.
4.4 A Note on NGC 1291
We have classed NGC 1291 as Peculiar in table 2 this is because of the unusual morphology of the galaxy. NGC 1291 contains a bright central disc and bulge with little or no star formation, but a faint ring of star forming regions visible both in the UV and H. The definition of the optical radius R25 for this galaxy is based predominantly on the bright central bulge. This results in the R25 edge bisecting the faint ring ring of star formation, so the the distinction between “inner” and “outer” discs is superficial. NGC 1291 is an example of a population of S0 and Sa galaxies (including many barred galaxies) with extended low surface density HI discs (van Driel et al., 1988; van Driel & van Woerden, 1989) and low levels of star formation (Caldwell et al., 1991, 1994). In this respect NGC 1291 can be regarded as a galaxy in which all of the star formation is taking place in an extended UV disc. Within this ring the radial profiles in the UV and H are very similar. This galaxies serves as an example of how the optical measure of the the extent of a galaxy (R25) can be unreliable when used to define edge of the star forming region. Star forming regions present in the ring with H emission appear to have a masses in the range M☉ and ages less than 10 Myr.
4.5 Integrated Properties of XUV Discs
Table 2 summarizes the most relevant properties of the extended discs of our galaxies. These include the disc classifications as described in Sections 4.1 and 4.2, the number of detected UV knots and HII regions along with the corresponding detection limits, the radii of the most distant detected HII regions, and the fractions of total UV and H luminosity contributed by the extended discs (), expressed as a percentage. Two sets of the latter numbers are listed, those as observed and after correcting for dust attenuation.
HII regions outside of R25 are found in 19 of the 21 galaxies in our sample, and UV knots beyond R25 were found in all of them, although it is possible that a small fraction of the latter are background contaminants (Section 3.1). There is a pronounced difference in the average number of objects detected in both UV and H in the extended disc between galaxies classed as normal and those classed as extended, objects compared to objects, respectively. These differences are also reflected in the fractions of star formation located in the outer discs. These fractions vary over more than two orders of magnitude, ranging from less than 1% (after dust corrections) for NGC 925, NGC 4321, NGC 5194 (M51), and (most notably) M83 to 10–35% in NGC 1512, NGC 3621, and NGC 4625 (as discussed earlier NGC 1291 is a special case). As expected there is a strong tendency for galaxies with extended discs to have larger fractions of star formation located outside of R25, with an average fraction of 6% compared to 1% in the normal discs. However there are pronounced exceptions; some of the most extended discs in our sample, such as M83 and NGC 2841, contribute less than 1% of the total star formation in the respective galaxies. The observed UV light fractions, before correcting for extinction, are much higher, averaging 23% for the extended discs and 2.3% for the normal discs, but these are influenced by the strong dust attenuation in the inner discs.
Inspection of Table 2 also shows that the fraction of H emission contributed by the outer discs is significantly lower on average than the corresponding FUV fractions, even after correcting for dust attenuation at both wavelengths. The median H fraction is 2.5 times lower than the corresponding FUV fraction, a result that is consistent with the original studies of Thilker et al. (2005) and Gil de Paz et al. (2005) for M83 and NGC 4625. Part of this difference arises from the different methods used to measure the outer disc profiles in the UV and H; since the latter were based on photometry of individual HII regions faint sources and diffuse emission were not included. We can estimate the magnitude of this bias by comparing the FUV profiles measured using full-area surface photometry (given in Table 2) and photometry of the resolved UV knots. On average the latter are lower by a factor of 1.08, accounting for part of the differences in FUV and H fractions. The remaining difference (approximately a factor of 2.3), probably reflects an intrinsic change in the FUV/H flux ratio between the inner and outer discs. We discuss this further after we examine the UV and H properties of the individual HII regions and UV knots in the galaxies.
4.6 Properties of Star Forming Regions
These same data provide valuable information on the properties of the individual star forming regions which make up the extended discs. The H fluxes of the HII regions found in the extended discs range from to ergs s-1. For the most distant galaxies, we are unable to detect the faintest regions, but for galaxies with distance Mpc we are able to detect regions with H fluxes corresponding to the ionizing flux a single B0 type star, the lowest mass star expected to produce significant ionizing radiation (Vacca et al., 1996). In regions where both UV and H emission is detected, the corresponding range in FUV fluxes is found to be to ergs s-1 Hz-1. These are 10 to 1000 times larger than expected for single ionising O-type stars, which confirms the presence of large numbers of lower-mass B-type stars in the associated star clusters.
The fraction of UV clusters which exhibit H emission varies somewhat among the galaxies, as shown in column (4) of Table 2. However the mean fraction is similar for galaxies with extended discs (%) and normal discs (%), and does not appear to correlate systematically with any property of the galaxies, apart perhaps from the depth of the photometry (with a higher fraction of HII regions at higher luminosities, as might be expected).
| NGC | No. of UV | No. with H | % of objects | Limiting Disc Flux (log) | Extended Disc Flux (%) | Dist of furthest | Class | Profile | ||||
|---|---|---|---|---|---|---|---|---|---|---|---|---|
| Objects | Emission | with H | FUV | H | Observed | Dust Corrected | HII region | UV - H | ||||
| FUV | H | FUV | H | (R25) | ||||||||
| (1) | (2) | (3) | (4) | (5) | (6) | (7) | (8) | (9) | (10) | (11) | (12) | |
| 628 | 160 | 60 | 37.5 | 1.67 | Extended | Tr∗ - Tr∗ | ||||||
| 925 | 18 | 6 | 33.3 | 1.23 | Normal | Tr - MaTr | ||||||
| 1097 | 81 | 21 | 25.9 | 1.56 | Extended | Sm - Tr | ||||||
| 1291 | 308 | 129 | 41.9 | - | - | - | Peculiar | Un - Un | ||||
| 1512 | 154 | 74 | 48.1 | 2.64 | Extended | Un - MaUn | ||||||
| 1566 | 143 | 82 | 57.3 | 2.08 | Extended | Tr∗ - MaTr∗ | ||||||
| 2841 | 42 | 11 | 26.2 | 1.43 | Extended | Sm - Tr | ||||||
| 3198 | 65 | 19 | 29.2 | 1.67 | Extended | Sm - MaSm | ||||||
| 3351 | 44 | 23 | 52.3 | 1.34 | Normal | Sm - Tr | ||||||
| 3521 | 14 | 1 | 7.1 | 1.27 | Normal | Sm - Tr | ||||||
| 3621 | 270 | 175 | 64.8 | 1.89 | Extended | Tr∗ - MaTr∗ | ||||||
| 4321 | 30 | 3 | 10.0 | 1.29 | Normal | Sm - Tr | ||||||
| 4536 | 7 | 0 | - | - | - | - | - | Normal | Tr - MaTr | |||
| 4579 | 9 | 0 | - | - | - | - | - | Normal | Sm - Tr | |||
| 4625 | 151 | 49 | 32.5 | 3.83 | Extended | Sm - Tr | ||||||
| 5194 | 17 | 9 | 52.9 | 1.33 | Normal | Sm - Tr | ||||||
| 5236 | 336 | 122 | 36.3 | 3.95 | Extended | Sm - Tr | ||||||
| 5398 | 4 | 1 | 25.0 | 1.14 | Normal | Sm - Tr | ||||||
| 5474 | 49 | 24 | 49.0 | 2.07 | Extended | Tr∗ - MaTr∗ | ||||||
| 7552 | 2 | 2 | 100.0 | 1.04 | Normal | Tr - MaTr | ||||||
| 7793 | 15 | 9 | 60.0 | 1.07 | Normal | Sm -MaSm | ||||||
(1) Number of UV objects associated with the galaxy in beyond R25. (2) Number of UV found to have associated HII regions beyond R25. (3) The percentage of UV objects beyond R25 which have associated H emission. (4) & (5) show the fluxes for the faintest object detected in the extended disc for FUV and H wavebands respectively in units of log(ergs s-1 Hz-1) and log(ergs s-1). (6) & (7) flux of the extended disc as a percentage of the inner disc flux in the FUV and H respectively before any correction for dust, (8) & (9) show the same but after we corrected for dust. (10) Distance of the further most HII region in terms of the optical radius (R25). (11) The classification we have applied to the galaxy to distinguish between those galaxies with an extended UV disc (extended) and those without (normal). (12) Summarises the surface photometry profiles in FUV and Hrespectively. Sm denotes a smoothly declining profile; Tr indicates a truncation at or near to R25; Tr*, a truncation well beyond R25; Ma, indicates the H profile closely resembles the FUV profile; Un, denotes an undefined profile.
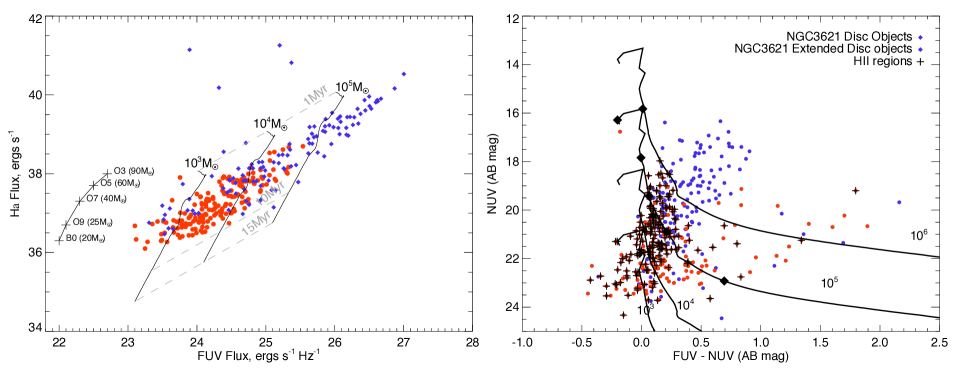
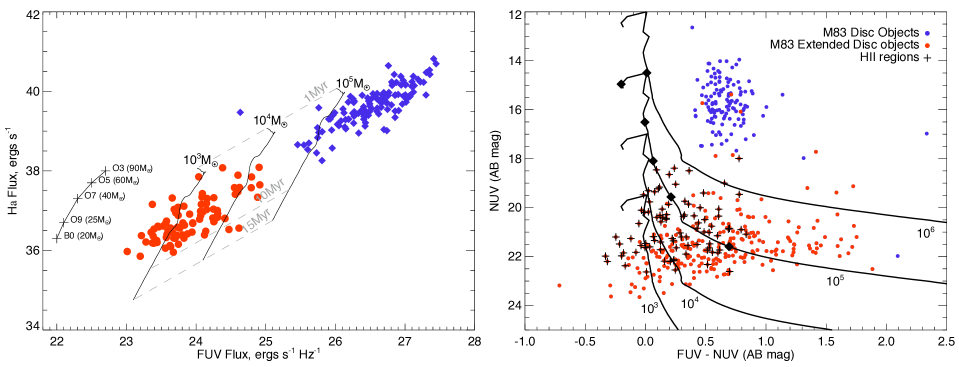
Following Gil de Paz et al. (2005) we compare in Figure 9 the H and FUV fluxes of the star forming regions for two galaxies with especially extended discs, NGC 3621 (top left panel) and M83 (bottom left panel). Red points represent HII regions identified in the extended discs, while blue points denote comparison HII regions in the inner star-forming discs (R R25). The fluxes have been corrected for dust attenuation following the method described in Section 3.5. We also have generated a grid of synthesis models for young star clusters using the Starburst99 code, these models assume a Salpeter IMF with a stellar mass range of M☉ and solar metalicity, and for ages of 0 15 Myr. These models are superimposed on the data in Figure 9, with lines of constant age and constant cluster mass indicated. Finally we show the expected H and FUV luminosities of single main sequence stars of spectral types B0 to O3 ( M☉). The offset of the points from the single-star models illustrates the strong contribution to the FUV flux from lower-mass stars.
As expected the FUV and H fluxes of the HII regions are consistent with stellar populations with ages less than 10 Myr, which is consistent with the main sequence lifetimes of the ionizing stars. In general terms clusters detected beyond the edge of the optical disc (R25) appear to be lower in mass compared to objects identified in the inner disc. The mass range of detected objects varies form galaxy to galaxy, with a lower limit around 100M☉and an upper limit of M☉, while the masses of the brightest star-forming complexes in the inner discs are of order 106 M☉. These differences do not necessarily imply a physical difference in the cluster populations, rather the higher luminosities of the brightest clusters in the inner discs could reflect the crowding of regions there (many of the objects identified by SeXtractor are composites of many clusters and HII regions), and the larger total populations of objects in those regions. We examine this question in more detail later.
The results shown so far only apply to the youngest UV knots that coincide with HII regions, and it is instructive to examine the properties of all of the UV sources in the extended discs. For this we have constructed UV colour-magnitude diagrams, as shown in the right hand panels of Figure 9. In this case the fluxes are not corrected for dust extinction. Superimposed on these diagrams are the same grid of synthesis models for cluster masses of M☉, and ages (indicated by black diamonds) of 1, 3, 10, 30, 100, and 300 Myr. The extinction effects are apparent from the colours of the inner disc objects (blue points). All of these objects are associated with HII regions so we expect them to be relatively young and bright, the displacement of the objects from the model curves can be attributed to reddening and extinction. The effect of dust on the HII regions in the extended discs (black crosses) is much lower, as is the case for the UV-only clusters in the outer discs (red points). In M83 there are also a large number of UV clusters in the extended disc with relatively red colors. Due to the low column densities of gas and dust in the extreme outer discs dust reddening is unlikely to be significant, so the red colors of these objects probably reflect older ages (30–300 Myr), consistent with the conclusions of Zaritsky & Christlein (2007). Precise age dating of these clusters is not possible however, because of the degeneracy between dust extinction and age.
The galaxies NGC 3621 and M83 were chosen for Figure 9 because they represent two extremes in the overlap of properties of HII regions and UV clusters in the inner and outer discs. In NGC 3621 (top panels) the two populations appear to overlap in luminosities, and are almost indistinguishable, apart from the slightly higher upper mass limit of the inner disc regions. This similarity in properties tends to be the norm for galaxies with normal discs, and also applies to some of the other galaxies with extended discs including NGC 1097, NGC 1512, NGC 1566, and NGC 3198. In contrast to this behaviour, the regions detected in the extended disc of M83, which extends out to as far as 4R25, tend to be very faint as a population, with H luminosities corresponding to the ionising outputs of single O-type stars, and cluster masses below 2000 M☉. In Figure 9 the HII regions found in the XUV dics of M83 appear to be segregated from the HII regions in the inner disc. This separation arises in part from the extremely high density of UV clusters and HII regions in the inner disc, so that the fainter regions may be blended with brighter neighbours. This confusion is not a problem in the outer discs of either galaxy, due to the sparse nature of objects and the low level of background emission. The outer disc population in M83 also shows a much lower fraction of UV regions with H emission (36.3% compared to 64.8% in NGC 3621), and a much larger range in UV colours. These observations are all consistent with a larger proportion of relatively evolved UV regions in M83 (Zaritsky & Christlein, 2007).
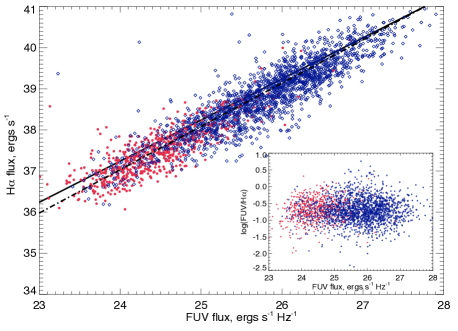
Careful examination of the left hand panels in Figure 9 also shows a systematic shift in the ratio of H to FUV fluxes between the HII regions in the inner and outer discs, with the regions in the extended discs being fainter in H (for fixed FUV luminosity) by factors of 1.9–2.6. This is reminiscent of the offset in the total fractions of H and FUV emission in the extended discs from the previous section, and previous observations of the HII regions in NGC 4625 and M83 (Gil de Paz et al., 2005, 2007b). In order to test whether this trend persists across our entire sample, figure 10 shows the relation between dust-corrected FUV and H fluxes for the approximately 2800 regions measured in all 21 galaxies. Inner disc HII regions are plotted in blue whilst HII regions found beyond R25 are shown in red. The solid black line has a slope of unity, with the ratio of FUV to H flux expected for young star forming regions with a Salpeter IMF, as described earlier. The dot-dashed black line is a least squares best fit to the points. There appears to be a continuous distribution of points in figure 10, with no marked change between the two populations of HII regions. The difference in slope between the least squares fit and a linear relation does show a progressive decrease in the ratio of H flux to FUV flux in the fainter HII regions, with a shift of 0.2 dex (factor 1.6) over the 4 orders-of-magnitude range in luminosities probed in these regions. This is similar to trends seen in the integrated fluxes of low-luminosity star-forming dwarf galaxies by Lee et al. (2009), though not nearly as severe in magnitude as measured in the dwarf galaxies. However it is interesting that this trend appears to be associated with the ionising luminosities of the HII regions, and not with their presence in the outer discs. We discuss the possible implications of this result in §5.
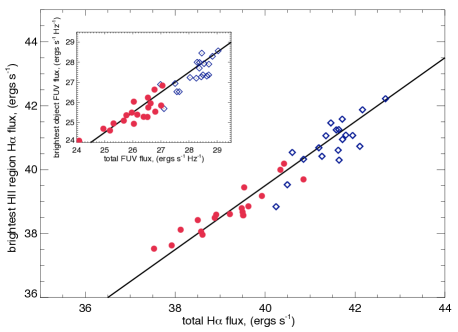
As remarked earlier the HII regions in the outer discs tend to be much fainter than the relatively prominent HII regions in the inner discs. Such a difference could arise from a physical difference in the populations of star-forming regions (i.e., a steeper cluster luminosity function), but the appearance of fainter regions could also arise from a simple size of sample effect; if the total number of regions is much smaller the brightest regions will tend to be fainter, simply because the upper limits of the luminosity function will be less populated. If the outer discs were sufficiently well populated in HII regions we could test for this latter effect directly, by comparing the luminosity functions for the inner and outer disc regions in each galaxy. However the numbers of regions in the outer discs are too low to derive reliable luminosity functions. However we can test for this effect approximately, by using the statistics of the brightest HII regions in the inner and outer discs. Kennicutt et al. (1989) have shown that HII regions approximately follow a power law luminosity function, with slope . For such a slope it is easy to show that the expected luminosity of the brightest objects in the population should scale linearly with the total size or luminosity of the population (Kennicutt et al., 1989).
In Figure 11 we compare the total H fluxes of all objects for each galaxies in the inner discs (blue points) and outer discs (red points) with the fluxes of the brightest object in each disc region. The inset panel shows the same comparison but using FUV fluxes. The solid line shows a relation with unit slope, which is the expected relation for a constant luminosity function with slope . We have not plotted points for the two galaxies with no detected HII regions beyond R25. As expected both the total fluxes and the fluxes of the brightest objects are systematically lower in the outer discs. However there appears to be no change in the ratio of these fluxes between the inner and outer discs, which argues against a strong truncation or steepening of the luminosity function in the outer discs. Within the limited statistics the two populations of regions are consistent with having been drawn from the same distribution of luminosities as the inner discs. This does not rule out the possibility of a unique population in the outer discs of specific galaxies (e.g., M83 as claimed by Thilker et al. (2005)), but for the galaxy population as a whole there is appears to be no need to invoke a peculiar luminosity function or IMF for the outer discs.
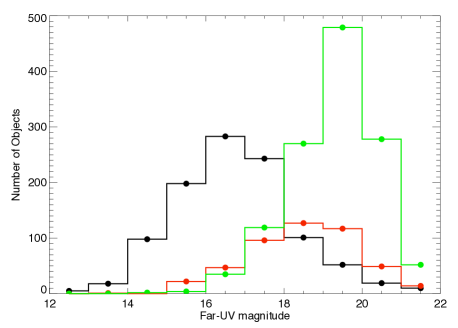
In Figure 9 we are only able to plot objects for which corresponding HII regions were identified and we might ask what are the properties of those objects without detected HII regions. Figure 12 shows the FUV fluxes for all objects detected in those galaxies we have classified as extended. Objects found in the inner disc at radii less than R25 are shown in black, objects in the extended disc found to have corresponding HII regions are in red and those in the extended disc found without HII regions in green. We find that objects found in the inner disc appear to be brighter than their counterparts in the extended disc. For objects in the extended disc with an FUV magnitude brighter than 18 mag we find equal numbers of objects with and without HII regions, however for dimmer objects we see far more objects without HII regions. This effect could be for many reasons, the lower the FUV flux the lower the predicted cluster mass and so we expect a lower H luminosity which might well be below the detection limit for the farthest galaxies. Some of the fainter UV objects might well be evolved objects with ages greater than 10Myr and so without any H emission. Objects in the extended disc might be statistically less likely to form HII regions than those in the inner disc, a point we shall discuss further in the discussion.
5 Discussion
A primary objective of this study has been to use UV and H photometry of star forming regions in a large enough sample of nearby galaxies to explore the diversity of star formation properties in their outer discs. We have found that extended star formation (defined as star formation outside of R25) is nearly ubiquitous in nearby gas-rich galaxies, and that there is an enormous diversity to the properties of these extended discs. Nearly all of the galaxies we studied have UV clusters located beyond R25, and most show at least 1 HII region found beyond this radius. In many cases these objects were found at large radii even for the galaxies classed as normal, for example NGC 5194 displays 9 HII regions in the extended disc out to a 1.33 R25. The star formation contained in these extended discs can be a significant fraction of the global star formation, but in most instances represents a modest fraction (%), after correcting for dust extinction. Much more prominent extended discs are found in specific examples including the well-studied spiral NGC 4625 and the interacting spiral NGC 1512, but they tend to be the exception rather than the rule.
It has proven rather difficult to classify galaxies as extended or not based on a single parameter, the R25 isophote may not encompass all the HII regions and some may appear outside this superficial boundary. The number of objects found in both UV and H provided a better clue as to the nature of galaxies but this can be misleading, we see some galaxies with as many as 44 possible UV objects associated to the galaxy yet not classed as extended. Identification and classification is best done with many parameters as well as visual inspection of the images. The trouble in defining a set of parameters to determine the nature of extended discs lies in the rather diverse range of properties they display.
As discussed in the introduction, observations of the extended star-forming discs may have important implications for a range of broader problems including star formation thresholds, the clustering of star formation, the IMF, and the physical origins of the discs themselves. We conclude by briefly addressing each of these topics in the light of our new results.
The apparent presence of strong radial truncations in the H discs of spirals has been used by many authors to argue for the presence of radial star formation thresholds (Kennicutt, 1989). These in turn could be be explained by the presence of a large-scale gravitational stability criterion (Safronov, 1960; Toomre, 1964), though other models have also been proposed to account for the thresolds (Elmegreen & Parravano, 1994; Schaye, 2004). However the absence of corresponding turnovers in the UV profiles of many of these galaxies has called into question the reality of the H truncations. Are thresholds relevant any longer?
Our observations suggest that the detection of extended star formation complicates what many treated previously as an overly simplified picture of star formation thresholds, but the general observation of a radial transition in star formation still holds up in most galaxies. Approximately half of the galaxies in our sample show strong radial turnovers in both H and UV emission. Although these turnovers are not always located near R25, the presence of consistent radial profiles in the UV and H is consistent with the general threshold picture. Among the remaining 10 galaxies with extended UV discs, half of those show similar profiles in the UV and H. Although there is no strong truncation radius, the UV surface brightnesses often decline by up to two orders of magnitude over a radius of a few kpc. Examination of the images shows that the extended star formation may be attributable to a variety of causes, including azimuthal asymmetries, tidal arms, or isolated regions of star formation (Martin & Kennicutt, 2001). For most of these galaxies the locations of the star-forming regions can be understood in a general picture in which the main inner H and UV discs are defined by the region where the interstellar gas is gravitationally (or thermally) unstable in nearly all locations, whilst the star formation in the outer discs is concentrated to locations where the gas disc is globally stable, but locally unstable in regions where the gas is concentrated or compressed (Kennicutt, 1989; Martin & Kennicutt, 2001; Bush et al., 2008).
The most interesting and perplexing galaxies in our sample are those which show a relatively strongly truncated H disc, but an extended disc of UV emission, with no sign of a corresponding radial truncation. These include the prototype M83 as well as NGC 1097, 2841, and 4625. In some of these galaxies a sizeable fraction of the UV clusters have faint H counterparts, confirming their young ages, but in others only a handful of clusters show H emission. This may be the result of factors such as cluster age, a low mass cluster forming without ionising stars or even a porous interstellar medium. It is difficult to distinguish between these alternatives with our photometric data alone, and further exploration is beyond the scope of this paper. However we can apply a few simple tests to rule out some of the simplest explanations.
A popular explanation for the properties of the extended UV discs has been to invoke the presence of a truncated stellar IMF in regions with low levels of star formation e.g., Meurer et al. (2009); Pflamm-Altenburg & Kroupa (2008) and references therein. In this picture the formation of the most massive stars is strongly suppressed in low-mass gas clouds, due to the limited population of the IMF. The observed H luminosities of the outer disc HII regions (typically of order ergs s-1) are consistent with many falling into the regime where the nebular ionisation is subject to small number statistics in O-type stars. However neither the numbers of stars nor the observed ratios of H to UV luminosities are consistent with the dramatic IMF change that would be required to produce radial truncations in the discs. The azimuthally-averaged H surface brightness of M83 at the inner edge of its H turnover (Figure 9) is equivalent to several tens of O6V stars per square kiloparsec, with individual HII regions typically containing tens to hundreds of such stars. This is far to high to account for a sharp radial turnover in HII regions at larger radii from statistical population effects alone. Moreover the minimal changes in the ratio of H to FUV luminosities of the HII regions are inconsistent with an IMF truncation that would sufficient to mimic a star formation threshold. Finally it is difficult to understand why the IMF mechanism would only operate in the handful of galaxies with deviant UV and H disc profiles, and yet be absent in the majority of galaxies with consistent UV and H profiles, despite their containing similar ranges of luminosities in their star clusters and HII regions. We suspect instead that the presence of extended UV emission (in the absence of similarly extended H emission) in extreme cases of XUV discs is due to a combination of the factors that have been discussed by Thilker et al. (2005); Lee et al. (2009), and others, including age, ionisation bounding effects in some HII regions, and small number statistics in the formation of ionising stars in individual clusters, and possibly a modest systematic deviation in the IMF.
Much has been made of a possible IMF truncation suggested by the UV to H ratio of dwarf galaxies (Meurer et al., 2009) and we do not attempt a full discussion of the problem here. This is however a recurring theme and Lee et al. (2009) reports a similar trend in the local volume and notes no single explanation is capable of explaining this result. Melena et al. (2009) shows the same lack of H in the outer discs of 11 dwarf irregular galaxies which is attributed to the loss of ionising photons in these regions. We do note that our sample of HII regions which have formed in the low-gas environment of XUV discs displays only a small H deficit (Figure 10). There could be several explanations for a small change; a loss of ionising photons in low density HII regions; long term low-rate star formation predicts that the the high mass end of the IMF may not be fully populated at all times; or even an effect of inaccurate dust measurements which Boselli et al. (2009) suggests might explain the trend seen by Meurer et al. (2009).
Our study can not give definitive answers as to the possible mechanisms for the formation of these extended discs. We can say that the large variety in properties which we have highlighted indicate there may be more than one possible formation mechanism. In some cases like M83 the average gas density in the outer disc may be sub-critical for star formation, yet local variations in the gas density may produce pockets in which star formation may take place as suggested by Bush et al. (2008); Dong et al. (2008). Mechanisms like this may produce HII regions with distinct properties from the inner disc, as seen in the flat and de-coupled abundance gradient of the outer disc in M83 (Bresolin et al., 2009). The outer discs of galaxies like NGC 3621 appear to be more of a continuation of the inner disc and it may simply be the case that the optical edge does not correlate with the star formation threshold and so is not a true extended disc. Investigation of the abundance gradient in galaxies like NGC 3621 might help to shed more light on this conundrum. Galaxies like NGC 4625 and NGC 1512 have obvious interactions and these may play a key part in the formation of some but not all extended discs.
6 Summary & Conclusions
Over the course of this paper we have examined 21 galaxies by comparing the H and UV fluxes of objects in both the inner disc (RR25) and the outer disc and by using detailed surface photometry in both these wavebands. We identified ten of these galaxies as having an extended ultraviolet disc and investigated the properties of this relatively new phenomenon. We have been able to quantify many of the characteristic of extended disc and compare the properties of these galaxies to those with no extended discs. Our conclusions are summarised below.
-
1.
Properties of extended discs: the galaxies in our sample show a range of properties; extended disc fluxes range in value from a few percent up to almost 50% compared to the flux of the host galaxy. We also note it is not uncommon for galaxies to have a few HII regions lying beyond the optical edge and at radii comparable to the extent of some extended discs. The number of both UV and H objects in beyond the optical edge gives a clearer distinction between galaxies classified as normal and those thought to be extended in nature. The number of UV objects found with HII regions varies as well from 26% percent to 68%, although this difference might be due to an age discrepancy of different extended discs it might also be due to the different environments associated with each galaxy.
-
2.
Star formation thresholds: although we can confirm the findings of Thilker et al. (2005) for M83 for which we see an H threshold at around R25 and no UV truncation, behaviour which is repeated for several galaxies in our sample it is not a universal rule for extended galaxies. Around half of the galaxies we have classed as extended show no threshold in either H or the FUV close to the optical edge and have a gradually declining surface brightness. This further emphasises the range of behaviour seen in extended galaxies.
-
3.
Properties of HII regions: in agreement with Gil de Paz et al. (2005); Thilker et al. (2005) the HII regions found beyond the optical edge of galaxies appear to have H fluxes consistent with single ionising stars; the UV fluxes indicate an underlying population of lower mass B-type stars. These HII regions appear to have lower than expected H luminosity compared to their inner disc counterparts. However the same data show that the H to UV ratio is similar to that for objects in the inner disc. This implies that any excess UV emission from the extended disc mainly comes from those clusters which exhibit no H emission.
-
4.
Variations in the IMF: we note that the low mass of many HII regions indicates that formation of massive stars is subject to stochastic variations. Comparison of the total flux and brightest object reveal no apparent change in the IMF between the inner and extended discs. The minimal change in the ratio of UV to H luminosities are inconsistent with an IMF truncation in the outer discs which might mimic a star formation threshold.
As more and more extended disc are studied we are beginning to see their full range of properties, such large variations might indicate that more than one mechanism is capable of inducing star formation beyond the classical edge of a spiral galaxy, be it a close interaction disturbing a near critical density gas disc, the propagation of a spiral density wave or ever more obscure mechanisms. To investigate the possible mechanisms for the formation of these extended discs further multi-wavelength analysis will be needed as well as further spectroscopic studies of HII regions to determine abundances.
Acknowledgments
Appendix A Radial Profiles
Here we show radial profiles for all galaxies within our sample, profile classifications are shown as well. Once again FUV is shown in blue and H in red. The grey shaded area shows the flux level below which we determine the FUV flux to be too low to contribute to the disc, it should be noted that due to difference scales H emission in the grey region is still reliable. Below we also list some comments on individual galaxies to highlight some of their more unique features and interesting features in the radial profiles.
-
•
NGC0628: Classified as Tr* - Tr*, the profile in both FUV and H are truncated at R25 and R25 respectively. However there are few HII regions found scattered beyond the H truncation.
-
•
NGC0925: Although classified as having a truncated profile in both FUV and H (Tr-MaTr), there is some evidence of an extremely faint FUV shelf extending to 1.3 R25 with some associated H emission.
-
•
NGC1097: The bumps in the FUV and H profiles are caused by the asymmetric spiral arms. We classed the H profile as truncated due to the sharp decline seen at R25 and at R25.
-
•
NGC1291: The original H image was under-subtracted toward the centre of the galaxy. To create the H profile we re-subtracted the continuum from the raw H image which makes the absolute H flux profile unreliable. It should also be noted that the FUV emission in the centre of the galaxy due primarily to an old stellar population rather than recent star formation. This is confirmed by the exceptionally red UV colour found toward the centre of the galaxy, this can be see in the GALEX composite images.
-
•
NGC1512: This is the most extended galaxy in the sample and many of the HII regions fall close to the edge of the H image where edge effects can make the determination of the radial profile difficult. As a consequence we stop the H as soon before an annulus overlaps with the edge of the image, this is defined by the vertical dot-dashed line. Individual HII regions are detected beyond this radius and included in the analysis of this paper.
-
•
NGC2841: There is a noticeable change in the slope of the FUV profile at the truncation of the H profile, showing a clear distinction between the behaviour of the inner and extended discs.
-
•
NGC3198: Despite some sharp truncations in the H we have classified this as following the smooth FUV profile. These sharp H truncations are due in part to the occasion sparse distribution of HII objects and the small annulus used to make the profile, with a larger annulus the H is smoother out to the extent of the FUV emission.
-
•
NGC3521: Although there is no single definitive edge to the H profile we find only 1 HII region beyond R25 we class the profile as truncated.
-
•
NGC4321: Here the classification of a truncated H profile represents the clear change in the nature of H profile at the edge of the galaxy.
-
•
NGC4536: This galaxy shows an H profile extending beyond that of the FUV profile, a feature which is not evident from inspection of the images. This is in fact due to a difficult background estimation due to edge effects in the images.
![[Uncaptioned image]](/html/1003.2520/assets/x18.png)
![[Uncaptioned image]](/html/1003.2520/assets/x19.png)
![[Uncaptioned image]](/html/1003.2520/assets/x20.png)
![[Uncaptioned image]](/html/1003.2520/assets/x21.png)
![[Uncaptioned image]](/html/1003.2520/assets/x22.png)
![[Uncaptioned image]](/html/1003.2520/assets/x23.png)
![[Uncaptioned image]](/html/1003.2520/assets/x24.png)
![[Uncaptioned image]](/html/1003.2520/assets/x25.png)
![[Uncaptioned image]](/html/1003.2520/assets/x26.png)
![[Uncaptioned image]](/html/1003.2520/assets/x27.png)
![[Uncaptioned image]](/html/1003.2520/assets/x28.png)
![[Uncaptioned image]](/html/1003.2520/assets/x29.png)
![[Uncaptioned image]](/html/1003.2520/assets/x30.png)
![[Uncaptioned image]](/html/1003.2520/assets/x31.png)
![[Uncaptioned image]](/html/1003.2520/assets/x32.png)
![[Uncaptioned image]](/html/1003.2520/assets/x33.png)
![[Uncaptioned image]](/html/1003.2520/assets/x34.png)
![[Uncaptioned image]](/html/1003.2520/assets/x35.png)
![[Uncaptioned image]](/html/1003.2520/assets/x36.png)
![[Uncaptioned image]](/html/1003.2520/assets/x37.png)
![[Uncaptioned image]](/html/1003.2520/assets/x38.png)
References
- Bertin & Arnouts (1996) Bertin E., Arnouts S., 1996, AAPS, 117, 393
- Boissier et al. (2007) Boissier S., Gil de Paz A., Boselli A., Madore B. F., Buat V., Cortese L., Burgarella D., Muñoz-Mateos J. C., Barlow T. A., Forster K., Friedman P. G., Martin D. C., Morrissey P., Neff S. G., Schiminovich D., Seibert M., Small T., 2007, ApJS, 173, 524
- Boselli et al. (2009) Boselli, A., Boissier, S., Cortese, L., Buat, V., Hughes, T. M., & Gavazzi, G. 2009, ApJ, 706, 1527
- Bresolin et al. (2009) Bresolin F., Ryan-Weber E., Kennicutt R. C., Goddard Q., 2009, ApJ, 695, 580
- Bush et al. (2008) Bush S. J., Wang Z., Karovska M., Fazio G. G., 2008, ApJ, 688, 875
- Caldwell et al. (1991) Caldwell N., Kennicutt R., Phillips A. C., Schommer R. A., 1991, ApJ, 370, 526
- Caldwell et al. (1994) Caldwell N., Kennicutt R., Schommer R., 1994, AJ, 108, 1186
- Calzetti (2001) Calzetti D., 2001, PASP, 113, 1449
- Calzetti et al. (2000) Calzetti D., Armus L., Bohlin R. C., Kinney A. L., Koornneef J., Storchi-Bergmann T., 2000, ApJ, 533, 682
- Cortese et al. (2006) Cortese L., Boselli A., Buat V., Gavazzi G., Boissier S., Gil de Paz A., Seibert M., Madore B. F., Martin D. C., 2006, ApJ, 637, 242
- Cortese et al. (2008) Cortese L., Boselli A., Franzetti P., Decarli R., Gavazzi G., Boissier S., Buat V., 2008, MNRAS, 386, 1157
- Cortese et al. (2004) Cortese L., Gavazzi G., Boselli A., Iglesias-Paramo J., 2004, A&A, 416, 119
- de Vaucouleurs et al. (1991) de Vaucouleurs G., de Vaucouleurs A., Corwin Jr. H. G., Buta R. J., Paturel G., Fouque P., 1991, Third Reference Catalogue of Bright Galaxies. Volume 1-3, XII, 2069 pp. 7 figs.. Springer-Verlag Berlin Heidelberg New York
- Dong et al. (2008) Dong H., Calzetti D., Regan M., Thilker D., Bianchi L., Meurer G. R., Walter F., 2008, AJ, 136, 479
- Drozdovsky & Karachentsev (2000) Drozdovsky I. O., Karachentsev I. D., 2000, AAPS, 142, 425
- Elmegreen & Hunter (2006) Elmegreen, B. G., & Hunter, D. A. 2006, ApJ, 636, 712
- Elmegreen & Parravano (1994) Elmegreen B. G., Parravano A., 1994, ApJL, 435, L121+
- Feldmeier et al. (1997) Feldmeier J. J., Ciardullo R., Jacoby G. H., 1997, ApJ, 479, 231
- Ferguson et al. (1998) Ferguson A. M. N., Wyse R. F. G., Gallagher J. S., Hunter D. A., 1998, ApJL, 506, L19
- Freedman et al. (2001) Freedman W. L., Madore B. F., Gibson B. K., Ferrarese L., Kelson D. D., Sakai S., Mould J. R., Kennicutt Jr. R. C., Ford H. C., Graham J. A., Huchra J. P., Hughes S. M. G., Illingworth G. D., Macri L. M., Stetson P. B., 2001, ApJ, 553, 47
- Gavazzi et al. (1999) Gavazzi G., Boselli A., Scodeggio M., Pierini D., Belsole E., 1999, MNRAS, 304, 595
- Gerhard et al. (2002) Gerhard O., Arnaboldi M., Freeman K. C., Okamura S., 2002, ApJL, 580, L121
- Gil de Paz et al. (2007a) Gil de Paz A., Boissier S., Madore B. F., Seibert M., Joe Y. H., Boselli A., Wyder T. K., Thilker D., Bianchi L., Rey S.-C., Rich R. M., Barlow T. A., Conrow T., Forster K., Friedman P. G., Martin D. C., Morrissey P., 2007a, ApJS, 173, 185
- Gil de Paz et al. (2005) Gil de Paz A., Madore B. F., Boissier S., Swaters R., Popescu C. C., Tuffs R. J., Sheth K., Kennicutt Jr. R. C., Bianchi L., Thilker D., Martin D. C., 2005, ApJL, 627, L29
- Gil de Paz et al. (2007b) Gil de Paz A., Madore B. F., Boissier S., Thilker D., Bianchi L., Sánchez Contreras C., Barlow T. A., Conrow T., Forster K., Friedman P. G., Martin D. C., Morrissey P., Neff S. G., Rich R. M., Schiminovich D., Seibert M., 2007b, ApJ, 661, 115
- Hao (2009) Hao C.-N. e. a., 2009, MNRAS
- Heckman et al. (1995) Heckman T., Krolik J., Meurer G., Calzetti D., Kinney A., Koratkar A., Leitherer C., Robert C., Wilson A., 1995, ApJ, 452, 549
- Hodge (1969) Hodge P. W., 1969, ApJS, 18, 73
- Hodge (1974) —, 1974, ApJS, 27, 113
- Hodge & Kennicutt (1983) Hodge P. W., Kennicutt Jr. R. C., 1983, AJ, 88, 296
- Kennicutt (1989) Kennicutt Jr. R. C., 1989, ApJ, 344, 685
- Kennicutt et al. (2003) Kennicutt Jr. R. C., Armus L., Bendo G., Calzetti D., Dale D. A., Draine B. T., Engelbracht C. W., Gordon K. D., Grauer A. D., Helou G., Hollenbach D. J., Jarrett T. H., Kewley L. J., Leitherer C., Li A., Malhotra S., Regan M. W., Rieke G. H., 2003, PASP, 115, 928
- Kennicutt et al. (1989) Kennicutt Jr. R. C., Edgar B. K., Hodge P. W., 1989, ApJ, 337, 761
- Kong et al. (2004) Kong X., Charlot S., Brinchmann J., Fall S. M., 2004, MNRAS, 349, 769
- Krumholz & McKee (2008) Krumholz M. R., McKee C. F., 2008, Nature, 451, 1082
- Lee et al. (2009) Lee K.-G., Berger E., Knapp G. R., 2009, ArXiv e-prints
- Lelièvre & Roy (2000) Lelièvre M., Roy J.-R., 2000, AJ, 120, 1306
- Macri et al. (2001) Macri L. M., Stetson P. B., Bothun G. D., Freedman W. L., Garnavich P. M., Jha S., Madore B. F., Richmond M. W., 2001, ApJ, 559, 243
- Martin & Kennicutt (2001) Martin C. L., Kennicutt Jr. R. C., 2001, ApJ, 555, 301
- Mei et al. (2007) Mei S., Blakeslee J. P., Côté P., Tonry J. L., West M. J., Ferrarese L., Jordán A., Peng E. W., Anthony A., Merritt D., 2007, ApJ, 655, 144
- Melena et al. (2009) Melena, N. W., Elmegreen, B. G., Hunter, D. A., & Zernow, L. 2009, AJ, 138, 1203
- Meurer et al. (1999) Meurer G. R., Heckman T. M., Calzetti D., 1999, ApJ, 521, 64
- Meurer et al. (1995) Meurer G. R., Heckman T. M., Leitherer C., Kinney A., Robert C., Garnett D. R., 1995, AJ, 110, 2665
- Meurer et al. (2009) Meurer G. R., Wong O. I., Kim J. H., Hanish D. J., Heckman T. M., Werk J., Bland-Hawthorn J., Dopita M. A., Zwaan M. A., Koribalski B., Seibert M., Thilker D. A., Ferguson H. C., Webster R. L., Putman M. E., Knezek P. M., Doyle M. T., Drinkwater M. J., et al., 2009, ApJ, 695, 765
- Muñoz-Mateos et al. (2009) Muñoz-Mateos, J. C., et al. 2009, ApJ, 701, 1965
- Oosterloo et al. (2004) Oosterloo T., Morganti R., Sadler E. M., Ferguson A., van der Hulst T., Jerjen H., 2004, in IAU Symposium, Vol. 217, Recycling Intergalactic and Interstellar Matter, Duc P.-A., Braine J., Brinks E., eds., pp. 486–+
- Panuzzo et al. (2007) Panuzzo P., Granato G. L., Buat V., Inoue A. K., Silva L., Iglesias-Páramo J., Bressan A., 2007, MNRAS, 375, 640
- Paturel et al. (2002) Paturel G., Teerikorpi P., Theureau G., Fouqué P., Musella I., Terry J. N., 2002, A&A, 389, 19
- Pflamm-Altenburg & Kroupa (2008) Pflamm-Altenburg J., Kroupa P., 2008, Nature, 455, 641
- Ryan-Weber et al. (2004) Ryan-Weber E. V., Meurer G. R., Freeman K. C., Putman M. E., Webster R. L., Drinkwater M. J., Ferguson H. C., Hanish D., Heckman T. M., Kennicutt Jr. R. C., Kilborn V. A., Knezek P. M., Koribalski B. S., Meyer M. J., Oey M. S., Smith R. C., Staveley-Smith L., 2004, AJ, 127, 1431
- Safronov (1960) Safronov V. S., 1960, Annales d’Astrophysique, 23, 979
- Schaye (2004) Schaye J., 2004, ApJ, 609, 667
- Schlegel et al. (1998) Schlegel D. J., Finkbeiner D. P., Davis M., 1998, ApJ, 500, 525
- Seibert et al. (2005) Seibert M., Martin D. C., Heckman T. M., Buat V., Hoopes C., Barlow T., Bianchi L., Byun Y.-I., Donas J., Forster K., Friedman P. G., Jelinsky P., Lee Y.-W., Madore B. F., Malina R., Milliard B., Morrissey P., Neff S., Rich R. M., 2005, ApJL, 619, L55
- Silbermann et al. (1996) Silbermann N. A., Harding P., Madore B. F., Kennicutt Jr. R. C., Saha A., Stetson P. B., Freedman W. L., Mould J. R., Graham J. A., Hill R. J., Turner A., Bresolin F., Ferrarese L., Ford H., Hoessel J. G., Han M., Huchra J., Hughes S. M. G., 1996, ApJ, 470, 1
- Sternberg et al. (2003) Sternberg A., Hoffmann T. L., Pauldrach A. W. A., 2003, ApJ, 599, 1333
- Thilker et al. (2005) Thilker D. A., Bianchi L., Boissier S., Gil de Paz A., Madore B. F., Martin D. C., Meurer G. R., Neff S. G., Rich R. M., Schiminovich D., Seibert M., Wyder T. K., Barlow T. A., Byun Y.-I., Donas J., Forster K., Friedman P. G., Heckman T. M., 2005, ApJL, 619, L79
- Thilker et al. (2007) Thilker D. A., Bianchi L., Meurer G., Gil de Paz A., Boissier S., Madore B. F., Boselli A., Ferguson A. M. N., Muñoz-Mateos J. C., Madsen G. J., Hameed S., Overzier R. A., Forster K., Friedman P. G., Martin D. C., Morrissey P., Neff S. G., 2007, ApJS, 173, 538
- Thim et al. (2003) Thim F., Tammann G. A., Saha A., Dolphin A., Sandage A., Tolstoy E., Labhardt L., 2003, ApJ, 590, 256
- Toomre (1964) Toomre A., 1964, ApJ, 139, 1217
- Tully & Fisher (1988) Tully R. B., Fisher J. R., 1988, Catalog of Nearby Galaxies. Catalog of Nearby Galaxies, by R. Brent Tully and J. Richard Fisher, pp. 224. ISBN 0521352991. Cambridge, UK: Cambridge University Press, April 1988.
- Vacca et al. (1996) Vacca W. D., Garmany C. D., Shull J. M., 1996, ApJ, 460, 914
- van der Kruit (1988) van der Kruit, P. C. 1988, A&A, 192, 117
- van Driel et al. (1988) van Driel W., Rots A. H., van Woerden H., 1988, A&A, 204, 39
- van Driel & van Woerden (1989) van Driel W., van Woerden H., 1989, A&A, 225, 317
- van Zee et al. (1998) van Zee L., Salzer J. J., Haynes M. P., O’Donoghue A. A., Balonek T. J., 1998, AJ, 116, 2805
- Werk et al. (2008) Werk J. K., Putman M. E., Meurer G. R., Oey M. S., Ryan-Weber E. V., Kennicutt Jr. R. C., Freeman K. C., 2008, ApJ, 678, 888
- Zaritsky & Christlein (2007) Zaritsky D., Christlein D., 2007, AJ, 134, 135