Super-resolution imaging using spatial Fourier transform infrared spectroscopy
Abstract
Spatial resolution of most imaging devices is fundamentally restricted by diffraction. This limitation is manifested in the loss of high spatial frequency information contained in evanescent waves. As a result, conventional far-field optics yields no information about an object’s subwavelength features. Here we propose a novel approach to recovering evanescent waves in the far field, thereby enabling subwavelength-resolved imaging and spatial spectroscopy. Our approach relies on shifting the frequency and the wave vector of near-field components via scattering on acoustic phonons. This process effectively removes the spatial frequency cut-off for unambiguous far field detection. A straightforward extension of this technique, which we call spatial Fourier transform infrared spectroscopy, allows to preserve phase information, making it possible to perform 3D subwavelength imaging. We discuss the implementation of such a system in the mid-IR and THz bands, with possible extension to other spectral regions.
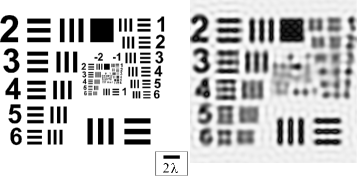
Optical microscopy is widely used for probing the nanoscale, with particularly important applications in the life sciences. It is fast, noninvasive, and can be coupled with fluorescence and spectroscopy studies to uncover the structure, composition, and dynamics of biological samples. However, due to the diffraction limit much of the important structural information about the object under study becomes lost Abbe1873 . We illustrate the extent of this loss by comparing the image [Fig.1(b)] of a subwavelength optical target [Fig.1(a)] with one that would be produced by an ideal diffraction-limited optical system (which could be implemented using e.g. synthetic aperture techniques Lukosz1967 ; BrueckOL1999 ). It is apparent the details smaller than cannot be resolved. Because of this wavelength dependence, the resolution of the image particularly suffers in the mid-IR and THz spectral bands. This creates a significant stumbling block for studying microscopic chemical morphology. For instance, mid-infrared spectroscopy – a crucial tool for chemical identification – cannot be used for structure-specific analysis of biological samples due to the inability to resolve small cells, bacteria, and cellular subunits.
There exist certain techniques that can improve spatial resolution of optical imaging beyond the diffraction limit. One category of methods involves scanning probes Dragnea2001 ; Keilmann1999 ; Planken2002 , which rely on the detection of evanescent waves in the near field of the sample. Nonlinear processes form another set of approaches; these include coherent anti-Stokes Raman spectroscopy (CARS) Xie1999 ; Ito2004 , as well as RESOLFT techniques (which utilize saturable fluorescence transitions) Hell2007 . All the above solutions typically involve complicated and expensive experimental setups. This limits their widespread availability, as well as their potential for creating compact integrated detection and/or imaging devices. In addition, some setups may be difficult to adapt for operation in mid-IR or THz.
In the past few years, there emerged several intriguing approaches towards subwavelength imaging that involve using metamaterial-based devices, which promise to be low-cost and readily adaptable for a variety of spectral regions. Such devices work by recovering the evanescent waves and the concomitant information about the object’s fine structure. A negative index “superlens” pendry , for instance, can drastically amplify the evanescent components of the spatial spectrum while transmitting the propagating waves. However, the superlens exhibits exponential sensitivity to losses, limiting practical devices to near-field operation PodolskiyNarimanovNSSL . A more recent set of experiments involved subwavelength scatterers placed in the near field of a source. By diffracting off the scatterers, evanescent waves convert into propagating waves which could then be used to gather information about the near-field spectrum Durant2006 or to attain subwavelength focusing LeroseyFink2007 . However, in this far-field superlens Durant2006 , the diffracted evanescent waves mix with the existing propagating spectrum leading to the loss of information about the target.
In the present Letter, we propose an alternative approach to far-field spatially resolved spectroscopy, based on a device that converts mid-IR or THz evanescent waves to propagating waves via scattering on acoustic phonons. These scattered and frequency-shifted waves can be easily decoupled from the existing propagating spectrum that forms the regular diffraction-limited image, and with minimal processing can be used to distinguish subwavelength features. Furthermore, the ability to dynamically tune the period of the acoustic grating makes this system robust, flexible, and capable of operating over a wide range of spatial frequencies.
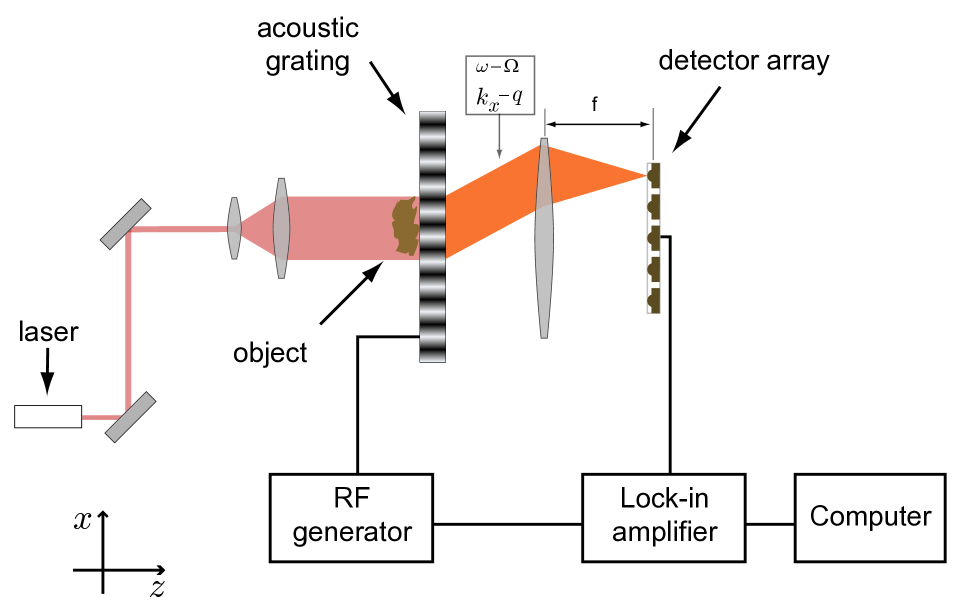
The proposed super-resolution Fourier microscope/sensing system is shown in Fig. 2. The object is placed in the near field of an acousto-optic modulator (AOM) and illuminated with a plane wave from a mid-IR or THz source. Waves scattered from the object strike the phonon grating set up in the AOM by a running acoustic wave with frequency . Due to scattering on the phonons, the transverse wave vector of the incident radiation is shifted by integer multiples the phonon wave vector , while its corresponding frequency is shifted by integer multiples of . For a sufficiently large , the evanescent components of the object’s spatial spectrum () can be scattered into the propagating waves with . The various spatial frequency components can be measured using a Fourier optics setup (e.g. a lens with a detector array in its focal plane).
The amplitudes of the frequency-shifted waves can be obtained using the standard methods of acuostooptics KorpelBook (cf. Methods). We define , (with linear coefficients , describing the generation of phonon-scattered and/or device transmission characteristics) and assume , where is the detected amplitude of the illuminating wave . Averaging out the signal over the finite detector aperture and subtracting the background (which can be done electronically), we can write the intensity detected by the system of Fig. 2 as
| (1) |
The two terms in this equation can be decoupled using standard techniques: the DC term is isolated with the aid of a low-pass filter, while the term oscillating at the acoustic frequency is recoverable using lock-in detection. For any given , this second term contains contributions from both and . Although the coupling between these two quantities, together with the lack of phase information, makes it difficult to recover the spatial spectrum, the information collected can be used in detecting subwavelength morphological changes between different samples.
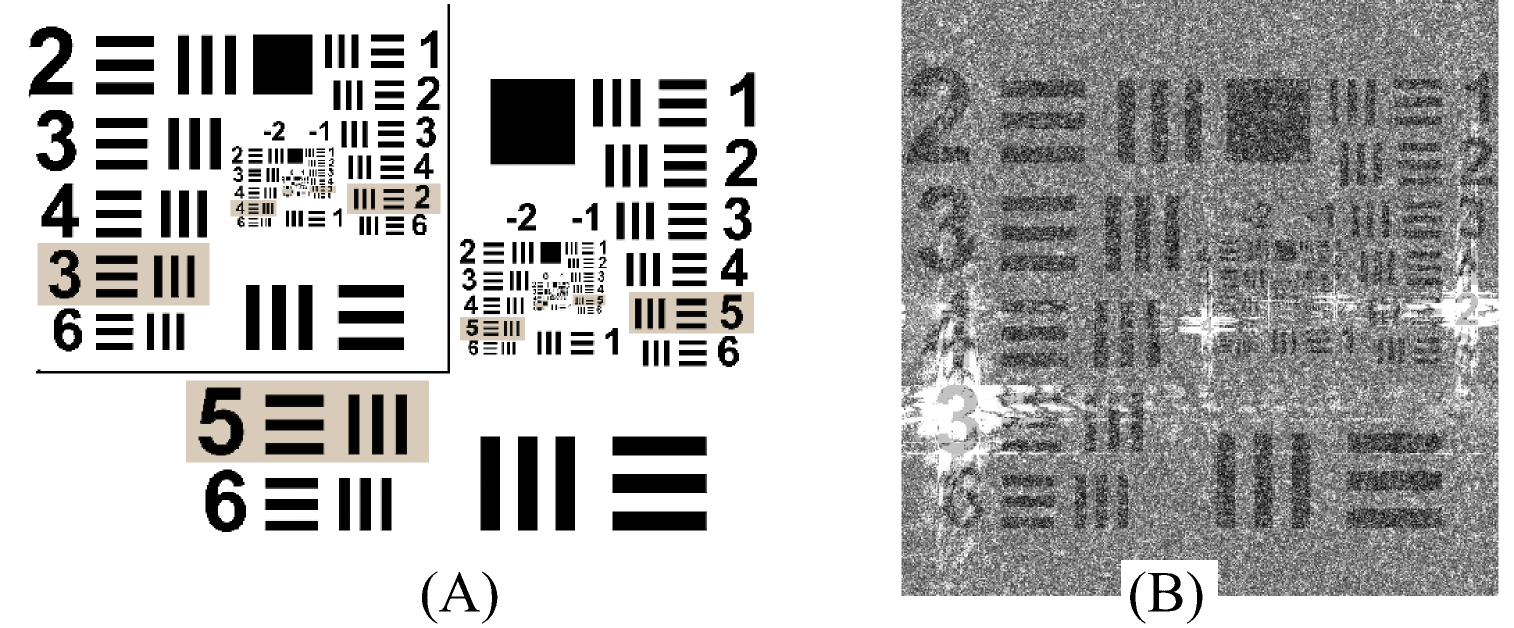
To illustrate this, we utilize Eq. (1) to perform a comparison between the standard optical target of Fig. 1 and a modified target, where the label of every 6th line group has been randomly replaced. The first replacement corresponds to the last resolvable line group (/2.5 line separation); the subsequent replacements correspond to halving the size of the line groups (/5,, /40). We assume the measurement is performed by selecting an element of a photodetector array in the observation plane and using two orthogonal acoustic transducers to scan the acoustic wavevector within the range .
It should be emphasized that any method that relies on digital processing of raw data can suffer form rapid – sometimes exponential PodolskiyNarimanovNSSL – accumulation of noise. To address this potential issue, in our computations we add a normally-distributed random term to the AC amplitude of Eq. (1) in order to simulate noise in the system. Because SNR is expected to be lowest for maximum values of the acoustic wavevector , we consider SNR=10 for 111Acoustooptic diffraction efficiency, and hence the signal-to-noise ratio varies as .. Assuming a practical 2020 element photodetector array, we compute the signal given by Eq. (1) for the standard target, as well as the modified target [Fig. 3(a)]. Fig. 3(b) shows the result of subtracting the two datasets and performing an inverse Fourier transform, with the resulting plot superimposed onto the modified optical target. Evidently, every change in the original image is manifested in this difference diagram. Furthermore, it is largely localized in the vicinity of the actual changed pixels. It is possible to discern the difference signal even from the /40 line group label.
The ability to distinguish between fine spatial features of optical targets makes the system described above uniquely suited for identifying objects based on their subwavelength spatial features. As a result, it may find many applications in fingerprinting and/or detection of chemical and biological structures.
Furthermore, a straightforward modification of this setup not only allows to measure the “downshifted” component directly, but also provides a method for retrieving phase information, making it possible to perform phase-contrast microscopy, as well as 3D imaging on subwavelength scales.
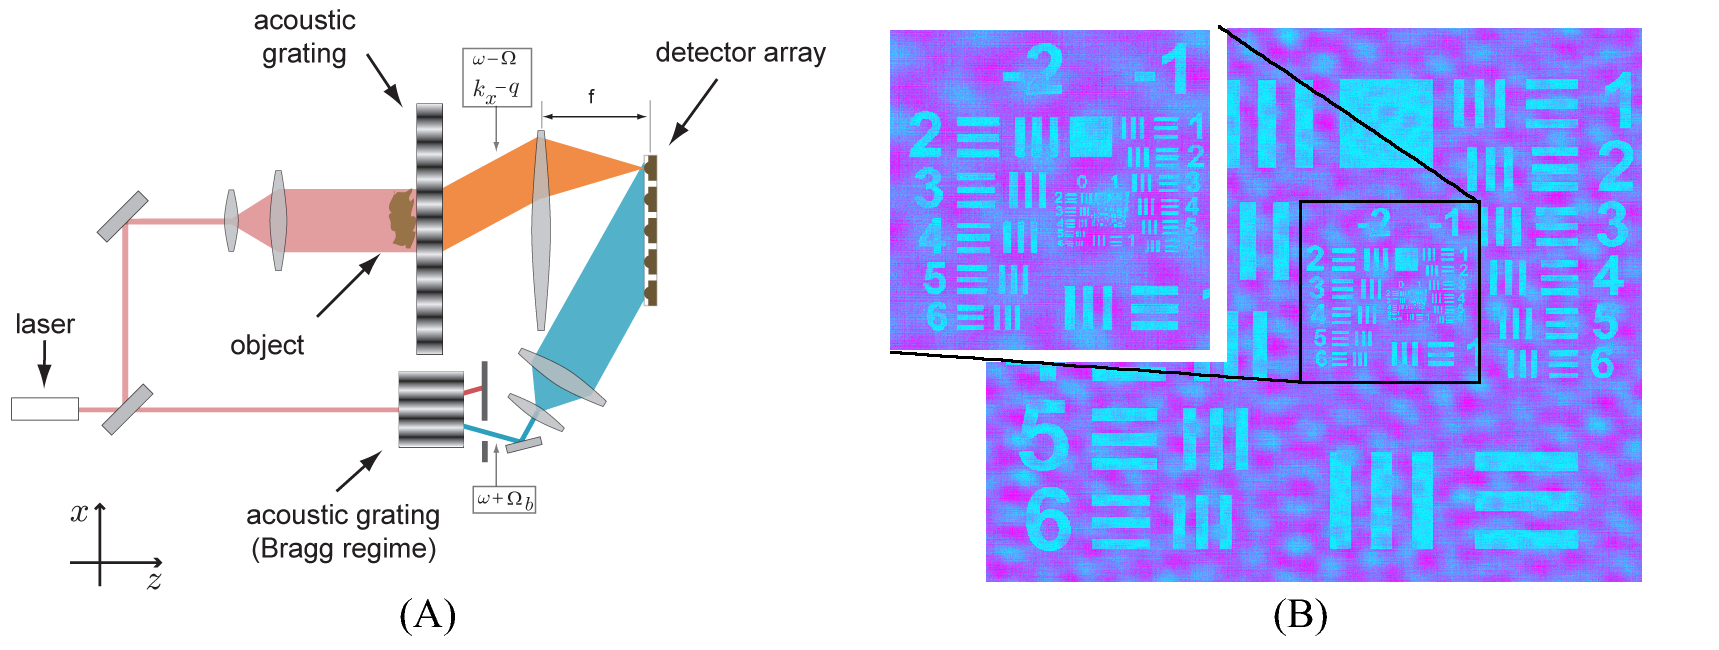
To this end, a portion of the illuminating radiation is shifted in frequency by using a second AOM. Unlike the modulator that interacts with light scattered from the sample in the Raman-Nath regime Boyd_NLO , this second AOM utilizes an appropriately oriented and longer cell to produce Bragg scattering. This results in a strong optical signal at frequency , , which is projected onto the detector [see Fig. 4(a)]. Interference between the two optical signals produces beat note photocurrents with frequencies , , , :
| (2) |
where is the phase difference between the signal from the Bragg cell, , and the Raman-Nath-scattered signal .
Of special interest is the component at frequency , which carries the high spatial frequency information contained in its modulus and its phase . Both of these quantities can be retrieved using lock-in techniques. To produce the lock-in reference, the RF signals driving the two acoustic cells can be mixed using a nonlinear element (e.g. a diode) and appropriately filtered to produce the sum frequency. As a result, complete information can be obtained about the complex high spatial frequency Fourier component , from which it is straightforward to deduce the field . By collecting data from multiple CCD pixels, as well as by varying the acoustic wave vector , information can be collected about the spatial spectrum of the object. The data can then be digitally processed to produce a spatial-domain image containing subwavelength details, as well as phase contrast.
Because the Bragg-shifted signal we use to decouple the and terms serves as a reference needed to record phase information, and because the image is reconstructed digitally, our technique bears some similarities with digital Fourier holography (DFH) OriginalGoodmanDigitalHoloPaper ; HoloCCDProblem1 ; CucheDigitalHolo . However, our method contains several key enhancements over DFH. In conventional holography, care has to be taken to isolate the target signal both in real and Fourier space. This constrains reference wave geometry, translating into limitation on the field of view, as well as maximum attainable resolution. The requirement that the CCD pixel spacing must allow for imaging the reference wave fringes further limits the resolution. By virtue of frequency-shifting the signal, it is possible to isolate the interference term of interest. Furthermore, since the spatial spectrum measurements are performed not only by selecting different CCD pixels, but also by scanning the acoustic wavevector, the limitations of CCD’s physical spatial frequency bandwidth (introduced by pixel granularity) HoloCCDProblem1 can be circumvented.
We simulate the performance of the system by first using Eq. (Super-resolution imaging using spatial Fourier transform infrared spectroscopy) to compute the response of the system to a calibration signal having unit amplitude for all spatial frequencies. In practice, such calibration signal might be generated by placing a point source in the vicinity of the AOM. Eq. (Super-resolution imaging using spatial Fourier transform infrared spectroscopy) also provides the effective amplitude and phase transfer functions that allow to determine the detected signal for a given input field distribution. Gaussian noise is added to simulate spurious signals in the system. The input signal can then be obtained by dividing out the calibration quantities. In Fig. 4(b) we plot the simulated retrieved field magnitude. Zooming in on the central part of the test patten (figure inset) it is evident that every line group is distinctly resolved. Furthermore, because the phase information is preserved, the full 3D information about the target is collected.
There exist many possible ways to enhance the functionality and the performance of the proposed devices. For instance, sensitivity of the device may be improved with a subwavelength layer of highly doped semiconductor at the front AOM facet. When the dielectric constant of this layer is equal to , the evanescent fields are strongly enhanced due to resonant coupling to surface plasmons in the doped layer (a phenomenon known as “poor-man’s superlensing” pendry ), leading to better SNR at the detector. Another possible way to improve the scattering efficiency of evanescent waves is placing the sample directly in the path of an acoustic wave, for instance, by running the wave through a microchannel containing objects to be studied. This approach may find many applications in novel integrated biological/chemical detection devices. Finally, we comment on the possibility of extending the proposed approach to frequencies other than the mid-IR and THz bands discussed here. While implementing the system for lower frequencies is essentially trivial, near-IR and optical frequencies pose a challenge. Acoustic phonon energies in practical devices do not approach the values necessary to produce a substantial wave vector shift in these spectral bands. However, the required shift in spatial and temporal frequencies can in principle be attained by replacing the acoustooptic medium with a nanostructured periodically moving grating.
In conclusion, we have proposed a system that enables detection of sub-diffraction-limited spatial spectrum components in the far field by utilizing scattering from an acoustic grating. This process works whenever the spatial frequencies of the object are comparable in scale to the acoustic wave vector. In its simplest implementation, the system could aid in “fingerprinting” of samples based on their subwavelength spatial features. With the use of an additional Bragg-shifted reference signal, it is also possible to recover the phase of the original optical signal. This technique, the spatial Fourier transform infrared spectroscopy, allows to perform subwavelength-resolved 3D imaging. In addition, the proposed approach has the potential to greatly enhance the specificity of mid-IR and THz spectroscopy.
Details of the calculations
We start by considering a rectangular sound column (i.e. planar acoustic wavefronts propagating in the direction) interacting with a spectrum of incident plane waves in a dielectric medium. We neglect the diffraction of the sound field and assume weak interaction. Due to photoelastic effect, the sound field produces a sinusoidal modulation of the dielectric permittivity Boyd_NLO ,
| (3) |
which corresponds to a spatiotemporal volume grating. We may write the general form of the field inside the grating as a sum over the discrete diffracted orders,
| (4) |
The scattered plane wave components are then governed by the Raman-Nath equations KorpelBook ,
| (5) |
where , and .
The amplitude of the diffracted order, , is proportional to , with , allowing to ignore higher order terms (). We can, furthermore, conclude that the amount of energy scattered into the shifted waves is small, thereby permitting to neglect the variation of diffracted order (the undepleted pump approximation) Boyd_NLO . We note that for propagating waves, this conclusion is valid insofar as there exists no Bragg matching between the incident and diffracted waves. Since the phonon wave vector is a tunable parameter in our model, it is always possible to pick a range of values to ensure minimal energy loss in the incident wave. For the evanescent waves, the undepleted pump approximation is justified by the small interaction length.
Keeping terms up to first order in Eq. (4), we obtain:
| (6) |
The scattering amplitudes of “upshifted” and “downshifted” waves can be obtained from this expression. Since the input field at spatial frequencies contributes to the output field at spatial frequency , we may write:
| (7) |
with , . Scattering coefficients are given by
| (8) |
where , , and is a transmission coefficient. We note that for , as well as , the perturbative treatment of Eq. (5) breaks down due to the onset of Bragg-matching.
From Eq. (8) we can estimate the diffraction efficiency of high spatial frequency input signal as
| (9) |
with (the refractive index of the acoustic medium), and , the flux of acoustic energy per unit area.
In our computations, we assume the operating wavelength of 10 m with germanium as the acoustic medium. We take and restrict the magnitude of the acoustic wave vector to . To obtain the ultrasonic fluence of 33 W/cm2 is required. Since for high spatial frequencies , acoustic driving frequencies up to 8.75 GHz are required to retrieve . These parameters are within reach of modern ultrasonic transducers HiFreqUltrasoundBulk , as well as surface acoustic wave devices HiFreqUltrasoundSAW . the system depends on the characteristics of the The signals are generated by sampling points in spatial frequency space. Assuming 400 points can be sampled at once with a detector array, it is necessary to use a focusing lens with and adjust the acoustic wave vector components sequentially, effectively scanning the low N.A. system over a larger spatial frequency spectrum BrueckOL1999 ; BrueckOE2007 . At KHz readout rates, short ( s) acquisition times can be obtained with this setup.
We simulate the measurements by taking the signal indicated by Eqs. (1) and (Super-resolution imaging using spatial Fourier transform infrared spectroscopy) and introducing additive Gaussian noise. Assuming a shot-noise limited long-wavelength IR detector with a typical detectivity RoomTempDetectivityAPL we find that mW of illuminating optical power is needed to obtain SNR of used in our calculations.
Finally, we note that a potentially substantial source of noise in the proposed system is the detection of zero-order (undiffracted) illumination at the shifted frequencies due to the finite source linewidth. In the measurement region, the Lorentzian lineshape of the source takes the same functional dependence as the diffracted signal of Eq. (9). Thus, the zero-order illumination simply adds a constant measurement background that may be subtracted. The noise floor is effectively raised by a factor , where is the acoustic frequency that yields , and is the source linewidth. Assuming the source is a frequency-stabilized quantum cascade laser with a 15 KHz linewidth NarrowLinewidthQCL , this increase factor is not significant ().
The work was partially supported by ARO MURI and NSF MIRTHE.
References
- (1) Abbe E (1873) Contributions to the theory of the microscope and microscopic detection (translated from German). Arch Mikrosk Anat 9:413–468.
- (2) Lukosz W (1967) Optical system with resolving power exceeding the classical limit, II. J Opt Soc Am 57:932–941.
- (3) Chen X, Brueck SRJ (1999) Imaging interferometric lithography - approaching the resolution limits of optics. Opt Lett 24:124–126.
- (4) Dragnea B, Preusser J, Szarko JM, Leone SR, Hinsberg WDJ (2001) Pattern characterization of deep-ultraviolet photoresists by near-field infrared microscopy. J Vac Sci Technol B 19:142–152.
- (5) Knoll B, Keilmann F (1999) Near-field probing of vibrational absorption for chemical microscopy. Nature 399:134–137.
- (6) van der Valk NCJ, Planken PCM (2002) Electro-optic detection of subwavelength terahertz spot sizes in the near field of a metal tip. Appl Phys Lett 81:1558–1560.
- (7) Zumbusch A, Holtom GR, Xie XS (1999) Three-dimensional vibrational imaging by coherent anti-stokes raman scattering. Phys Rev Lett 82:4142–4145.
- (8) Shikata J, Matsumoto T, Zhao SL, Suzuki Y, Ito H (2004) Coherent anti-stokes raman spectroscopy for THz-frequency modes of biomolecules in aqueous solution. In Conference on Lasers and Electro-Optics (Optical Society of America), p. CThtT36.
- (9) Hell SW (2007) Far-field optical nanoscopy. Science 316:1153–1158.
- (10) Pendry JB (2000) Negative refraction makes a perfect lens. Phys Rev Lett 85:3966–3969.
- (11) Podolskiy VA, Narimanov EE (2005) Near-sighted superlens. Opt Lett 30:75–77.
- (12) Durant S, Liu Z, Steele JM, Zhang X (2006) Theory of the transmission properties of an optical far-field superlens for imaging beyond the diffraction limit. J Opt Soc Am B 23:2383–2392.
- (13) Lerosey G, de Rosny J, Tourin A, Fink M (2007) Focusing beyond the diffraction limit with far-field time reversal. Science 315:1120–1122.
- (14) Korpel A (1989) Acoustooptics (Marcel Dekker, New York).
- (15) Boyd RW (2003) Nonlinear Optics (Academic Press, San Diego), second edn.
- (16) Goodman JW, Lawrence RW (1967) Digital image formation from electronically detected holograms. Applied Physics Letters 11:77–79.
- (17) Schnars U, Jüptner W (1994) Direct recording of holograms by a ccd target and numerical reconstruction. Applied Optics 33:179–181.
- (18) Cuche E, Marquet P, Depeursinge C (1999) Simultaneous amplitude-contrast and quantitative phase-contrast microscopy by numerical reconstruction of fresnel off-axis holograms. Appl Opt 38:6994–7001.
- (19) Lanz R, Muralt P (2005) Bandpass filters for 8 GHz using solidly mounted bulk acoustic wave resonators. IEEE Transactions on Ultrasonics, Ferroelectrics and Frequency Control 52:938–948.
- (20) Assouar MB, et al. (2007) High-frequency surface acoustic wave devices based on AlN/diamond layered structure realized using e-beam lithography. Journal of Applied Physics 101:114507.
- (21) Kuznetsova Y, Neumann A, Brueck SRJ (2007) Imaging interferometric microscopy approaching the linear systems limits of optical resolution. Opt Express 15:6651–6663.
- (22) Bhattacharya P, Su XH, Chakrabarti S, Ariyawansa G, Perera AGU (2005) Characteristics of a tunneling quantum-dot infrared photodetector operating at room temperature. Applied Physics Letters 86:191106.
- (23) Williams RM, et al. (1999) Kilohertz linewidth from frequency-stabilized mid-infrared quantum cascade lasers. Opt Lett 24:1844–1846.