Muon-spin-spectroscopy study of the penetration depth of FeTe0.5Se0.5
Abstract
Muon-spin-spectroscopy measurements have been used to study the superconducting state of FeTe0.5Se0.5. The temperature dependence of the in-plane magnetic penetration depth, , is found to be compatible with either a two gap wave or an anisotropic -wave model. The value for at K is estimated to be nm.
pacs:
76.75.+i, 74.70.Ad, 74.25.HaThe discovery of superconductivity at high temperature in iron-based materials was a real surprise and has generated tremendous interest Kamihara et al. (2008); Takahashi et al. (2008); Chen et al. (2008). Iron selenium has recently been reported to be superconducting with a of 8.0 K at ambient pressure Hsu et al. (2008) and 37 K at 7 GPa Margadonna et al. (2009). The substitution of tellurium on the selenium site increases to maximum of 14.5 K at ambient pressure. Yeh et al. (2008); Fang et al. (2008) Magnetization and resistivity measurements indicate a lower critical field at K, , of between 1 and 8 mT and an upper critical field, , of 40-60 T for the FeTe1-xSe system. Kida et al. (2009); Yadav and Paulose (2009); Biswas et al. (2010) Measurements on single crystals indicate that the superconducting properties of this material are anisotropic. Yadav and Paulose (2009); Biswas et al. (2010)
Muon spin rotation/relaxation, (SR), a probe that is sensitive to the local field distribution within a material, has often been used to measure the value and temperature dependence of the London magnetic penetration depth, , in the vortex state of type-II superconductors Sonier et al. (2000); Brandt (1988). is in turn proportional to where is the density of superconducting carriers. The temperature and field dependence of can provide information on the nature of the superconducting gap.
Here we report a SR study of FeTe0.5Se0.5. We show that the temperature dependence of can be equally well described using either a two gap -wave or an anisotropic -wave model. We obtain an in-plane magnetic penetration depth nm. We compare these results with published data for the FeTe1-xSe system.
A polycrystalline sample of FeTe0.5Se0.5 was synthesized in a two-step process from high purity iron granules (), selenium shot () and tellurium powder (). First, the appropriate stoichiometric mixture of elements were sealed in an evacuated carbon coated quartz tube ( mbar) and heated at a rate of C/h to C, held at this temperature for 48 h, and then cooled to room temperature at C/h. The sample was then heated at a rate of C/h to C for 24 h and cooled to room temperature at C/h. Since the quartz tube often cracked during this cooling, the tube was sealed into a second quartz tube at a high vacuum before the second heating process.
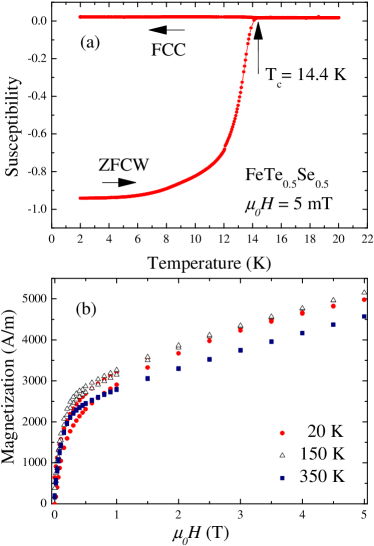
X-ray diffraction measurements show the sample has a tetragonal PbO type structure (space group ) with nm and nm. The x-ray pattern showed that the sample also contained a quantity () of the hexagonal-NiAs phase of FeTe0.5Se0.5 and some Fe3O4 (). Magnetization () versus temperature () measurements carried out in a Quantum Design MPMS magnetometer reveal the sample has a transition temperature, , of 14.4 K [see Fig. 1a]. The zero-field (ZF)-cooled dc susceptibility approaches a value of -1 while the field cooled signal is indicating strong pinning in the sample. Magnetization versus applied magnetic field loops collected in the normal state at 20, 150 and 350 K [see Fig. 1b] show that the normal state signal is nearly temperature independent and has a response made up of contributions typical of a soft ferromagnet and a Pauli paramagnet. This is consistent with the presence in the sample of a small amount of Fe3O4. Using the published value for the saturation magnetization of Fe3O4 Walz (2002) we estimate this fraction to be of the sample by mass Kha in agreement with our x-ray diffraction measurements.
The SR measurements were performed using the MuSR spectrometer at ISIS. A pulse of muons is produced every 20 ms and has a FWHM of ns. The muons are implanted into the sample and decay with half life, , of 2.2 s into positrons, which are emitted preferentially in the direction of the muon spin axis. For a longitudinal-field (LF) measurement these positrons are detected and time stamped in the detectors which are positioned before () and after () sample. The positron counts have the functional form
| (1) |
where is the longitudinal relaxation function. is determined using
| (2) |
where is a calibration constant which is determined by applying a transverse-field (TF) of 20 mT. Measurements were also carried out in transverse-field mode in magnetic fields of up to 60 mT. Each detector is normalized for the muon decay and rotated into two components at 90 degrees to one another.
The powder sample (30 mm by 30 mm square and 1 mm thick) was mixed with GE varnish and mounted on a pure Ag plate. For measurements down to 1.2 K the sample was placed in a conventional Oxford Instruments cryostat. Data were also collected between 0.3 and 1 K in an Oxford Instruments He-3 cryostat. For the measurements in TF mode in the conventional cryostat, hematite slabs were positioned immediately behind the sample. For measurements in the He-3 cryostat these hematite slabs were removed to ensure good thermal contact between the sample and the cold stage of the cryostat leading to an increased background in the data collected. For all the data collected in a magnetic field presented in this paper, the sample was field-cooled to base temperature and the data collected while warming the sample in a field. A set of data collected at 1.2 K in an applied magnetic field, mT after the sample was zero-field cooled produced no usable signal due to the very strong pinning present in the sample.
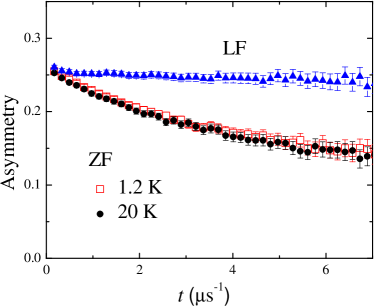
Zero-field (ZF) SR data (see Fig. 2) can be fitted using
| (3) |
where is the initial asymmetry, with a small nearly independent relaxation rate, , of 0.19 between 20 K and 1.2 K. The application of a small longitudinal magnetic field is sufficient to decouple the muon spin from the internal magnetic field. In line with the observations of Khasanov et al. Khasanov et al. (2008) this suggests that the depolarization is caused by weak, static magnetic fields, that are present in the sample both above and below . The most likely source of this field is dilute, randomly oriented magnetic moments associated with the Fe3O4 impurity phase.
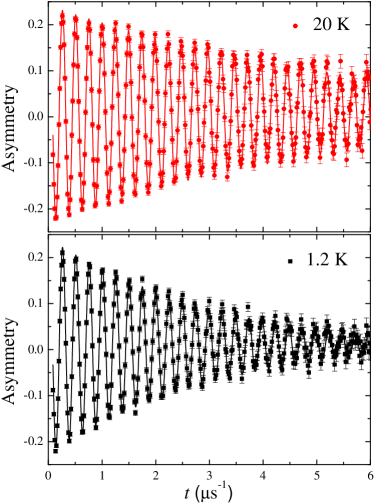
Figure 3 shows the TF-SR precession signals above and below . In the normal state, the oscillation shows a small relaxation. Below , the relaxation rate increases due to the inhomogeneous field distribution of the flux line lattice. Previous measurements on polycrystalline samples of superconducting materials have shown that the internal field distributions can be modeled using a sinusoidally oscillating function with a Gaussian component
| (4) |
where is the muon precession frequency and is the phase offset. is the Gaussian relaxation rate given by . is the contribution to the relaxation arising from the vortex lattice while , the nuclear magnetic dipolar term, is assumed to be temperature independent over the temperature range of the measurements. The data were fitted in two steps. First the data in the two channels were fitted simultaneously at each temperature with , , and as common variables. The fits were checked over the entire temperature range to ensure that physical values were obtained for all the parameters at each temperature point. To ensure stability of the fits was then fixed to the value obtained just above and the data were refitted at each temperature point. The temperature dependence of obtained is shown in Fig. 4.
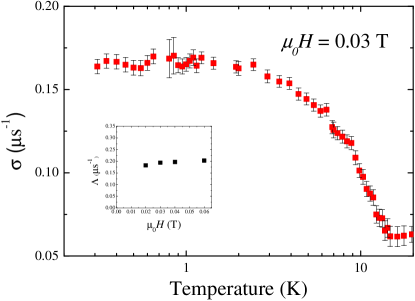
In a superconductor with a large upper critical field and a hexagonal Abrikosov vortex lattice, the Gaussian muon-spin depolarization rate, , is related to the penetration depth by the expression
| (5) |
where MHz/T is the muon gyromagnetic ratio and Wb is the flux quantum Sonier et al. (2000); Brandt (1988). The temperature dependence of the penetration depth can then be fitted using either a single gap or a two gap model Carrington and Manzano (2003); Padamsee et al. (1973)
| (6) |
where is the value of the penetration depth at K, is the value of the -th ( or 2) superconducting gap at K and is the weighting factor with .
Each term in equation 6 is evaluated using the standard expression within the local London approximation Tinkham (1975); Prozorov and Giannetta (2006)
| (7) |
where is the Fermi function, is the angle along the Fermi surface, and . The temperature dependence of the gap is approximated by the expression Carrington and Manzano (2003) while describes the angular dependence of the gap. The fits (see Table 1) appear to rule out both the -wave and -wave as possible models for this system Err (a).
| Model | Gap value (meV) | ||
|---|---|---|---|
| -wave | 1 | =1.86(2) | 5.93 |
| -wave | 1 | =2.6(1), =0.87(6) and | 1.55 |
| anisotropic -wave | with | 1.62 | |
| -wave | 2.87 |
The anisotropic -wave model gives a value for , the parameter reflecting the isotropic -wave component, that is larger than that obtained for FeSe0.85 in Ref. Khasanov et al. (2008). Nevertheless, the variation in the gap with angle is still larger than the published values for related single layer superconductor NdFeAsO0.9F0.1. Kondo et al. (2008)
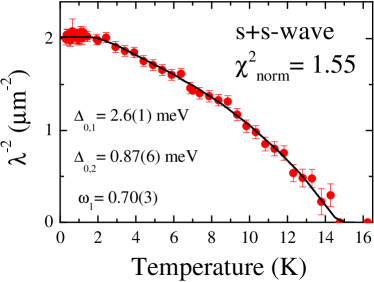
A fit to the data using a two-gap wave model is shown in Fig. 5 and gives meV and meV with . This model gives the lowest . agrees with the value obtained by SR for FeSe0.85 where . Khasanov et al. (2008) The size of the larger energy gap for FeSe0.85 and FeTe0.5Se0.5 scale with . The ratio found in FeTe0.5Se0.5 is smaller than the corresponding value seen in FeSe0.85 but coincides with the value for FeAsO0.9F0.1 (=La, Nd) determined by measuring the magnetic penetration depth using a tunnel-diode resonator. Martin et al. (2009).
For anisotropic polycrystalline samples, the magnetic penetration depth, , calculated from the SR depolarization rate is related to , the in-plane penetration depth by . Lam ; Fesenko et al. (1991) At , the value for nm with nm Err (b). These values are longer than those obtained by Khasanov et al. Khasanov et al. (2008) for FeSe0.85 in spite of the fact that the of FeTe0.5Se0.5 is K higher. The value for would place FeTe0.5Se0.5 above the line for hole doped high cuprates on an Uemura plot Uemura et al. (1989); Luetkens et al. (2008).
Using an upper critical field, , for FeTe0.5Se0.5 estimated from transport and magnetization measurements of 50 T and , we calculate a coherence length, , for FeTe0.5Se0.5 at 0 K of nm. If this is combined with our measurement of and the standard expression Tinkham (1975) we estimate mT. This is in fair agreement with magnetization measurements where the first deviation from linear behavior gives of between 1 and 8 mT at 1.5 K. Yadav and Paulose (2009); Biswas et al. (2010)
In summary, SR measurements have been performed on superconducting FeTe0.5Se0.5. The temperature dependence of the magnetic penetration depth is found to be compatible with either a two-gap -wave or an anisotropic -wave model. This result is consistent with other experimental data Khasanov et al. (2008); Dong et al. (2009) and density-functional calculations of the physical properties Subedi et al. (2008) of the FeTe1-xSex system, and with the more general picture that is now emerging for iron pnictide superconductors in which they are described as two-band superconductors. Further studies on high purity single crystal samples are desirable as the presence of impurities can sometimes mask the true nature of the superconducting gap. Sonier et al. (1999)
Acknowledgements.
The Quantum Design MPMS magnetometer used in this research was obtained through the Science City Advanced Materials project: Creating and Characterising Next Generation Advanced Materials project, with support from Advantage West Midlands (AWM) and part funded by the European Regional Development Fund (ERDF).References
- Kamihara et al. (2008) Y. Kamihara, T. Watanabe, M. Hirano, and H. Hosono, J. Am. Chem. Soc. 130, 3296 (2008).
- Takahashi et al. (2008) H. Takahashi, K. Igawa, K. Arii, Y. Kamihara, M. Hirano, and H. Hosono, Nature (London) 453, 376 (2008).
- Chen et al. (2008) X. H. Chen, T. Wu, G. Wu, R. H. Liu, H. Chen, and D. F. Fang, Nature (London) 453, 761 (2008).
- Hsu et al. (2008) F.-C. Hsu, J.-Y. Luo, K.-W. Yeh, T.-K. Chen, T.-W. Huang, P. M. Wu, Y.-C. Lee, Y.-L. Huang, Y.-Y. Chu, D.-C. Yan, et al., Proc. Natl. Acad. Sci. 105, 14262 (2008).
- Margadonna et al. (2009) S. Margadonna, Y. Takabayashi, Y. Ohishi, Y. Mizuguchi, Y. Takano, T. Kagayama, T. Nakagawa, M. Takata, and K. Prassides, Phys. Rev. B 80, 064506 (2009).
- Yeh et al. (2008) K.-W. Yeh, T.-W. Huang, Y.-l. Huang, T.-K. Chen, F.-C. Hsu, P. M. Wu, Y.-C. Lee, Y.-Y. Chu, C.-L. Chen, J.-Y. Luo, et al., Europhys. Lett. 84, 37002 (2008).
- Fang et al. (2008) M. H. Fang, H. M. Pham, B. Qian, T. J. Liu, E. K. Vehstedt, Y. Liu, L. Spinu, and Z. Q. Mao, Phys. Rev. B 78, 224503 (2008).
- Kida et al. (2009) T. Kida, T. Matsunaga, M. Hagiwara, Y. Mizuguchi, Y. Takano, and K. Kindo, J. Phys. Soc. Japan 78, 113701 (2009).
- Yadav and Paulose (2009) C. S. Yadav and P. L. Paulose, New J. Phys. 11, 103046 (2009).
- Biswas et al. (2010) P. K. Biswas, G. Balakrishnan, C. V. Tomy, D. M. Paul, and M. R. Lees (2010), unpublished.
- Sonier et al. (2000) J. E. Sonier, J. H. Brewer, and R. F. Kiefl, Rev. Mod. Phys. 72, 769 (2000).
- Brandt (1988) E. H. Brandt, Phys. Rev. B 37, 2349 (1988).
- Walz (2002) F. Walz, J. Phys.: Condens. Matter 14, R285 (2002).
- (14) The magnetization at 5 T and 20 K is times smaller than that reported in the sample of FeSe0.85 studied by Khasanov et al. Khasanov et al. (2008).
- Khasanov et al. (2008) R. Khasanov, K. Conder, E. Pomjakushina, A. Amato, C. Baines, Z. Bukowski, J. Karpinski, S. Katrych, H.-H. Klauss, H. Luetkens, et al., Phys. Rev. B 78, 220510(R) (2008).
- Carrington and Manzano (2003) A. Carrington and F. Manzano, Physica C 385, 205 (2003).
- Padamsee et al. (1973) H. Padamsee, J. E. Neighbor, and C. A. Shiffman, J. Low Temp. Phys. 12, 387 (1973).
- Tinkham (1975) M. Tinkham, Introduction to Superconductivity (McGraw-Hill, New York, 1975).
- Prozorov and Giannetta (2006) R. Prozorov and R. W. Giannetta, Superconductor Science and Technology 19, R41 (2006).
- Err (a) The normalized values, resulting from our least squares fits to the temperature dependence of using different models for the gap, are used as criteria to determine which model best describes the data.
- Kondo et al. (2008) T. Kondo, A. F. Santander-Syro, O. Copie, C. Liu, M. E. Tillman, E. D. Mun, J. Schmalian, S. L. Bud’ko, M. A. Tanatar, P. C. Canfield, et al., Phys. Rev. Lett. 101, 147003 (2008).
- Martin et al. (2009) C. Martin, M. E. Tillman, H. Kim, M. A. Tanatar, S. K. Kim, A. Kreyssig, R. T. Gordon, M. D. Vannette, S. Nandi, V. G. Kogan, et al., Phys. Rev. Lett. 102, 247002 (2009).
- Fesenko et al. (1991) V. Fesenko, V. Gorbunov, and V. Smilga, Physica C 176, 551 (1991).
- (24) SR cannot measure along a single crystallographic direction. The measurements are limited to mixed quantities, which here is .
- Err (b) The error in is the statistical error arising from the fit to the data using the model described in the text. The error quoted does not take into account any systematic errors (e.g. vortex lattice disorder) that may be present in the data.
- Uemura et al. (1989) Y. J. Uemura, G. M. Luke, B. J. Sternlieb, J. H. Brewer, J. F. Carolan, W. N. Hardy, R. Kadono, J. R. Kempton, R. F. Kiefl, S. R. Kreitzman, et al., Phys. Rev. Lett. 62, 2317 (1989).
- Luetkens et al. (2008) H. Luetkens, H.-H. Klauss, R. Khasanov, A. Amato, R. Klingeler, I. Hellmann, N. Leps, A. Kondrat, C. Hess, A. Köhler, et al., Phys. Rev. Lett. 101, 097009 (2008).
- Dong et al. (2009) J. K. Dong, T. Y. Guan, S. Y. Zhou, X. Qiu, L. Ding, C. Zhang, U. Patel, Z. L. Xiao, and S. Y. Li, Phys. Rev. B 80, 024518 (2009).
- Subedi et al. (2008) A. Subedi, L. Zhang, D. J. Singh, and M. H. Du, Phys. Rev. B 78, 134514 (2008).
- Sonier et al. (1999) J. E. Sonier, J. H. Brewer, R. F. Kiefl, G. D. Morris, R. I. Miller, D. A. Bonn, J. Chakhalian, R. H. Heffner, W. N. Hardy, and R. Liang, Phys. Rev. Lett. 83, 4156 (1999), and references therein.