E787 Collaboration
Measurement of the Branching Ratio
Abstract
A measurement of the decay has been performed with the E787 detector at Brookhaven National Laboratory. Forty events were observed in the signal region with the background expectation of events. The branching ratio was measured to be in the kinematic region MeV and , where is the energy of the emitted photon and is the angle between the muon and the photon in the rest frame. The results were consistent with theoretical predictions.
pacs:
13.20.Eb,12.39.FeI Introduction
A measurement of the decay () has been performed using the E787 apparatus e787web at the Alternating Gradient Synchrotron (AGS) of Brookhaven National Laboratory. This decay is due to radiative effects in the semi-leptonic transition of decay (). The decay can proceed via inner bremsstrahlung (IB) in which a photon is emitted from the charged particle in the initial or final state, and structure-dependent radiative decay (SD) which involves the emission of a photon from the intermediate states in the hadronic transition from to . For hadron decays in the energy region below 1 GeV, the effective-field approach based on chiral symmetry, chiral perturbation theory (ChPT) ChPT , is applicable Holstein90 . At in ChPT, a partial branching ratio MeV and , where is the energy of the emitted photon and is the angle between the muon and the photon in the rest frame, is predicted to be BEG-DAFNE ; BEG93 . The relative size of SD contribution is around 8 %.
The first search for , which was performed in 1973 Ljung73 with decays at rest in a heavy-liquid bubble chamber, obtained MeV at the 90% confidence level (C.L.). The decay in flight was studied by the ISTR+ spectrometer; the ratio for the region MeV was found to be ISTR . Based on this value, the Particle Data Group cited MeV as PDG08 . The decay at rest was studied with the toroidal spectrometer of the E246 and E470 experiments at the KEK 12-GeV proton synchrotron; the MeV and was found to be Shimizu06 .
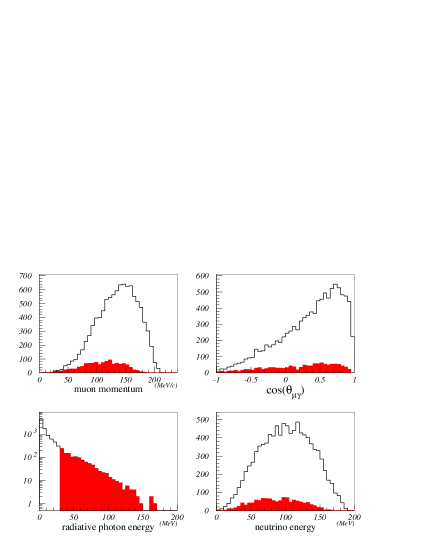
In this paper, we present results from the E787 experiment at the AGS. We describe the analysis we have performed to observe the decay and the measurement of the partial branching ratio MeV and . We compare our results to the predictions of ChPT at . The MeV was also determined and can be compared with the previous result. The spectra of observables based on ChPT at BEG-DAFNE ; BEG93 are shown in Fig. 1 and are consistent with the spectra given in Tviol2 .
II Detector
E787 was a rare kaon-decay experiment studying E787-959697 ; E787-pnn2 ; E787-98 and related decays E787-kp2g ; E787-bypro using decays at rest. The data for the measurement were acquired during the 1998 run E787-98 of the AGS, using kaons of 710 MeV/ incident on the E787 apparatus at a rate of about 4 MHz. Two stages of electrostatic particle separation in the beam line LESB3 reduced the pion contamination at the E787 apparatus to 25%. The incident kaons were detected and identified by a Čerenkov counter, multi-wire proportional chambers and a beam counter. After being slowed by a BeO degrader, 27% of the kaons came to rest in an active stopping target located at the center of the detector system e787det in a 1.0 Tesla solenoidal magnet (Fig. 2).

The 12-cm diameter target, which consisted of 0.5-cm square plastic scintillating fibers, provided initial tracking of the stopping kaon as well as the charged decay products. They passed through a 0.64-cm thick layer of plastic scintillation counters surrounding the target (I-counters). A radiation length () thick cylindrical drift-chamber UTC provided tracking information for momentum determination. The charged particles lost energy in an array of plastic scintillation counters called the Range Stack (RS), which provided a measurement of kinetic energy and range (equivalent cm of plastic scintillator) of the charged track. The RS was segmented into 24 azimuthal sectors and 21 radial layers, totaling one . The RS counters in the first layer (T-counters), which were 0.635-cm thick and 52-cm long, defined the solid angle acceptance for the charged track in the RS. The subsequent RS counters in the second layer (L2-counters) and beyond were 1.905-cm thick and 182-cm long. The RS counter in the sector and layer where the track came to rest was called the “stopping counter”. The RS counters were read out by phototubes attached to the upstream and downstream ends; the output pulse shapes were recorded by 500-MHz sampling transient digitizers (TDs) TD , which provided precise time and energy information for the hits in each counter.
Photons from kaon decays at rest in the target were detected by a hermetic calorimeter system surrounding the central region. The cylindrical barrel (BL) calorimeter, which was located immediately outside the RS and covered two thirds of the solid angle, was used to reconstruct and measure the three photons from the decay (i.e. two photons from the and the radiative photon). The BL calorimeter consisted of alternating layers of lead (0.1-cm thick) and plastic scintillator (0.5-cm thick) sheets, and about 29% of the electromagnetic shower energy was deposited in the scintillators. The BL was segmented azimuthally into 48 sectors and, in each sector, four radial groups of 16, 18, 20 and 21 lead-scintillator layers, respectively with increasing radius, formed BL modules totaling 14.3 . The modules were 190-cm in length along the beam axis. They were read out by phototubes attached to the upstream and downstream ends, and the outputs were recorded by time-to-digital converters (TDCs) and analogue-to-digital converters (ADCs). The two endcap calorimeters CsI , additional “collar” calorimeters for filling minor openings along the beam direction, and any active parts of the detector not hit by the charged track were used for detecting extra particles.
III Trigger
The signature of the decay was a kaon decay at rest with a charged track in the RS and three electromagnetic showers in the BL calorimeter. The kinetic energy of most of the muons from after requiring MeV and (Fig. 1) is less than 85 MeV; thus, we used the RS counters in the first six layers for the muon measurement. The RS counters in the 7th layer and beyond were used to detect extra particles or reject photons whose showers started before reaching the BL.
In the trigger for the decay, the “3 trigger”, a kaon was identified by a coincidence of hits from the Čerenkov counter, beam counter and target. To guarantee that the kaon actually decayed at rest, the timing of the outgoing particle (via the I-counters) was required to be at least 1.5 nsec later than the timing of the incoming kaon (via the Čerenkov counter). A positively charged track was required to have a coincidence of the hits from the I-counters, a T-counter and an L2-counter in the same RS sector (T2 sector), and from the counters in the 3rd or 4th RS layer in the T2 sector or in either of the next two clockwise sectors. The tracks reaching the 7th or 8th layer were rejected. With such trigger conditions, only tracks for which the RS stopping counter was located in the 3rd to the 6th layer, corresponding to the muons with momentum 100-160 MeV/, were accepted.
In order to count the number of showers in the BL calorimeter online, the analog sum of the outputs from 8 modules in two adjacent sectors, separately for the upstream and downstream ends, were accepted with a threshold corresponding to about 5 MeV of visible energy per end. The discriminator outputs were OR-ed for either end, and then fed into a logic unit. The number of showers was required to be equal to three or larger. An event was rejected online if the visible energy in the endcap calorimeters was more than 20 MeV, the energy in the RS sectors outside the region of the charged track was more than 10 MeV, or the energy in the RS counters from the 9th to 21st layers in any sector was larger than the level for minimum ionizing particles.
The 3 trigger was prescaled by five for taking data simultaneously with the trigger for . Approximately 6 events per slow-extracted beam (2.2-sec duration) from the AGS in every 4.2 sec were recorded. A total exposure of kaons entering the target available for the measurement was . A total of triggered events were collected.
Monte Carlo simulation was performed to generate samples of as well as other kaon decays at rest in the E787 detector system. The simulation package developed for E787 was comprised of the electromagnetic-shower simulation routines from EGS4 EGS4 , the routines to model other physics processes such as particle decays and charged-particle interactions in the detector elements, and the routines to simulate the trigger conditions. The events in the Monte Carlo samples can be analyzed with the same analysis codes for real data, except that the information on the pulse shapes in the digitizers and the information on the outputs from most of the beam instrumentation were not stored. The Monte Carlo simulation of E787 is described in pnn1full .
IV Event reconstruction
IV.1 Basic reconstruction
The charged track was reconstructed and measured with a standard algorithm used in the analysis of E787 described in pnn1full , except that the charged particle was assumed to be a muon and all the energy deposited in the RS stopping counter was attributed to the muon track coming to rest 111 In the track reconstruction, the presence of the additional 4 MeV deposit in the RS stopping counter due to the decay at rest was assumed and was subtracted from the observed energy.. The initial momentum was determined by correcting the momentum measured in the drift chamber for the energy loss suffered by the muon based on the observed track length in the target. The kinetic energy was determined by adding up the energy deposits of the muon track in the scintillators of the target and the RS, taking account of the energy loss in inactive materials such as wrapping and chamber materials. The range was calculated from the track length in the target and in the RS, and was used for muon identification in the analysis. Events were discarded if the momentum of the charged particle was larger than 190 MeV/. Many of the triggered events were due to the decay for which the had interactions within the RS counters before coming to rest; these events were easily rejected because the momentum (205 MeV/) was measured with the drift chamber.
The isolated showers in the BL calorimeter were reconstructed and the timing, energy and direction of the photons were measured with the same algorithm used in the analysis of E787 and E949 (the successor experiment to E787) pnn1full ; E949pnn1 ; E9491g ; E949pv ; E949pnn2 for kaon decays with photons in the final states E787-kp2g ; E787-bypro ; E9491g . The muon track in the RS defined the event time reference, and adjacent BL modules whose timing was within nsec of the track time and whose visible energy was more than 0.2 MeV were grouped into a “cluster”. In each module, the energy was measured as the geometrical mean of the visible energies divided by the calibrated visible fraction () in the upstream and downstream ends. The hit position in the end view of the detector was determined by the segmentation of the modules; the hit position along the beam axis () was measured from the end-to-end time and energy differences. The location of the shower in the BL was obtained by taking an energy-weighted average of the hit positions in the same cluster and, in conjunction with the kaon decay vertex position in the target, the azimuthal angle and the polar angle with respect to the beam axis were determined for each photon. In the analysis, if two showers were separated by less than 55 cm and the energy of one of them was less than 25 MeV, they were combined to a single shower in order to avoid misidentifying a part of an electromagnetic shower to be a separate one. Events were discarded unless three or four showers were observed in the BL calorimeter.
IV.2 Primary selection
Selection criteria (“cuts”) were imposed to make sure that the trigger conditions were satisfied and the kaon in the initial state and the muon and photons in the final state were reconstructed within the fiducial volume of the detector system. Furthermore, cuts on the timing and energy of the hits recorded in the Čerenkov counter, proportional chambers, beam counter and the target, including an offline delayed-coincidence cut which required nsec between the muon time and the kaon time measured in the target, were imposed to remove the events triggered by kaon decays in flight or by multiple beam particles into the detector. From the triggered events, events survived and were used in the subsequent analysis.
V Background sources
Kaon decays with a single charged track in the region 100-160 MeV/ and at least one in the final state, i.e., , (), (), () and (), are potential background sources. They are classified as follows:
- “-1”:
-
decays associated with an extra cluster in the BL due to accidental hits.
- “-2”:
-
decays associated with an extra cluster in the BL when the showers due to the two photons from were reconstructed as three showers.
- “”:
-
decay events in which the was misidentified as a muon or decayed in flight before it came to rest in the RS.
- “”:
-
decays for which the was misidentified as a muon, or decays with the misidentification and an extra cluster in the BL or a photon due to bremsstrahlung.
- “”:
-
decays in which the was misidentified as a muon or decayed in flight before it came to rest in the RS, and at the same time one of the four photons from two ’s was undetected.
Background due to multiple beam particles scattering into the detector simultaneously was found to be negligible.
In the subsequent two sections, the cuts to improve the signal-to-background and measure the background are described. The cuts were developed with the sample of real data prescaled by three and the Monte Carlo samples. The studies of these samples confirmed that the expected number of candidate events in the signal region was larger than the background expectation. The cuts were then imposed to the entire dataset.
VI Event selection
VI.1 Selection of the muon and three photons
For muon identification, a cut based on the measured range compared to that expected given the measured muon momentum was imposed. The measured range was also compared to the measured kinetic energy. Furthermore, to reject tracks in the RS, a set of cuts that checked the consistency between the measured energy and range in each of the RS counters, the cuts, were employed.
For the decay, events were discarded unless exactly three showers with MeV were observed in the BL calorimeter within nsec of the muon track time in the RS. The photon energy should also be sufficiently larger than the online energy threshold; since the threshold had been applied to the analog-sum signals separately for the upstream and downstream ends (Section III), the threshold level depended on the position of the shower in the BL. Thus the photon energy was required to be greater than 23 (66) MeV for the showers located at the edge (center) of the BL.
In order to remove the events with the photon due to bremsstrahlung of the track from the or decay within the RS, we calculated the angle between the direction of the hit position of the charged track at the RS T-counter from the center of the detector system and the direction of each of the photons from the kaon decay vertex position. The minimum of the angles should be larger than (“ bremsstrahlung” cut).
An extra photon could disappear through inefficiency due to very narrow gaps between counters or inactive material. Tight photon-detection requirements, the “photon veto” cuts, were imposed on the detector subsystems; hits in coincidence with the track time within a few nsec and with the energy above a threshold of typically 1 MeV were identified as the activity due to an extra photon. The photon veto cuts also ensured that only those events in which the total photon energy from the decay was deposited in the BL (and a part of the showers was not recorded in any other subsystem) were accepted.
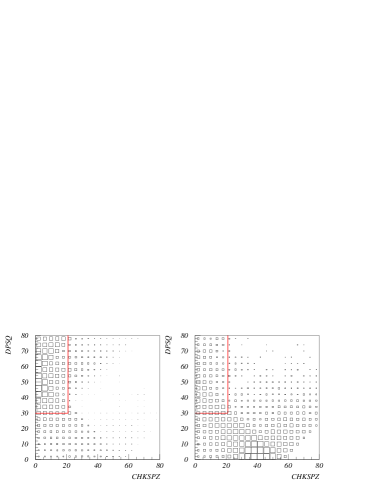
An extra photon could also go undetected when two electromagnetic showers in the BL overlapped each other and were reconstructed as a single cluster (“fused cluster”). In the Monte Carlo studies of , it was confirmed that the case with the overlap of two photons originated from the same was negligible; thus the other case, with the overlap of two photons from different ’s (“odd combination”), should be considered. We designed two variables and , described below, in which the fused cluster from was characterized. Suppose that one of the three reconstructed photons , and , e.g. , was the fused cluster and consisted of two photons and with the same azimuthal and polar angles and with the energies and , where was a parameter that varied from 0 to . A pair of invariant masses and and , where is the nominal mass of , were calculated as a function of . should be small when agreed with the correct value. In the same way, and were calculated supposing that and were the fused cluster, respectively. Finally, the minimum of , and with all the possible values of in each hypothesis, called in this analysis, was obtained. would be small if an event was from and one of , and was the fused cluster. On the other hand, the invariant masses of two out of the three reconstructed photons: , and were calculated, and the minimum of , and , called in this analysis, was obtained. If an event was from with odd combination, the invariant mass of other two photons should not be close to and thereby would be large. Figure 3 shows the vs. plots for the events and the background events (after imposing the BL cuts and the photon veto cuts) generated by the Monte Carlo simulation. To suppress the background, was required to be more than 30 MeV/ and was required to be less than 21 MeV/.
After imposing the cuts in this subsection, 4553 events survived.
VI.2 Kinematic fit
A least-squares fit was used to improve the resolution of the measured quantities. We assumed just one undetected particle (neutrino) in the final state. The kinematic fit was applied to thirteen observables with three constraints. The observables were the kinetic energy of the charged particle, the momentum vector of the charged particle, and the momentum vectors of three photons. The directions of momentum vectors were defined to be from the kaon decay vertex position. The constraints were:
-
•
The invariant mass of the total energy and momentum should be equal to the nominal mass of ,
-
•
The kinetic energy and momentum of the charged particle should be consistent with a muon hypothesis, and
-
•
The invariant mass of one pair of photons should be equal to .
There are three possible pairings of the three photons to form the ; the combination which minimized the of the global kinematic fit was chosen among the possible event topologies. In simulated decays, 86% of the events that survived all the selection criteria were reconstructed with the correct pairing.
The kinematic fit was also applied with the assumption of or decay. To identify the decay, the best combination of the two photons from the was chosen as in the case of the fit to the assumption, and the remaining photon was ignored. Figure 4(left) shows the invariant mass () distribution of the from the events. To identify the decay, the events in which four photons were observed in the BL calorimeter were used but the photon with the lowest energy was ignored; the best combination of two photons to form the was chosen so as to minimize the . Figure 4(right) shows the distribution of the from the events. The results were used to select the events for calibrations and to check the performance of Monte Carlo simulation. The resolutions used for the muon and the photons in the fit on the assumption, summarized in Table 1 and Table 2, were obtained from the studies of the events and the events, respectively.

| quantity | unit | resolution |
|---|---|---|
| kinetic energy | MeV | |
| momentum | MeV/ | |
| azimuthal angle | mrad | |
| polar angle | mrad |
| quantity | unit | resolution |
|---|---|---|
| energy | MeV | |
| azimuthal angle | mrad | |
| polar angle | mrad |
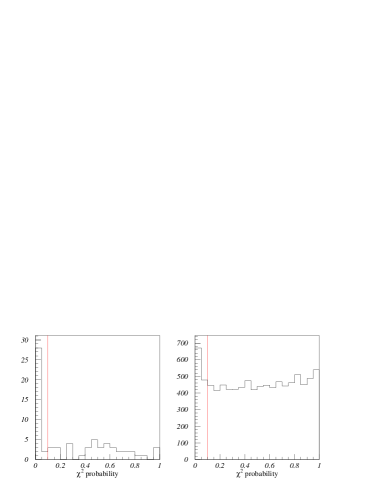
The probability of the kinematic fit on the assumption, , was required to be more than 10%. In order to suppress the -1 background, the events whose probability of the kinematic fit on the assumption, , was more than 10% were discarded. After imposing these probability cuts, 360 events survived.
VI.3 Signal region
The following cuts were applied to the fitted observables of the surviving events. The energy of the undetected particle (neutrino) in the final state, , should be larger than MeV to suppress the background. The invariant mass of the muon and neutrino was calculated and, in order to suppress the background events with decay in flight, the invariant mass was required to be larger than 200 MeV/. The polar angle of the neutrino momentum vector with respect to the beam axis should be larger than , to prevent a photon in the final state from escaping along the beam direction. After imposing these cuts, 178 events survived.
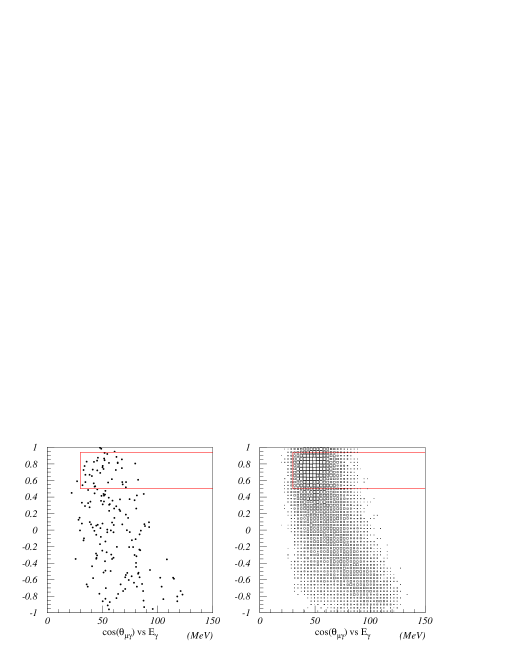
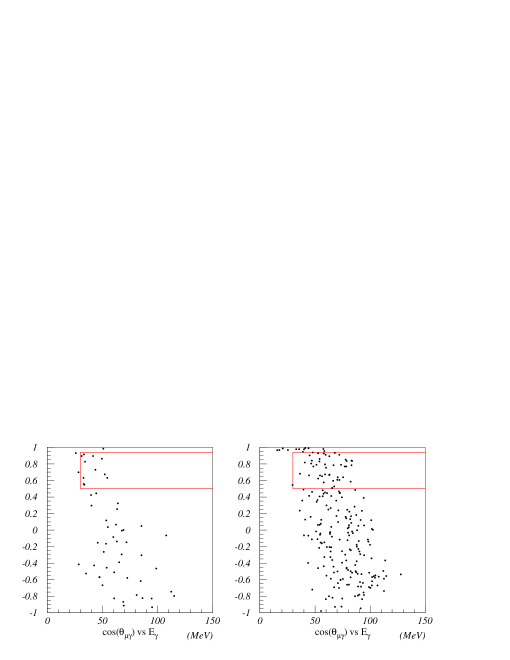
Figure 5 shows the cosine of versus plots of the events that survived all analysis cuts in real data and in Monte Carlo simulation. The signal region was specified with MeV and (). The cut was required to improve the proportion of the correct pairing to and to suppress the background. Figure 6 and Figure 7 show the distributions and the distribution of the , respectively, from the events in the signal region in real data and in Monte Carlo simulation. Forty events were observed in the signal region.

VII Background Expectation
The -1 background was studied with real data from the 3 trigger. We used the timing of the photons relative to the muon track time, . The distributions of the two photons to form the and of the radiative photon, after imposing all the offline cuts except for the timing cut to the photons ( nsec in Subsection VI.1), are shown in Figure 8. Figure 9(left) shows the versus plot of the events with a photon in the interval nsec nsec in real data; the number of events in the signal region in Fig. 9(left) was 11. Assuming that the timing distribution of the BL cluster due to accidental hits was constant, the background level of -1 was estimated to be nsecnsec events.

Since it was difficult to isolate samples of the -2 and backgrounds from the real data, these backgrounds were studied with the samples generated by Monte Carlo simulation. The background level of -2 was estimated to be events at the 90% C.L. and was omitted from the background estimate. The background level of was estimated to be events.
The background was studied with the real data. The cuts were inverted to enhance the track events, but no event was left after imposing all the other analysis cuts. After taking into account the rejection of the cuts on tracks as well as the tagging efficiency of the inverted cuts, the background level was estimated to be events at the 90% C.L. The background level of was omitted from the background estimate.
The background was studied with the real data, in particular with the muon identification cuts and the cuts to detect the extra photon. The studies of photon disappearance through the inefficiency of the BL, the inefficiency of the other subsystems, and the fused cluster in the BL were made with the BL cuts, the photon veto cuts, and the and cuts, respectively. Figure 9(right) shows the versus plot of the events after imposing the inverted BL photon-veto cut (detection of the activity due to an extra photon in the BL calorimeter) in real data. The number of events in the signal region in Fig. 9(right) was 45 and, after taking into account the rejection of the offline BL photon-veto cut as well as the tagging efficiency of the inverted cut, the background level due to the inefficiency of the BL was estimated to be events. With the similar method, the background levels due to the inefficiency of the other subsystems and due to the fused cluster in the BL were estimated to be events and events, respectively. The background level of was events in total.
The background levels are summarized in Table 3. In total, background events were expected in the signal region.
| Source | Background level | Samples |
|---|---|---|
| -1 | Data | |
| -2 | (90% C.L.) | MC |
| MC | ||
| (90% C.L.) | Data | |
| Data | ||
| Total | 16.52.7 |
VIII Sensitivity
The acceptance factors for the selection criteria in this measurement (Table 4) were estimated primarily from Monte Carlo simulation. We generated the sample at in ChPT with MeV, which was set to be lower than the offline criteria on the photon energy 222 Thus, the acceptance factors and the single event sensitivity in this section are for the decay in the kinematic region MeV. In Section IX, we will first obtain the partial branching ratio for in this kinematic region and then convert it into MeV and and MeV.. In the simulated events, the kinetic energy and momentum of the muon and the energy and position of the photons were smeared with deviates drawn from a Gaussian distribution to obtain measured resolutions on the observables (Table 1 and Table 2). The acceptance of the primary selection to the Čerenkov counter, proportional chambers, beam counter and the target (Subsection IV.2) and the acceptance loss by the accidental hits in the detector subsystems, in particular the loss due to the veto conditions in the trigger (Section III), were measured with data samples of decays and scattered beam pions, which were simultaneously accumulated by the calibration triggers. The total acceptance was and was dominated by the trigger acceptance.
| Acceptance factors | Samples | |
| Muon trigger component | ||
| (Section III) | 0.140 | MC |
| Photon trigger component | ||
| (Section III) | 0.00609 | MC |
| Primary selection | ||
| (Subsection IV.2) | 0.511 | MC, |
| Selection of muon and photons | ||
| (Subsection VI.1) | 0.220 | MC |
| Kinematic fit | ||
| (Subsection VI.2) | 0.275 | MC |
| Cuts after the kinematic fit | ||
| (Subsection VI.3) | 0.649 | MC |
| Signal region | ||
| (Subsection VI.3) | 0.351 | MC |
| Accidental loss | ||
| (Section III and Subsection VI.1) | 0.669 | , |
| Total acceptance |
The single event sensitivity () for was derived from the total acceptance, the total exposure of kaons entering the target ( in Section III), and the fraction of kaons entering the target that decayed at rest (called the stop efficiency, ). was measured to be with the events of the IB component of the decay, which were collected with the 3 trigger and selected 333 The triggered events were further prescaled by eight, and were reconstructed with the assumption that the charged track was a . After imposing primary cuts, identification cuts, photon selection cuts and photon veto cuts, the kinematic fit with the assumption of the decay was applied. The missing energy should be smaller than MeV, and the momentum should satisfy MeV/. A total of 2425 events survived, with the background expectation of %. The contribution from the direct photon-emission component of the decay was estimated to be 2.2%. with the method used in the analysis of E787 E787-kp2g ; Tsunemi . Thus, the sensitivity for was normalized to 444 The theoretical prediction for the IB component of the branching ratio in the kinetic energy region of 55 to 90 MeV, DMS-DAFNE , was used in this analysis. The Particle Data Group average, PDG08 , confirmed this value. and many systematic uncertainties in the acceptance factors canceled. was also measured with the events collected with the 3 trigger, and the results were consistent. We obtained .
| Estimated systematic uncertainties | (%) |
|---|---|
| BL visible fraction | |
| BL measurement | |
| bremsstrahlung cut | |
| Resolution in and | |
| Resolution in | |
| Resolution in photon position | |
| Monte Carlo statistical uncertainty | |
| Total systematic uncertainty |
The systematic uncertainties in were due to:
-
•
The BL calibration of the visible fraction and measurement, to which the photon selection (Subsection VI.1) was sensitive,
-
•
The difference, between real data and Monte Carlo simulation, in the distributions of the variables to select the muon and three photons, in particular the variable on the bremsstrahlung cut (Subsection VI.1), and
-
•
The smearing of the observables in the Monte Carlo events when the kinematic fit was applied.
The systematic uncertainties were studied from the observed sensitivity variation as each corresponding parameter was varied over the range that had not been excluded in the calibration. The statistical uncertainty of the Monte Carlo simulation in estimating the acceptance was also included. The systematic uncertainties are summarized in Table 5. By adding them in quadrature, the total systematic uncertainty was estimated to be .
IX Results and Conclusions
From the 40 observed events in the signal region, after subtracting the expected background () we obtained events with the statistical uncertainty of 29%. With , the partial branching ratio for in the kinematic region MeV was . The kinematic distributions of the observed 40 events were compared to the spectra predicted from the decay plus all the background contributions, as shown in Fig. 10. The degree-of-freedom values to evaluate the match between data and predictions were , , and in the distributions of , energy, and muon momentum, respectively.

The factors and , estimated from the theoretical spectrum at in ChPT, are used to convert the measured partial branching fraction into MeV and and MeV, respectively. Finally, the results of the measurement were:
| MeV and |
and
| MeV |
| . |
The MeV and was consistent with the theoretical prediction BEG-DAFNE ; BEG93 as well as with the previous measurement in Shimizu06 , and the MeV was consistent with the previous measurement in PDG08 . The results of the E787 measurement provide better precision than the previous results.
Acknowledgments
We acknowledge the contributions made by colleagues who participated in earlier phases of the E787 experiment, including M. Atiya, T.F. Kycia(deceased), D. Marlow, and A.J.S. Smith. We gratefully acknowledge the dedicated effort of the technical staff supporting this experiment and of the Brookhaven Collider-Accelerator Department. This research was supported in part by the U.S. Department of Energy under Contracts No. DE-AC02-98CH10886, No. W-7405-ENG-36, and Grant No. DE-FG02-91ER40671, by the Ministry of Education, Culture, Sports, Science and Technology of Japan through the Japan-US Cooperative Research Program in High Energy Physics and under the Grant-in-Aids for Scientific Research, for Encouragement of Young Scientists and for JSPS Fellows, and by the Natural Sciences and Engineering Research Council and the National Research Council of Canada.
References
- (1) http://www.phy.bnl.gov/e787/e787.html .
- (2) J.F. Donoghue, E. Golowich, and B.R. Holstein, Dynamics of the Standard Model (Cambridge Univ. Press, Cambridge, 1992), and references therein.
- (3) B.R. Holstein, Phys. Rev. D 41, 2829 (1990).
- (4) J. Bijnens, G. Ecker, and J. Gasser, in DANE Physics Handbook, edited by L. Maiani, G. Pancheri, and N. Paver (Laboratori Nazinali di Frascati, Frascati, 1992).
- (5) J. Bijnens, G. Ecker, and J. Gasser, Nucl. Phys. B 396, 81 (1993).
- (6) D. Ljung and D. Cline, Phys. Rev. D 8, 1307 (1973).
- (7) O.G. Tchikilev et al., arXiv:hep-ex/0506023, Phys. Atom. Nucl. 70, 29 (2007).
- (8) Particle Data Group, C. Amsler et al., Phys. Lett. B 667 1 (2008).
- (9) S. Shimizu et al., Phys. Lett. B 633 190 (2006).
- (10) V.V. Braguta, A.A. Likhoded, and A.E. Chalov, Phys.Rev. D 65 054038 (2002). The spectra of observables are shown in the figure 3.
- (11) S. Adler et al., Phys. Rev. Lett. 79, 2204 (1997); S. Adler et al., ibid. 84, 3768 (2000).
- (12) S. Adler et al., Phys. Lett. B 537, 211 (2002); S. Adler et al., Phys. Rev. D 70, 037102 (2004).
- (13) S. Adler et al., Phys. Rev. Lett. 88, 041803 (2002).
- (14) S. Adler et al., Phys. Rev. Lett. 85, 4856 (2000).
- (15) S. Adler et al., Phys. Rev. Lett. 85, 2256 (2000); S. Adler et al., Phys. Rev. D 63, 032004 (2001); S. Adler et al., ibid. 65, 052009 (2002).
- (16) J. Doornbos et al., Nucl. Instrum. Methods Phys. Res. A 444, 546 (2000).
- (17) M.S. Atiya et al., Nucl. Instr. Meth. Phys, Res. A 321, 129 (1992).
- (18) E.W. Blackmore et al., Nucl. Instr. Meth. Phys, Res. A 404, 295 (1998).
- (19) M.S. Atiya et al., Nucl. Instr. Meth. Phys, Res. A 279, 180 (1989).
- (20) I-H. Chiang et al., IEEE Trans. Nucl. Sci. NS-42, 394 (1995); T.K. Komatsubara et al., Nucl. Instr. Meth. Phys, Res. A 404, 315 (1998); D.A. Bryman et al., ibid. 396, 394 (1997).
- (21) W.R. Nelson et al., SLAC Report No. SLAC 265 (1985).
- (22) S. Adler et al., Phys. Rev. D 77, 052003 (2008).
- (23) V.V. Anisimovsky et al., Phys. Rev. Lett. 93, 031801 (2004).
- (24) A.V. Artamonov et al., Phys. Lett. B 623, 192 (2005).
- (25) A.V. Artamonov et al., Phys. Rev. D 72, 091102(R) (2005).
- (26) A.V. Artamonov et al., Phys. Rev. Lett. 101, 191802 (2008); A.V. Artamonov et al., Phys. Rev. D 79, 092004 (2009).
- (27) T. Tsunemi, Ph.D. Thesis, University of Tokyo, 2005.
- (28) G. D’Ambrosio, M. Miragliuolo, and P. Santorelli, in DANE Physics Handbook, edited by L. Maiani, G. Pancheri, and N. Paver (Laboratori Nazinali di Frascati, Frascati, 1992).