Blasts and shocks in the disc of NGC 4258
Abstract
We present integral field spectroscopic observations of the central region of the active galaxy NGC 4258 obtained with the fibre IFU system INTEGRAL. We have been able to detect cold neutral gas by means of the interstellar NaD doublet absorption and to trace its distribution and kinematics with respect to the underlying disc. The neutral gas is blue-shifted with projected velocities in the 120–370 km/s range. We have also detected peculiar kinematics in part of the ionized gas in this region by means of a careful kinematic decomposition. The bipolar spatial distribution of the broader component is roughly coincident with the morphology of the X-ray diffuse emission. The kinematics of this gas can be explained in terms of expansion at very high (projected) velocities of up to 300 km/s. The observations also reveal the existence of a strip of neutral gas, parallel to the major kinematic axis, that is nearly coincident with a region of very high [SII]/H ratio tracing the shocked gas. Our observations are consistent with the jet model presented by Wilson et al. (2001) in which a cocoon originating from the nuclear jet is shocking the gas in the galaxy disc. Alternatively, our observations are also consistent with the bipolar hypershell model of Sofue (1980) and Sofue & Vogler (2001). On balance, we prefer the latter model as the most likely explanation for the puzzling features of this peculiar object.
keywords:
galaxies: individual: NGC 4258 – galaxies:ISM – ISM: jets and outflows.1 Introduction
The nearby spiral galaxy NGC 4258 (M106) is a particularly interesting galaxy. It presents two peculiarities that have been the cause of many studies of this object: the confirmation of the existence at its centre of a massive black hole, detected in 1995 through measurements of high speed motions in the water masers (Miyoshi et al. (1995)), and the existence of the mysterious anomalous arms discovered in the optical by Courtès & Cruvellier (1961) and in radio by van der Kruit et al. (1972). As we shall see below, it is indeed not unlikely that both phenomena are closely related.
These anomalous arms are two large arm-like gaseous structures of uncertain origin that extend through most of the visible disc of the galaxy. There have been several possible explanations for the origin of these arms, most of which can be traced back to three distinct possibilities: (a) expelled gas from the nucleus in the plane, either in a ballistic (van der Kruit et al. (1972), van Albada (1978), van Albada & van der Hulst (1982)) or a jet model (Ford et al. (1986), Cecil et al. (1992)), (b) a bar-induced shock front (Cox & Downes (1996)), and (c) gas expelled out of the plane either in a jet, hypershell, etc. (Sofue (1980), Sanders (1982), Sofue & Vogler (2001)). There are indeed many observational features that have to be explained by any suitable model (see for example the excellent works by Cecil et al. (2000) and Wilson et al. (2001) including a plethora of optical, radio and X-ray data).
The morphology of the anomalous arms can be greatly influenced by projection effects. Although it is pretty well established that the inner parts of these arms are in the disc plane, it is not known for certain whether the arms are three dimensional structures seen in projection (and enhanced by a limb-brightening effect), or if they are indeed mostly contained in a plane (and if this is the case, the orientation of this plane). On the other hand, the highly distorted kinematics that appear in the innermost region of the galaxy also imposes restrictions on the possible scenarios.
The galaxy NGC 4258 has an inclination of about 60–64∘, and a position angle of 146–160∘ (cf. Jarrett et al. (2003), Cecil et al. (1992)). The strong absorption below the major axis shows clearly that the region located SW of the major axis is the near side of the galaxy, the one on the NE being the far side.
The most relevant observational facts are: a) the anomalous arms are made up of hot gas that has been shock excited; b) the radio emission of the innermost region shows a clear jet (nearly in the N–S direction), perpendicular to the maser disc around the black hole (The maser disc is actually tipped down some 8∘ from edge on [see Herrnstein et al. (1997)], meaning that the northern jet is pointing toward us while the southern one is pointing away from us); c) the NW (SE) arm lies behind (in front of) the galaxy disc; and d) the inner section of the anomalous arms is roughly straight and it is roughly aligned with the major axis of the galaxy.
From the several scenarios that have been proposed to explain the observational facts, the model that seems to be favoured by the latest observations in X-rays (Yang et al. (2007)) is the one proposed by Wilson et al. (2001)) in which a jet moving away from the disc induces strong shocks in the disc plane giving rise to the anomalous arms.
We have made new observations of the inner region of NGC 4258 with an integral field spectrograph. These new observations will provide new kinematic and morphological information that will permit us to put the available models to the test.
2 Observations, and data reduction and analysis
The data analysed in this paper were obtained on 2002 March 16 at the Observatorio del Roque de los Muchachos on the island of La Palma with the INTEGRAL fibre system (Arribas et al., 1998) in combination with the WYFFOS fibre spectrograph (Bingham et al., 1994) at the William Herschel Telescope. Weather conditions during observations were fairly good, with an average seeing of 1.3 . The data were obtained with INTEGRAL standard bundles SB3 and SB2, and the WYFFOS spectrograph was equipped with a 1200 groove grating centred on 6247 . With these settings, the field of view is and respectively for the SB3 and SB2 bundles. The spectral resolution is 4.8 (R 1300) for the SB3 bundle and 2.8 (R 2200) for the SB2 bundle. The observed spectral range (5600–6850 ) contains a few strong interstellar emission lines (, [NII], [SII]), as well as several stellar absorption lines (NaD doublet and weaker, mostly blended FeI and CaI lines). Three exposures of 1200 s were taken for each fibre bundle. Standard data reduction for 2D spectroscopic data (bias correction, flat-fielding, extraction of spectra, wavelength calibration, sky subtraction, etc.) was performed (e.g. Arribas et al. (1991), Mediavilla et al. (1992)). The final wavelength calibration has uncertainties of 0.15 or 7 km/s at 6500 .
In order to separate the stellar and interstellar contribution to the spectra, each spectrum is fitted using a synthetic stellar population as a template. The regions in the spectrum which are obviously contaminated by interstellar emission and/or absorption (namely , [NII], [SII] and NaD) are not included in the fit. After some testing, we have finally used a population of solar metallicity with an age of 1 Gyr from the synthetic population library by Delgado et al. (2005), which covers the observed wavelength range at a very high spectral resolution (0.3 Å). Using populations with a slightly different age and/or metallicity do not seriously affect the results. We would like to point out that we do not intend a thorough analysis of the stellar populations in this region, but just to be able to subtract the stellar contribution from the observed spectra. As a by-product we obtain a stellar velocity, velocity dispersion and a global strength for the stellar lines at each fibre position. More details on this procedure and the general reduction process can be found in (Castillo-Morales et al., 2007) and Jiménez-Vicente et al. (2007).
Maps for several spectral features are built from the extracted spectra by mapping the extracted values at the fibre positions to a regular grid. The final images have 33 29 pixels (with a size of 0.95 arcsec/pixel) and 45 34 pixels (with a size of 0.35 arcsec/pixel) for the SB3 and SB2 bundles respectively. The resulting FOV are theferore of for the SB3 and for the SB2. Finally, astrometry was calculated for the maps by using the position of the nucleus and bright HII regions in the FOV.
3 Morphology and kinematics
The optical images of this galaxy show very clearly that heavy absorption is taking place in the (near side) SW part of the galaxy (see for example fig. 6 in Cecil et al. (2000)). It is very important to bear this fact in mind when interpreting the observations presented in this paper, particularly for the different effect it will have on the emission and absorption lines.
The observed spectra show a few interesting emission lines from the ISM, namely , [NII], [SII] and [OI].
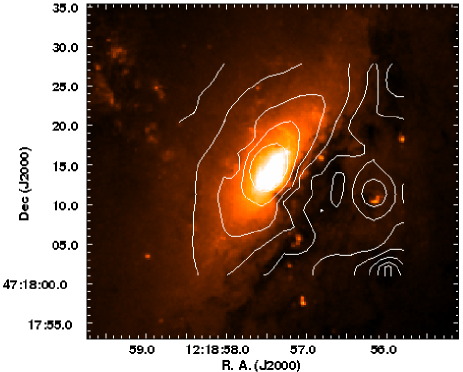
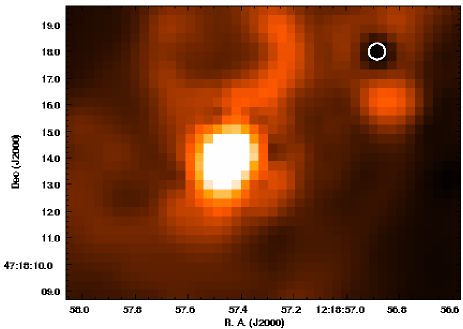
The distribution of intensity from the SB3 and SB2 bundles matches exceptionally well the features seen in the HST image taken by the ACS with the narrow F658N filter (see Fig. 1). In order to compare both, we have generated a synthetic F658N image from our data by integrating the spectra with the wavelengths weighted with the transmission curve of that filter. The image and contours show the above-mentioned strong absorption to the SW of the nucleus. In the (continuum-free) image from the SB2 (with higher spatial resolution), the northern nuclear loop first detected by Cecil et al. (2000) stands out even more clearly than in images from the HST (see Fig. 2). In our continuum-free image, the contrast between the E and W sides of the loop seems weaker than in Cecil et al. (2000).
There is even a hint of a southern counterpart of this loop in the asymmetric morphology below the nucleus, although severe obscuration by dust in this region makes it impossible to confirm. The nature of the loop(s) remains unclear. A possible origin is that they are gas bubbles originating from the interaction of the jet with the dense ISM, as proposed by Cecil et al. (1992). The velocity structure of the ionized gas, showing an asymmetry roughly along the N–S line, supports a connection with the jet. On the other hand, the line ratios at those locations are not indicative of shocks. Thus, the possibility of the loop(s) being the edges of an ionization cone, as proposed in Cecil et al. (2000) is also very attractive.
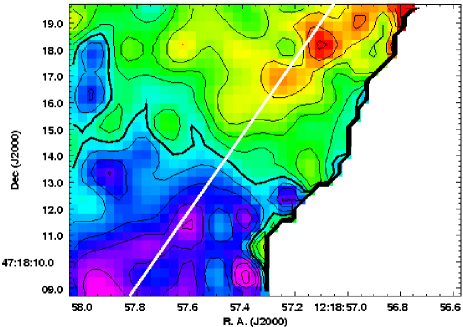
The velocity field in Fig. 3 shows the rotation pattern of the stars. A big area in the SW part of the FOV has been masked because the low S/N in the spectra induced by the high extinction in this region does not allow us to calculate a reliable velocity.
Even for the SB3 bundle, the FOV is quite small, and the velocity field of the ionized gas is too distorted to calculate a rotation model for the disc. We will therefore use the velocity field for the stars to subtract the rotating pattern of the galaxy from the gas components in order to generate residual velocity fields. Obviously, there will be differences between the rotating pattern of the stars and the gas (namely the asymmetric drift). We do expect these differences to be small enough for our purposes and, in any case, we will be very cautious when interpreting the residual velocity fields.
3.1 Neutral gas distribution and kinematics
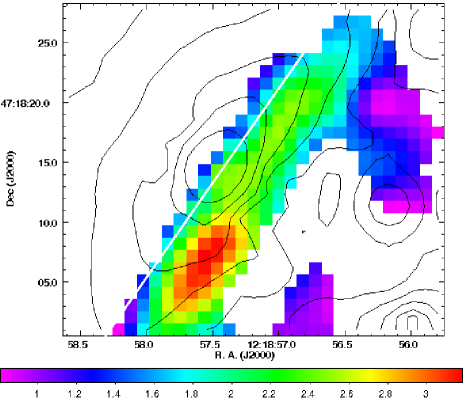
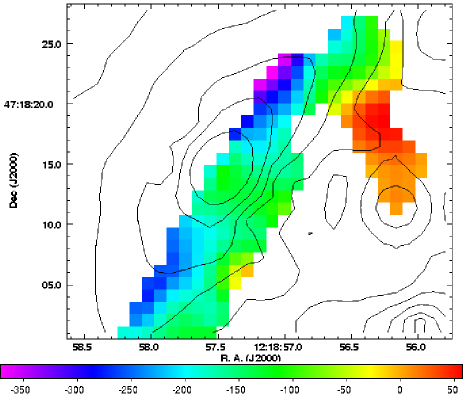
In this section we address the distribution and kinematics of the interstellar neutral gas. In Fig. 4 we present the distribution of the neutral gas detected by means of the equivalent width of the NaD doublet. In Fig. 5 we show the residual velocities obtained by subtracting the stellar velocity map from the NaD velocity map. In the map of the equivalent width we can see a strip parallel to the major geometrical axis of the disc starting at the nucleus and extending some 15 arcsec to each side of the nucleus. This strip nicely traces the neutral gas of the near side of the galaxy that is absorbing the light coming from the stellar disc. Of course, this is not all the neutral gas, but only the one that can be detected in absorption (we cannot see the neutral gas on the far side of the galaxy, nor can we see the neutral gas in the more extinguished region on the nearest side for the same reason). Even with this obvious limitation, the detected distribution of cold neutral gas roughly resembles the distribution of molecular gas as seen in CO observations (cf. Sawada-Satoh et al. (2007)).
Figure 5 shows the velocity of the neutral gas with respect to the underlying disc obtained by subtracting the stellar velocity map from the velocity map of the neutral gas. Again, the morphology of the map resembles the residual maps obtained from CO observations by Sawada-Satoh et al. (2007), but in our case the residual velocities are much higher. The detected neutral gas has huge residual velocities in the to km/s range with respect to the stellar disc. Although Sawada-Satoh et al. (2007) have proposed a warped disc with expansion to explain their data, we favour an alternative scenario to explain our detected morphology and kinematics of the neutral gas. In our opinion our data seem to indicate that the detected neutral gas (which is on the near side of the galaxy) it is most probably moving radially outwards from the galaxy centre. We will elaborate a bit more on this scenario later on.
3.2 Kinematic anomalies and physical conditions of the ionized gas
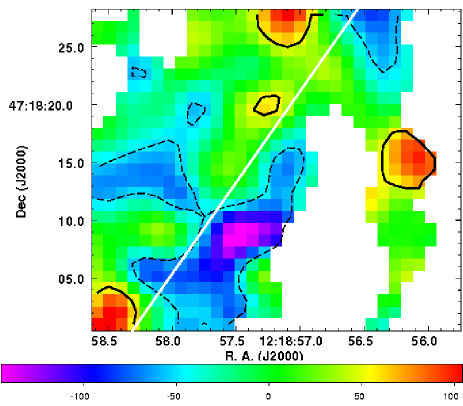
Comparing the velocity maps of the ionized gas (see Fig. 6) with the stellar velocity field, we can see two conspicuous protrusions: one with receding velocities on the approaching side, and vice versa, roughly aligned at PA 145∘. This strong disturbance of the velocity field is caused by a kinematically distinct system of ionized gas that deviates from simple galactic rotation. We found direct evidence of this ionized gas of peculiar kinematics in the collection of spectra taken with the smaller SB2 bundle that provides higher spectral resolution. We find many spectra in which the ionized lines split into two or more components with separations, in some cases, of more than 200 km/s. This line splitting was first reported by Rubin & Graham (1990) and an analysis was afterwards performed by Cecil et al. (1992), who detected a braided jet structure.
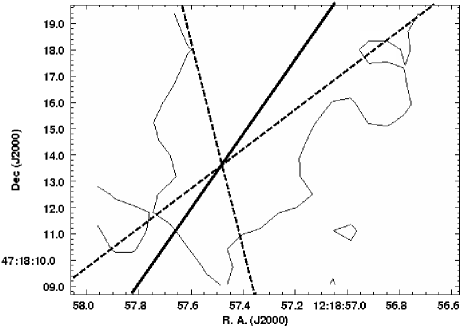
In order to attempt the identification of different gaseous systems in the area covered by our observations, we have made a multi-component fit in the line of Cecil et al. (1992) based on the following assumptions: (i) there are two main kinematic systems of ionized gas, (ii) the broadening of the two components may be different, and (iii) the velocity of the two components is fairly different. Thus, we simultaneously fit the two components to the N[II], SII and H emission lines. We accept the presence of two components when the goodness of the fit exceeds the goodness of the fit to a single component by 30%. Despite the intrinsic difficulties of this process and the peculiarities of this galaxy (e.g. in many cases the lines are not completely split, or there are obviously more than two components) which prevent the determination of reliable velocity maps for both kinematic components (as was achieved by Jiménez-Vicente et al. (2007) for a different object), it has been possible to identify consistently two main kinematic components at many locations throughout the FOV. The kinematics of the first one, which we identify with the gas in the galaxy disc,are not very different from that of the stars. The other component, shows most peculiar, nearly counter-rotating kinematics. The locations of the spectra where this anomalous component is identified are represented in Figure 7. We have chosen not to show the intensities, but only a sketch of the locations where two distinct kinematic components have been distinguished. Intensities and velocities in both components may be seriously affected by the difficulties mentioned above, but locations where there is more than one component can be more reliably detected. It must be pointed out that there still might be some locations where there are two or more components which have not been detected by our procedure, particularly in the more extinguished region to the south. This figure shows that this perturbed ionized gas component has a bipolar morphology. The northern region is somewhat inclined westwards, roughly between the (nearly vertical) axis defined by the jet and the major axis, and the southern part, is roughly eastwards from the (N–S) jet axis. The existence of a southern counterpart for the northern Loop as mentioned in Section 3 is also hinted by this figure.
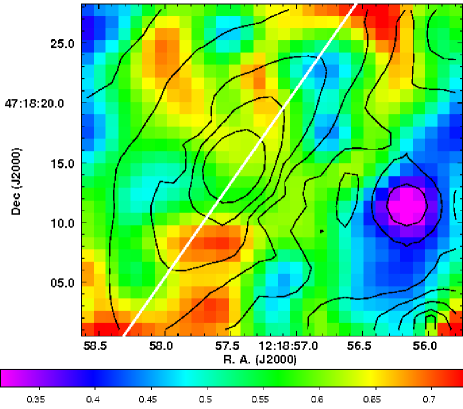
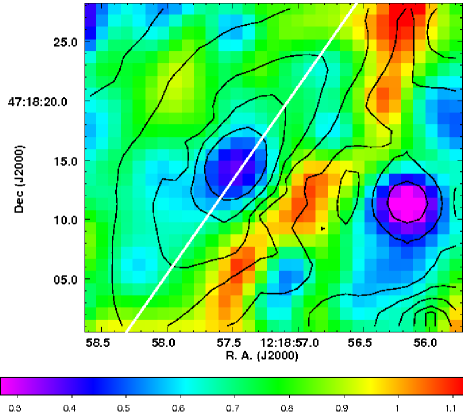
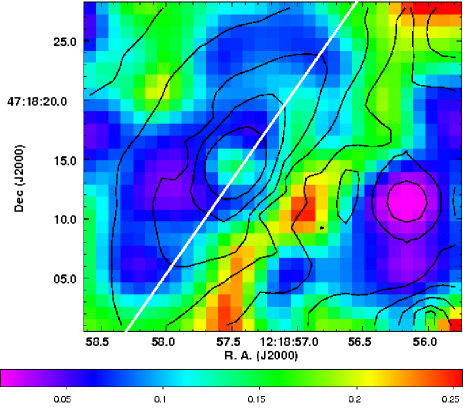
In Figs. 8, 9 and 10 the maps corresponding to the [NII]/H, [SII]/H and OI/H emission line ratios are presented. According to these maps the central region has relatively low [NII]/H, [SII]/H and OI/H emission line ratios. Taking into account the high [OIII]/H measurements of Cecil et al. (1995), our maps are consistent with photoionization as the main ionizing source for the central region, most probably induced by the Seyfert nucleus. Surrounding this central region towards the west there are several regions of very high [SII]/H and OI/H emission line ratios forming an elongated strip almost parallel to the major geometric axis. There is also a region with high ratios on the other side of the nucleus, suggesting a ring-like structure for the shocked gas. Shocks are the main cause of ionization of the gas in this strip/ring (front of shock). The border of the ionized gas component with peculiar kinematics overlaps with this shock front in the NW. Although shock-excited gas has been previously reported (cf. Rubin & Graham (1990) or Cecil et al. (1995)) we have been able to map the distribution of this shock ionized gas.
4 Discussion
Among the variety of models proposed to describe the peculiar features of NGC 4258 that we have mentioned in Section 1, we will discuss two: (a) the model described by Wilson et al. (2001), which explains the anomalous arms as dense gas in the disc shocked by gas driven onto the disc by the out-of-plane cocoon generated by the jets, and which seems favoured by the latest X-ray observations (cf. Sawada-Satoh et al. (2007)); and (b) the bipolar hypershell model as described by Sofue & Vogler (2001). Both models may be supported by the present observations.
4.1 Jet-driven shocks in the galaxy disc
In Fig. 7 we can see that the bipolar component of the ionized gas with peculiar kinematics lies roughly in the region between the N–S direction defined by the jet axis and the geometric major axis. This is the expected morphology in the scenario in which a cocoon of gas driven out of the plane by the jet is being blasted against the ISM disc (see Wilson et al. (2001) and references therein). The bipolar component is mainly photoionized (most probably by the Seyfert nucleus) but its western border overlaps with the front shock detected in the [SII]/H (see Fig. 9). This supports the notion that photoionized gas driven by the jet component is shocking with the ISM disc forming a hot cocoon/interface. According to this model, the front shock could trace the inner part of the anomalous arms. To complete the picture, the observed kinematics of the bipolar component of ionized gas (towards the blue in the NW and towards the red in the SE) will fit in this scheme if the cocoon/interface is back-flowing. Qualitatively, the presence of radial outflows in the neutral gas blasted by the cocoon would also support this model.
4.2 The bipolar hypershell model
Sofue (1980) and Sofue & Vogler (2001) interpreted the anomalous arms as the enhanced emission from the edges of a dumbbell-shaped shell that is symmetric with respect to the plane of NGC 4258. The presence of a wind creating this structure is strongly supported by the detection of a very strong blueshift of the neutral gas emitters. This result is commonly accepted as solid evidence for a galactic wind, which is also supported by the existence of ionized gas systems of peculiar kinematics and the front shock. The main objection to Sofue’s bipolar hypershell model (van Albada & van der Hulst (1982)) is the lack of symmetry of the hypershells. Although in Sofue’s model the hypershells are generated by a starburst, the emission line ratios indicate that in NGC 4258 the entraining gas could be photoionized by the AGN. According to Veilleux et al. (2005) when the source powering the galactic wind is an AGN, asymmetries in the expanding shell are expected. This is particularly true in the case of NGC 4258, where the out-of-plane jet would intersect the bipolar hypershell in the NS (projected) direction. The interaction between jet and hypershell would destroy that part of the hypershell bubbles (or would prevent it to form if the jet was in action when the shell was developing). Therefore, in this scenario, the anomalous arms would be the surviving parts of the hypershell. Indeed, the morphology of the radio emission as shown in van Albada & van der Hulst (1982) and Cecil et al. (2000) strongly suggests this interpretation. The sharp outer edges of the anomalous arms with the diffuse emission on the inside is naturally explained in this scenario. The observational fact that the SE arm is behind the galaxy disc while the NW arm is in front of it (cf. Wilson et al. (2001)) also fits very naturally into this model. Finally, the nearly straight morphology of the radio emission in the innermost region shows that the jet is clearly dominant in this region, in contrast with the outermost region, which is shell dominated.
5 Conclusions
We have performed two-dimensional spectroscopic observations in the central region of NGC 4258 and have used these new data to test the available models for this peculiar object. The main results derived from the analysis of these new 2D spectroscopy observations of NGC 4258 are:
-
1.
The interstellar NaD absorption lines are strongly blueshifted. Comparison of the 2D velocity fields of the NaD with the stellar velocity field reveal that the blueshifted velocities are quite high, in the range km/s to km/s, and occur everywhere in the detected neutral gas on the near side of the galaxy disc (that is, the one that we can observe in absorption).
-
2.
The velocity map of the ionized gas appears to be strongly distorted. There is a component of ionized gas of bipolar morphology with peculiar, almost counter-rotating, kinematics.
-
3.
The [SII]/H and OI/H emission line ratio maps show a thin ring-like region of high values indicative of shocks surrounding the galaxy nucleus. The border of the bipolar ionized gas component overlaps this front shock on the near side of the galaxy.
The geometry of the bipolar ionized gas component and its partial overlapping with the front shock could fit into the model very well, in that hot gas driven by the jet blasts the ISM disc, giving rise to the anomalous arms. However, the radial motions of the ISM seem hard to explain by this model alone. This outflow, could be naturally interpreted in terms of the presence of the bipolar hypershell model (Sofue (1980) and Sofue & Vogler (2001)) in that the anomalous arms would be the enhanced emission from the edges of the shells. The lack of symmetry of the bubbles (lack of presence of the anomalous arms in the NE and SW) would be explained by the disruption caused by the jet in the regions where it intersects the bubbles.
Acknowledgments
We are grateful to the anonymous referee for his valuable comments which have led to an improvement in this paper. This paper has been supported by the “Secretaría de Estado de Política Científica y Tecnológica” (AYA2007-67625-C02-02) and by the “Consejería de Ciencia y T ecnología de la Junta de Andalucía” (FQM-108, P05-FQM-792). A. Castillo-Morales acknowledges support from the Juan de la Cierva Programme financed by the Spanish MICINN and from the Spanish Programa Nacional de Astronomía y Astrofísica under grant AYA2006-02358. This research has made use of NED which is operated by the JPL, Caltech, under contract with NASA. We have used observations made with the NASA/ESA HST, obtained from the data archive at the STScI. STScI is operated by the Association of Universities for Research in Astronomy, Inc. under NASA contract NAS 5-26555.
References
- Arribas et al. (1991) Arribas S., Mediavilla E., Rasilla J. L., 1991, ApJ, 369, 260
- Arribas et al. (1998) Arribas S. et al. 1998. Proc. SPIE, Vol. 3355, p.821. Optical Astronomical Instrumentation. D’Odorico S., Ed.
- Bingham et al. (1994) Bingham R. G., Gellatly D. W., Jenkins C. R., Worswick S. P., 1994. Proc. SPIE, Vol. 2198, p.56. Instrumentation in Astronomy VIII. Crawford D. L & Craine E. R. Eds.
- Castillo-Morales et al. (2007) Castillo-Morales A. Jiménez-Vicente J., Mediavilla E., Battaner E. 2007, MNRAS, 380, 489
- Cecil et al. (1992) Cecil G., Wilson A. S., Tully R. B., 1992, ApJ, 390, 365
- Cecil et al. (1995) Cecil, G., Morse J. A., Veilleux S. 1995, ApJ, 452, 613
- Cecil et al. (2000) Cecil G. et al., 2000, ApJ, 536, 675
- Courtès & Cruvellier (1961) Courtès G., Cruvellier P. 1961, Compt. Rend. Acad. Sci. Paris, 253, 218.
- Cox & Downes (1996) Cox, P., & Downes, D. 1996, ApJ, 473, 219
- Delgado et al. (2005) Delgado R. M. González, Cervio M., Martins L. P., Leitherer C., Hauschildt P. H. 2005, MNRAS, 357, 945
- Ford et al. (1986) Ford H. C., Dahari O., Jacoby G. H.; Crane P. C., Ciardullo R. 1986, ApJ, 311, L7
- Jarrett et al. (2003) Jarrett T. H., Chester T., Cutri R., Schneider S. E., Huchra, J. P. 2003, AJ, 125, Iss 2,525
- Jiménez-Vicente et al. (2007) Jiménez-Vicente J., Castillo-Morales A., Mediavilla E., Battaner E. 2007, MNRAS, 382, L16
- Herrnstein et al. (1997) Herrnstein J. R., Moran J. M., GreenHill L. J., Diamond P. J., Miyoshi M., Nakai N., Inoue M. 1997, ApJ, 475, L17
- Mediavilla et al. (1992) Mediavilla E., Arribas S., Rasilla J. L., 1992, ApJ, 396, 517
- Miyoshi et al. (1995) Miyoshi M., Moran J., Herrnstein J., Greenhill L., Nakai N., Diamond P., Inoue M. 1995, Nature, Volume 373, Issue 6510, pp. 127
- Rubin & Graham (1990) Rubin V. C., Graham J. A. 1990, ApJ, 362, L5
- Sanders (1982) Sanders R. H. 1982, in IAU Symp. 97, Extragalactic Radio Sources, ed. D. S. Heeschen & C.M. Wade (Dordrecht: Reidel), 145
- Sofue (1980) Sofue Y. 1980, PASJ, 32, 79
- Sofue & Vogler (2001) Sofue Y., Vogler A. 2001, A&A, 370, 53
- Sawada-Satoh et al. (2007) Sawada-Satoh S., Ho P. T. P., Muller S., Matsushita S., Lim J. 2007, ApJ, 658, 851
- van Albada (1978) van Albada G. D. 1978, Ph. D. thesis, Univ. of Leiden
- van Albada & van der Hulst (1982) van Albada G. D., van der Hulst J. M., 1982, A&A, 115, 263
- van der Kruit et al. (1972) van der Kruit P. C., Oort J. H., Mathewson D. S. 1972, A&A, 21, 169
- Veilleux et al. (2005) Veilleux S., Cecil G., Bland-Hawthorn J. 2005, ARAA, 43, 769
- Wilson et al. (2001) Wilson A. S., Yang, Y., Cecil G. 2001, ApJ, 560, 689
- Yang et al. (2007) Yang Y., Li B., Wilson A. S., Reynolds C. S. 2007, ApJ, 660, 1106