Development of anomalous diffusion among crowding proteins
Abstract
In cell membranes, proteins and lipids diffuse in a highly crowded and heterogeneous landscape, where aggregates and dense domains of proteins or lipids obstruct the path of diffusing molecules. In general, hindered motion gives rise to anomalous transport, though the nature of the onset of this behavior is still under debate and difficult to investigate experimentally. Here, we present a systematic study where proteins bound to supported lipid membranes diffuse freely in two dimensions, but are increasingly hindered by the presence of other like proteins. In our model system, the surface coverage of the protein avidin on the lipid bilayer is well controlled by varying the concentration of biotinylated lipid anchors. Using fluorescence correlation spectroscopy (FCS), we measure the time correlation function over long times and convert it to the mean-square displacement of the diffusing proteins. Our approach allows for high precision data and a clear distinction between anomalous and normal diffusion. It enables us to investigate the onset of anomalous diffusion, which takes place when the area coverage of membrane proteins increases beyond approximately 5%. This transition region exhibits pronounced spatial heterogeneities. Increasing the packing fraction further, transport becomes more and more anomalous, manifested in a decrease of the exponent of subdiffusion.
keywords:
molecular crowding; anomalous diffusion; fluorescence correlation spectroscopy; lipid membranesIntroduction
Anomalous transport of proteins in a crowded environment is best discussed in real space, in terms of the mean-square displacement (MSD). There, deviations from Fickian diffusion can clearly be inferred in a double-logarithmic representation. While computer simulations yield the MSD directly, single-particle tracking (SPT) is essentially the only experimental method that gives access to this quantity 1, 2, 3, 4. Following the trajectories of individual, fluorescently labeled proteins prompts our spatial imagination and facilitates the discussion of the underlying mechanisms. Such methods, however, require sophisticated and costly image processing, their temporal resolution is typically limited to fractions of a second, and long-time measurements suffer from bleaching dye due to the intense laser light.
A complementary technique is fluorescence correlation spectroscopy (FCS), which has been established to precisely quantify normal protein diffusion at the micro- and millisecond scales 5, 6, 7, 8. Compared to SPT, this technique is much simpler and less time consuming in terms of performance and data processing, its temporal resolution is essentially limited by the responsiveness of the dye, and the laser power is so low that bleaching is greatly reduced. In particular, FCS offers time windows of several decades and is thus a key technique to study anomalous diffusion, e.g., in the cytoplasm 9, 10, in cell membranes 11, 12, and in protein solutions imitating crowding conditions 13, 14, 15. The central quantity in FCS is the time-correlation function of the fluctuating intensity of the fluorescent light from labeled molecules. A discussion of such a correlation function is more subtle than for plain trajectories, and it requires certain assumptions on the measurement process itself and in many cases even on the nature of the dynamic processes inside the probe. While there is little ambiguity in the case of dilute systems showing normal diffusion, the investigation of anomalous diffusion is complicated by such prerequisites. Here, we convert the FCS autocorrelation function directly to an MSD, from which anomalous diffusion can be easily inferred without resorting to a particular diffusion model a priori. Further, such an analysis could even capture a possible crossover in the MSD from subdiffusion at short times to normal diffusion at long times.
Membrane proteins are naturally exposed to a highly crowded landscape, with stark consequences on their transport dynamics. The cell membrane consists of a heterogeneous lipid bilayer densely packed with integral and peripheral proteins; in addition, some of the lipids are organized into microdomains, and some of the proteins are tethered to the cytoskeleton 16. Measurement of protein transport in cell membranes is thus experimentally challenging. A pronounced reduction of lateral protein diffusivity has been established by numerous experiments using SPT 17, 3, 18, 19, 20, 21, 22, 23, FCS 24, 25, 12, 11, or fluorescence recovery after photobleaching 26, 20. There is general agreement that this effect is caused by macromolecular crowding 27, 28, 3, 29, 4. Many of the experimental findings have been interpreted in terms of anomalous diffusion 3, 21, 22, 23, 24, 12, 11, but several experiments also display simple Brownian motion 17, 18, 22. It was emphasized that anomalous transport should not be considered a universal feature of crowded systems 28, and it has been noted elsewhere 3 that the transport characteristics may depend on the time scale of the observation—which may resolve the controversy. Nevertheless, the relevant crossover time scales and, more generally, the source of the anomalous behavior have not been identified so far.
To shed light on the origin of anomalous transport in membranes, experimental model membrane systems with an adjustable degree of crowding are desirable, allowing isolated effects to be studied systematically. The hope is to observe both the onset of anomalous behavior as well as the crossover to normal diffusion at long times as functions of the system parameters. Promising candidates for an experimental realization are synthetic lipid bilayers, which offer the advantage that the composition can be controlled precisely. Such model membranes have provided insight into how diffusion in membranes is affected by immobilized lipids 30 and lipid phase separation 31. Yet, the experimental scenario of physical molecular crowding in membranes remains relatively under-investigated 27, 32.
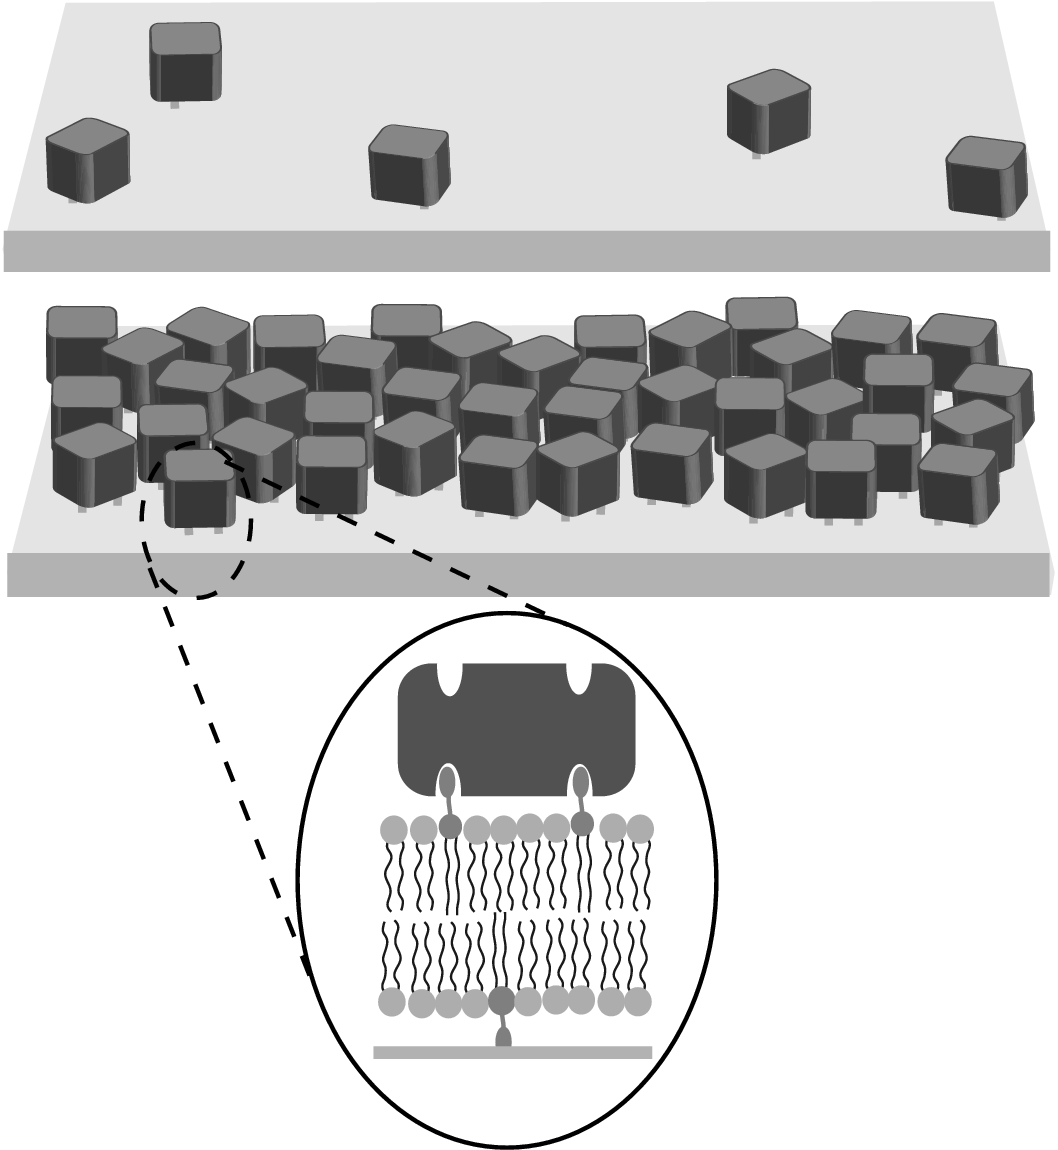
In the present work, we use FCS to investigate the systematic development of anomalous transport of proteins bound to a crowded model membrane on a planar substrate. Specifically, we have studied the motion of the protein avidin in supported lipid bilayers as function of the protein content (Fig. 1). By exploring a wide range of avidin surface coverages, this system can be fully characterized in the dilute, intermediate, and crowded regimes, and drastic changes in the protein diffusivity are observed. The protein motion is clearly inferred from the obtained MSDs, which permit a clear distinction between normal and anomalous diffusion.
Experimental model system
Our experimental model system consists of a single lipid bilayer of SOPC containing a fraction of biotin-X-DPPE, which is supported by a transparent glass substrate 33. The protein avidin irreversibly binds the biotinylated lipid anchors and has confined mobility in two dimensions on the surface of the bilayer. Avidin has two biotin-binding sites that are simultaneously available 34. We control the surface coverage of avidin by varying the concentration of biotinylated lipid anchors in the bilayer: as the concentration of lipid anchors is increased, the surface coverage of avidin increases.
We take advantage of the non-crystalline nature of avidin at neutral pH to directly measure how excluded volume affects the protein transport. Previous characterization of avidin diffusion using fluorescent bleaching techniques showed that at high surface coverages, avidin does not diffuse on time and length scales comparable to the lipids 33, 35. In the same lipid bilayer system, the diffusion of a lipid tracer below a layer of avidin protein is normal 33; however, the diffusion of avidin itself is difficult to quantify with fluorescent bleaching.
Theory
Anomalous transport
The simplest dynamic quantity characterizing the motion of molecules is the mean-square displacement (MSD) as a function of the time lag . Simple Fickian diffusion is quantified by the diffusion constant , and the MSD grows linearly with time, for diffusion in a flat membrane. Hindered transport is manifested either by a reduction of the diffusion constant or by a modified shape of the function ; the latter case is termed anomalous transport. One generic scenario is a power-law relation referred to as subdiffusion, and , which yields a straight line in a double-logarithmic representation. The characteristic exponent is then directly read off as the slope of this line.
Power-law behavior in dynamic correlations is mathematically equivalent to the presence of processes with power-law distributed characteristic time scales 36. Generically there is always a slowest process, and the subdiffusive behavior is cut off for sufficiently long observation times and crosses over to simple diffusion 37, 38, 3. In the case of cell membranes, a power-law distribution of characteristic time scales requires a hierarchy of slow processes that hinder the molecular motion. One possible source is trapping by specific binding 28, 39, but the origin of the hierarchical ordering is not obvious here. Another possibility is that time scales are inherited from a spatially heterogeneous structure, which stems either from the presence of very differently sized macromolecular complexes, from self-organized criticality, or which is related to a critical phenomenon—as observed for randomly distributed obstacles 40, 41, 42, 43.
The FCS autocorrelation function
The FCS method consists of autocorrelating the intensity fluctuations of fluorescent light from a steadily illuminated volume. Since the fluorescence is proportional the incident laser intensity and the concentration of labeled molecules fluctuating in time and space, the collected light in the detector is determined by
| (1) |
where we consider the molecules confined to a plane. The quantity measured in an FCS experiment is simply the time-autocorrelation function of the fluctuating intensity around the mean intensity,
| (2) |
where the normalization is convention. The intensity fluctuations can be expressed as a weighted average of concentration fluctuations of the labeled molecules. It is straightforward to adapt the derivation of Ref. 44 to two-dimensional systems. Then the FCS signal
| (3) |
is related to the van-Hove correlation function
| (4) |
Its spatial Fourier transform is known as the intermediate scattering function 45
| (5) |
and the FCS autocorrelation can be expressed as
| (6) |
where is the spatial Fourier transform of the intensity profile and
| (7) |
can be interpreted as the effective number of particles illuminated. For a Gaussian profile of the laser beam
| (8) |
where denotes the beam waist, the filter function is again Gaussian, and the number of illuminated particles is found as .
If only a small fraction of molecules is labeled, the intermediate scattering function reduces to the incoherent scattering function
| (9) |
For normal diffusion and again for a Gaussian beam the FCS autocorrelation then attains the simple form
| (10) |
where denotes the dwell time. Relaxing the assumption of diffusion, the incoherent scattering function for two-dimensional motion is given by within a Gaussian approximation. Hence, the motion is characterized by the mean-square displacement , and the FCS autocorrelation is then given by
| (11) |
A variant of this formula for the three-dimensional situation was given during this work by Shusterman et al. 46; a generalization to polymers is found in Ref. 47.
The fluorescence conversion in general includes intermediate dark triplet states, which modifies the FCS autocorrelation at short times. To account for the photo physics, a time-dependent factor has been introduced 48, yet if the triplet lifetime is much shorter than the time scales of interest, this factor may be safely ignored. In addition, we assume that the fraction of fluorophores in the triplet state is sufficiently small and thus negligible for the normalization of .
Experimental
Materials
The lipids 1-stearoyl-2-oleoyl-sn-glycero-3-phosphocholine (SOPC, Avanti Polar Lipids, Alabaster, Alabama, USA), N-((6-(biotinoyl) amino)hexanoyl)-1,2-dihexadecanoyl-sn-glycero-3-phosphoethanolamine triethylammonium salt (biotin-X-DPPE, Invitrogen, Karlsruhe, Germany) and 2-(4,4-difluoro-5-octyl- 4-bora-3a,4a-diaza-s-indacene-3-pentanoyl)-1-hexadecanoyl-sn-glycero-3-phosphocholine(-BODIPY 500/510C5-HPC, Invitrogen) were prepared in chloroform. The proteins egg white avidin and fluorescently labeled Alexa Fluor 488-avidin (Alexa488-avidin) and the fluorophore rhodamine 6G were also from Invitrogen. HPLC-grade chloroform, acetone, isopropanol, and ethanol were from Carl Roth (Karlsruhe, Germany). Reagent-grade NH4OH, 37% HCl, and H2O2 were purchased from Sigma (St. Louis, Missouri, USA).
Preparation of the bilayer with bound avidin
Cover glass slides (24 mm24 mm) were cleaned in a 3-stage process and rinsed with deionized (DI) water (MilliQ Corp) between each step. First, samples were boiled in a solution of 5:1 volume ratio of acetone/DI water for 10 min. Second, samples were boiled in 1:1:5 DI water/H2O2/HCl for 1520 min, rinsed, then boiled in 1:1:5 DI water/H2O2/NH3OH. Lipid solutions containing 3 mg total lipids were mixed in HPLC-grade chloroform (Roth) in clean glass vials. Then, the chloroform was evaporated from the vials overnight and then redissolved in HPLC-grade isopropanol to a final concentration of 1.5 mg/mL. This solution was used for spin-coating by dropping 200 µL of solution onto the clean glass substrates followed by immediate acceleration of the glass to 3000 RPM applied for 60 s in a Delta 10 spin-coater (BLE Lab Equipment, Radolfzell, Germany). The lipid-coated substrates were dried for 1 hr in a vacuum chamber then placed into Teflon-metal chambers that screw together with an O-ring to create a water-tight seal to the glass. DI water was added to the chambers to hydrate the lipid film. After overnight incubation, the substrates were rinsed with DI water and stored at 3540 °C for 8 hrs, allowing the bilayer to anneal and to remove any multi-bilayers on the substrate 49, 50. The complete removal of possible multilayered structures was further verified by our previous work using x-ray reflectivity and lipid microscopy 33. The samples were again rinsed with DI water, then PBS buffer. Lipid bilayers labeled with 0.005mol% -BODIPY 500/510C5-HPC show normal diffusion, even under a fully crowded layer of avidin. Avidin protein solutions containing 50100 µg total protein were added to the substrates and stored overnight at 35 °C. Before measurement with FCS at room temperature, the substrates were rinsed rigorously with PBS buffer to remove any non-bound protein. The avidin protein solution contained the fluorescent analog of Alexa488-avidin with 1:201:1000 Alexa488/avidin dye ratio. The dye ratio is optimized at each lipid anchor concentration to maximize the signal-to-noise ratio and obtain .
Fluorescence correlation spectroscopy
For the FCS measurements, the avidin mixture bound to the membrane contained a small fraction (0.050.001) of fluorescently-labeled Alexa488-avidin. ConfoCor2 (Zeiss) with a confocal LSM 510 microscope was used with a 488-nm Ar laser with power 165 µW, 6.1 mA. Calibration was done with with Rhodamine 6G dissolved in PBS at concentration of 100nM to determine the dimensions of the focal volume and illuminated membrane area. The beam waists obtained varied between µm and 0.18 µm. All measurements were performed at 2122 °C.
To ensure the -stability of the sample for long measurement times, the drift has to be minimized and controlled. A shift of 0.4 µm in -direction results in a 50-fold loss in intensity, and such samples cannot be analyzed. During our measurements, the sample did not drift more than 0.3 µm, and artifacts in the data due to drift are not expected 51. We have also measured the signal from an empty chamber with a bilayer but no protein to determine the background noise level. The measurements were completed with counts per molecule of 1.11.8, and a noise level kHz. Measurements were repeated on at least 2 different samples in at least 4 different spots.
Laser scanning microscopy (LSM)
For fluorescence imaging of the samples, a large pinhole ( µm) was selected for planar imaging of the bilayer. The laser power for imaging was 6 mW with pixel time µs. The LSM measurements allowed verification that the membranes were intact and free of defects. The micrographs in Fig. 7 show averages over 8 images each.
Statistical analysis
To determine whether diffusion is normal or anomalous, a least-squares fitting routine using the experimental standard deviation 52 was applied. The parameters , , and, in the case of anomalous diffusion, , were varied, and the autocorrelated data were compared to the diffusion model, , using the Levenberg-Marquardt algorithm in matlab. The model, normal or anomalous, and the corresponding parameters with the smallest were chosen.
Results and Discussion
Dilute case
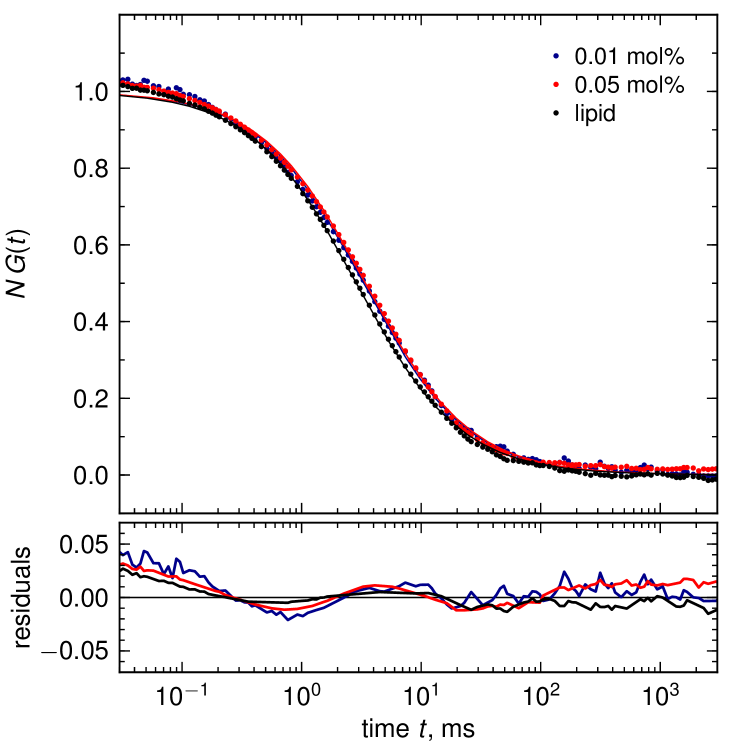
With the goal of studying the dynamics of avidin on the surface of the bilayer over a full range of surface concentrations, we first examined the dilute case, or the absence of crowding. A very low surface coverage was obtained by preparing a bilayer containing 0.010.05 mol% biotinylated lipid anchors. For such low avidin coverage, the measured FCS autocorrelation function is fit well by the normal diffusion model for two dimensions, Eq. (10), see Fig. 2. Using , the diffusion constant of avidin is µm2/s and µm2/s at 0.01 and 0.05 mol% lipid anchors, respectively. Previous FRAP measurements of the homologous protein streptavidin bound to a similar bilayer system resulted in comparable values for 35. Note that a size-dependence of the diffusion constant, such as that described by the Saffman-Delbrück diffusion model 53 and adaptions thereof 54, 55, is not directly relevant here despite the large size difference between lipid and protein molecules; avidin is not a membrane inclusion, but it is rather bound to the lipid anchors in the bilayer. Using x-ray reflectivity, we have demonstrated in a previous study 33 that a distinct water layer separates the avidin protein layer from the lipid bilayer.
In a separate control experiment, we have measured the motion of the lipids within the bilayer. For this FCS measurement, 0.005 mol% of lipids were replaced by the fluorophore -BODIPY 500/510C5-HPC as suggested in Ref. 51. We found that the lipids in the bilayer with and without bound avidin diffuse normally with µm2/s. This value is similar to previous measurements of the same system using the continuous bleaching method 33. Thus, the bound protein has a diffusion constant comparable to the lipids in the underlying bilayer, and we conclude that at low avidin coverage, avidin transport is essentially limited by the diffusion of the lipid anchors. In particular, no signs of anomalous transport were found. A similar result was obtained in studies of diffusion in surfactant bilayers 54. Using a transbilayer peptide with streptavidin grafted onto one end, diffusion of the peptide with streptavidin is negligibly slowed compared to the bare peptide lacking streptavidin.
Anomalous diffusion
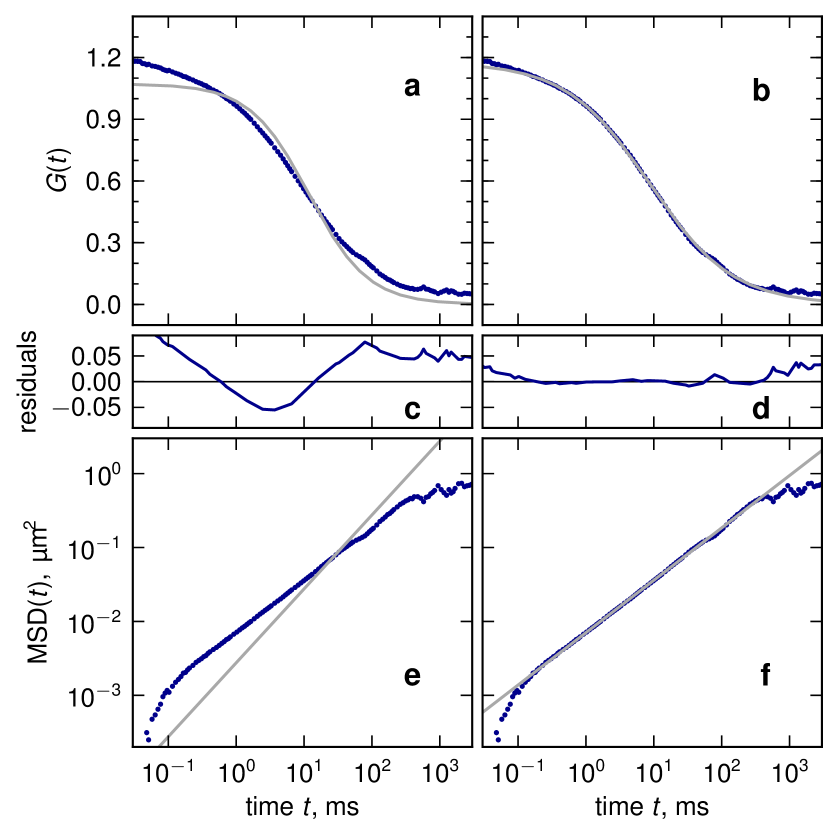
At sufficiently high concentrations of avidin bound to the lipid bilayer, we expect deviations from normal diffusion. Increasing the concentration of lipid anchors to 1 mol%, we found that the normal diffusion model, Eq. (10), produces a poor fit as demonstrated in Fig. 3a. Instead, the data are fitted much better using a model function for anomalous diffusion,
| (12) |
which introduces the exponent ; here, the fit yields ; see Fig. 3b. Such a fit implies subdiffusive motion, i.e., a MSD growing with a non-integer power in time, , which follows by comparison to Eq. (11) derived within a Gaussian approximation. An important indicator of the fit quality is to examine the residuals , see Fig. 3c,d. The residuals for the normal diffusion model show a pronounced minimum, which indicates a poor fit 11. Examination of the residuals also suggests that the data are best fit in the time window 0.1 ms ms, and that this window is limited by statistical noise at long times.
Let us comment that a superposition of two normally diffusing components 56,
| (13) |
where , also allows for a description of the data with similarly small residuals. Such a fit, however, is rather susceptible to the precise fit range; changing the upper end of the fit window from 200 ms to 3 s, the ratio varies between 14 and 25, while marginally affecting the parameters of the anomalous model, Eq. (12). For such large ratios of , the FCS correlation functions resulting from both models can hardly be distinguished in the conventional semi-logarithmic representation. Both models, however, differ significantly in their long-time decay visible on double logarithmic scales. An unambiguous discrimination in the present case would require a lower noise level in of 1%. Nevertheless we shall not pursue the two-component fit in the following, since the parameters extracted are arbitrary to a large extend and it remains unclear what the nature of the two independently diffusing components should correspond to.
The usual semi-logarithmic plot of mainly exhibits the dynamics at the time scale , where . A characterization of anomalous diffusion, however, requires sensitivity to a broad range of time scales, ideally spanning several decades. In particular, the behavior at long times is important, although difficult to access due to the relatively small signal of the autocorrelation function. Similarly, a least-squares fit is optimized in the vicinity of where the statistical noise in is small 52. There have been important efforts to improve the quantitative evaluation and analysis of autocorrelated FCS data. The maximum entropy method, for example, is an adaptation of the fitting procedure that considers a distribution of characteristic diffusion times 57, 14. But as noted already, purely subdiffusive transport is equivalent to a continuous power-law distribution of characteristic time scales.
Conversion to the mean-square displacement
The conventional analysis of an FCS measurement is based on model functions that depend on a few parameters such as the diffusion time and the number of fluorophores in the observation volume. Then the diffusion coefficient can be directly extracted by means of a fitting algorithm. Such a procedure works as long as the model function reflects the relevant physics of the sample under investigation. The selection of an appropriate model function is essential for data fitting and the subsequent interpretation. If the dynamics of the system under investigation is unknown, the proper choice is sometimes unclear and a subjective issue. Usually one has to decide a priori whether to use a model for normal diffusion, a superposition of diffusing species, or a model for subdiffusion. For the latter, the situation is even more complicated, since subdiffusion generically crosses over to normal diffusion for sufficiently long times 58, 37, 38.
Rather than extending existing models by such crossover phenomena, here we suggest converting the autocorrelated FCS data, , directly to the MSD,
| (14) |
simply by inversion of Eq. (11). This eliminates the need to select a model function, permitting an unbiased interpretation of the experiment. Then, a double-logarithmic representation of the MSD reveals the dynamic features at all scales, which can immediately be identified with the naked eye. The beam waist is accessible from independent experiments, and the number of labeled molecules can be inferred from the mean intensity directly, or alternatively, from at short (but not too short) times. Note that the precise value of hardly affects the shape of the resulting MSD at intermediate and long time scales, and the value of merely provides the conversion to absolute length.
The inversion of the FCS autocorrelation resolves the tail at long measurement times, at the price of magnifying the noise for these data. Thus, the experimental challenge is to keep the noise level in low. Statistical noise is minimized by collecting more data: longer measurement times give better statistics. In the present work, we take advantage of the stability of the system and have measured for relatively long times of approximately 200 s, significantly improving the statistics at the time scale of 1 s. An additional consideration is the fluorescent signal within the focus area. In FCS, the best signal-to-noise ratio for is obtained by optimizing the concentration of fluorescent molecules such that the number of fluorophores diffusing within the measurement volume is as close to 1 as possible. For the systematic examination of different surface coverages, the fraction of dyed protein thus had to be optimized for each protein concentration.
Applying the data inversion method to the example in Fig. 3 confirms our earlier conclusion that the avidin diffusion is anomalous (Fig. 3e–f). The quality of the fit for ms can be more clearly assessed from visual analysis of the MSD plots compared to studying the plots of the same data (Fig. 3a–b).
Development of the exponent of subdiffusion
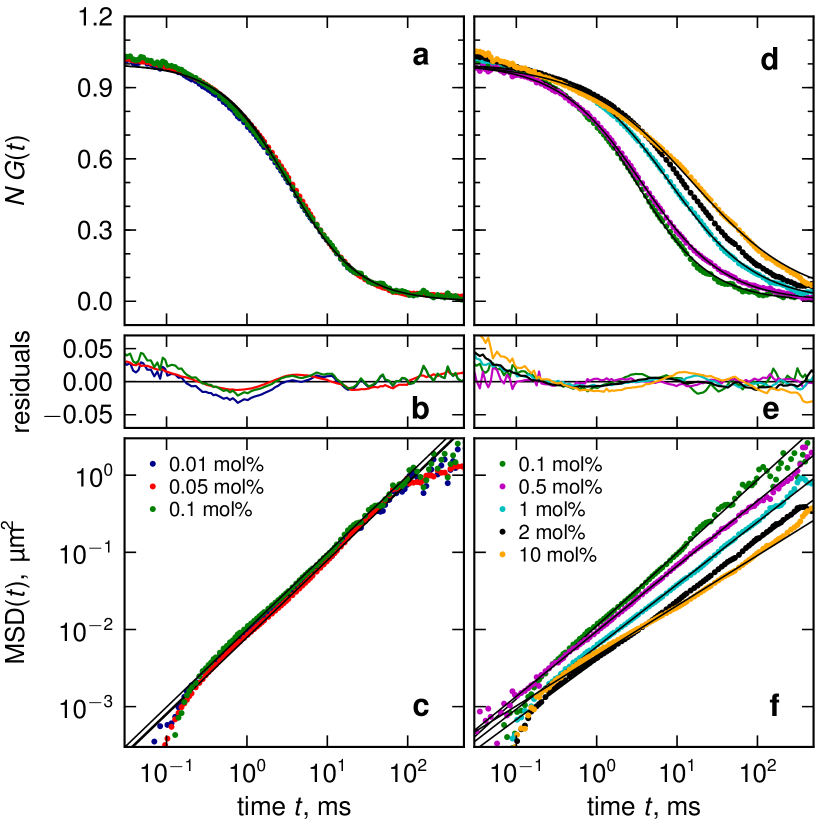
To explore the consequences of crowding on the avidin motion, the concentration of lipid anchors in the bilayer was systematically increased. Several independently prepared samples were measured in at least four different illumination spots, enabling an estimate of the experimental error for the exponent of subdiffusion. In the dilute regime with biotinylated lipid anchor concentrations of mol%, the avidin proteins undergo normal diffusion as discussed already, and which is further demonstrated by inspection of the MSD in Fig. 4c.
At a biotinylated lipid concentration of 0.1 mol%, the FCS autocorrelation function starts to deviate from normal diffusion; a satisfactory fit is obtained using the model for anomalous diffusion, Eq. (12), in Fig. 4d,e. As the biotinylated lipid anchor concentration is increased further, avidin transport on the membrane becomes significantly slower, as is apparent from the decreasing slope of the MSDs in a double-logarithmic plot in Fig. 4f. Thus, the exponent of subdiffusion decreases monotonically as more avidin crowds on the surface of the lipid bilayer (Fig. 5), and we can quantify the development of anomalous diffusion. In the most crowded regime, where there is an excess (10 mol%) of lipid anchors, we find . Interestingly, the obtained MSDs exhibit single power-law behavior in the accessible time window, and the expected crossover to normal diffusion has not yet set in. In this case, the conventional method of fitting Eq. (12) to the FCS function and the conversion to the MSD yield equivalent results for the exponent .
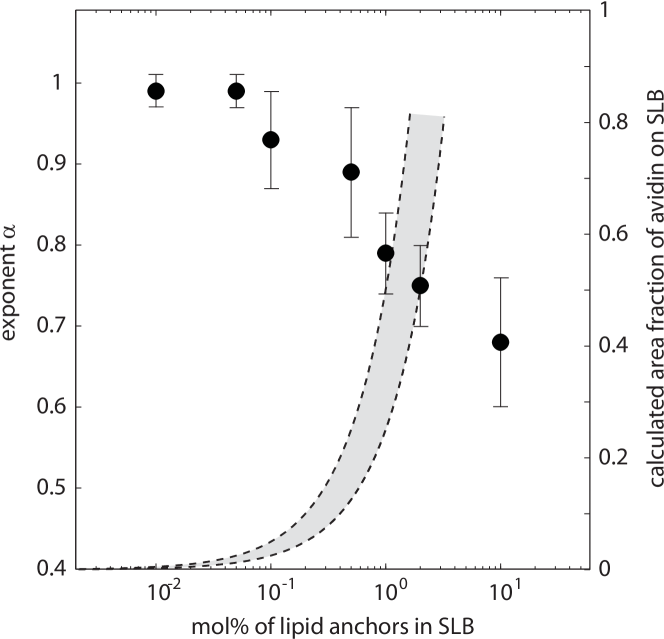
Thus far, we have described the surface coverage of avidin in terms of the concentration of lipid anchors that we used in preparing the lipid bilayer. To better depict crowding, the approximate area fraction of the membrane covered with avidin may be estimated based on the geometry of the proteins and lipids. We assume that each lipid in the bilayer occupies an area of 50 Å2 and each avidin molecule occupies a square of dimension 5 nm5 nm. Depending on whether the avidin molecules are bound by either one or two biotinylated lipid anchors, upper and lower estimates of the area fraction covered with avidin follow as indicated in Fig. 5. Note that the other biotin-binding protein streptavidin was shown to bind to a membrane with either one or two biotin anchors 35. The onset of anomalous diffusion at 0.1 mol% corresponds to a protein area coverage of approximately 35%, which is a surprisingly low value.
The transition regime
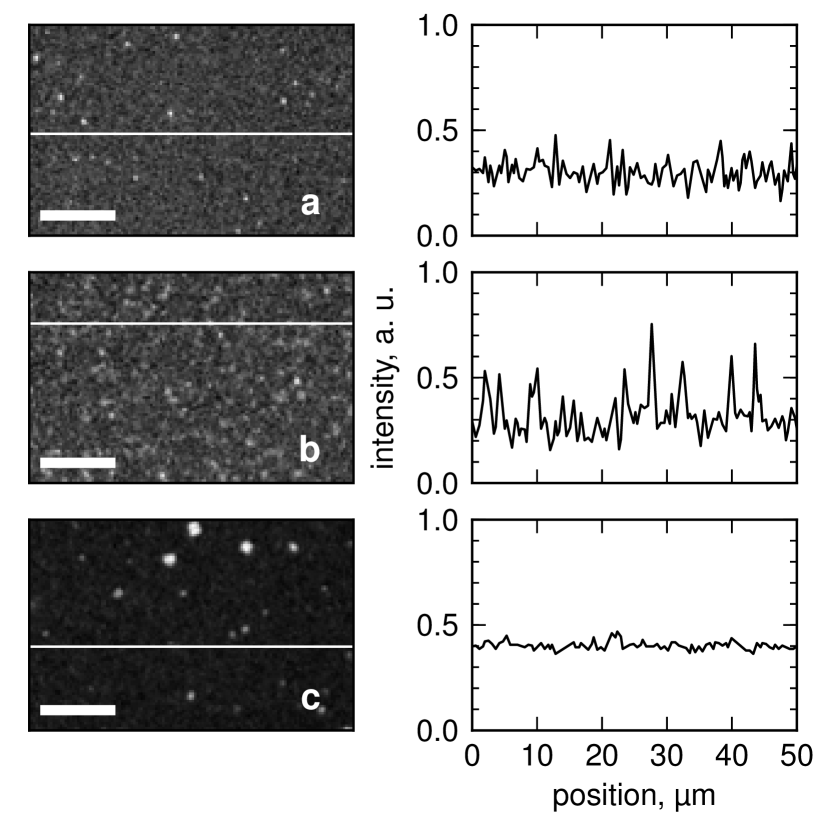
By systematically varying the concentration of avidin, we have determined the onset of anomalous diffusion due to molecular crowding. A thorough investigation of these intermediate concentrations may elucidate the microscopic origin of the subdiffusive behavior. First, we observe that the relative statistical error in the anomalous diffusion exponent is significantly higher at intermediate lipid anchor concentrations of 0.1 and 0.5 mol% (Fig. 5). Second, evidence for heterogeneous structures is found by confocal fluorescence micrographs in Fig. 7, displaying the distribution of labeled avidin bound to the membrane. The lipid bilayer containing 0.5 mol% of biotinylated lipid has a more irregular intensity profile in comparison to the dilute and crowded micrographs with 0.05 mol% and 10 mol%, respectively. The fluorescence micrographs reveal µm-sized features in the transition regime.
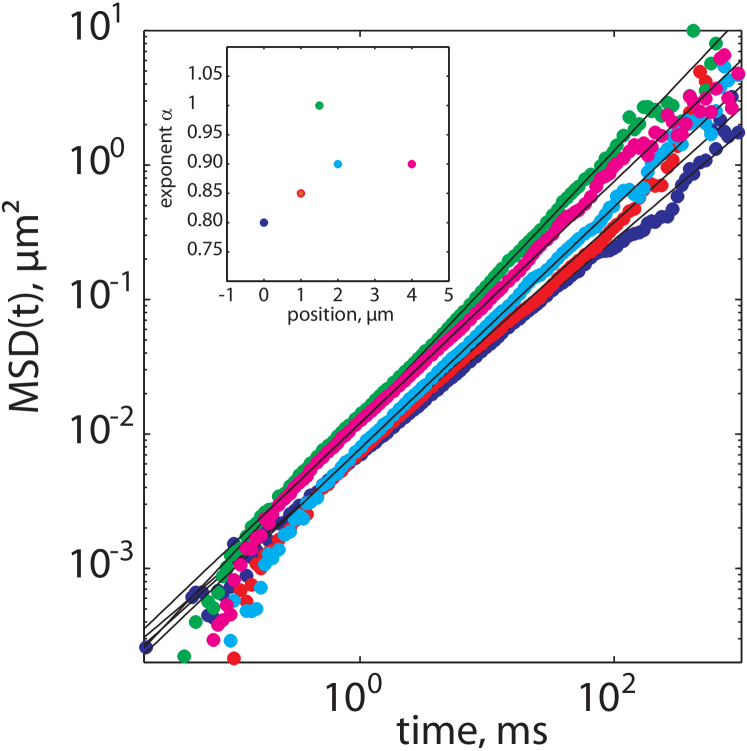
These spatial heterogeneities prompted further spatial FCS characterization of the transition regime. Probing the dynamics on various well separated spots allows autocorrelated FCS data locally to be collected and local mean-square displacements to be extracted, as shown in Fig. 6. All curves are well represented by the subdiffusive law, Eq. (12), where the exponent interestingly depends on the position. Thus our experiments reveal large variations in on a 1 micron scale. Repeated measurement of the same spot after 1 h showed no changes in , corroborating the notion of long-living, spatial heterogeneities.
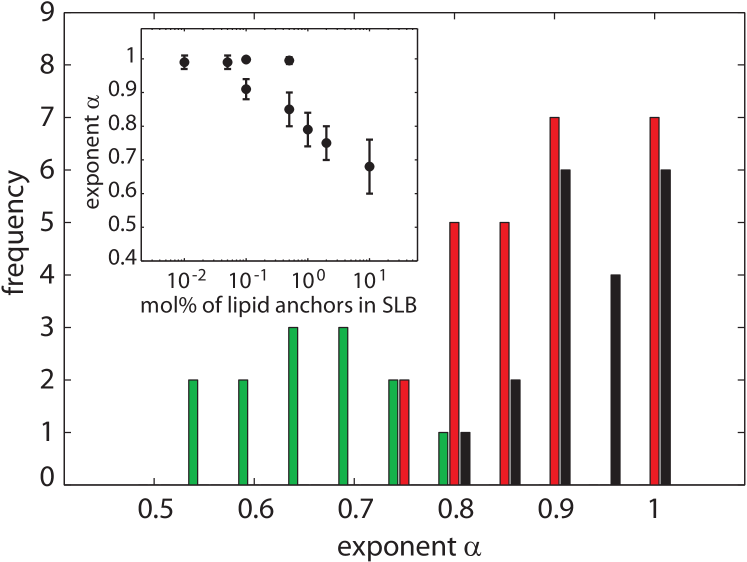
From the FCS measurements we have collected histograms of the local exponents in Fig. 8. The distributions in the values of suggest qualitatively that there are two classes of transport within the transition regime: there are molecules that appear to diffuse normally and molecules that show subdiffusive behavior. The histogram for the 10 mol% lipid anchor measurements, however, appears as a single and very broad distribution. Consequently the spatial heterogeneities are also present in the crowded regime, where at each spot the dynamics is anomalous. Mean and variance of the histograms are displayed in the inset of Fig. 8. Treating the two classes in the transition regime separately results in significantly smaller error bars compared to Fig. 5.
Conclusions
We have shown that protein diffusion in crowded membranes displays anomalous transport, manifested by subdiffusive behavior of the mean-square displacement. The effect of crowding can be studied systematically with FCS in a model lipid bilayer membrane where the concentration of avidin as crowding agent is well controlled. Depending on the surface coverage, we observe normal or anomalous transport separated by a transition regime.
We demonstrate an alternative way to analyze the FCS autocorrelation function by direct conversion to the MSD. This approach is independent of the employed diffusion model and is even capable of identifing a possible temporal crossover from subdiffusive to diffusive motion. The obtained MSDs, however, exhibit single power-law behavior at time scales between 1 ms and 100 ms for all concentrations, and we conclude that normal diffusion would take place at longer times beyond the scope of the present set of experiments. A complementary approach would be to vary the beam waist of the laser, enabling a larger area of the bilayer to be measured and shifting the sensitivity of the experiment to longer times, which could elucidate a crossover mechanism from subdiffusive to diffusive motion.
The transition regime appears to be a mixed phase of micron-sized domains of normal diffusion coexisting with domains of subdiffusion. Repeated measurements on the same spot yielded reproducible results even after hours, showing that the domains are stable and long-living spatial heterogeneities exist on top of the membrane; in particular we exclude aging effects. The emergence of these spatial heterogeneities correlates with the onset of anomalous transport. The latter is quantified in terms of the exponent of subdiffusion , which shows a continuous decrease as the degree of crowding is increased beyond the transition regime. The mean-square displacements were extracted directly from the FCS autocorrelated data, independent of a priori models for the motion. Then different transport mechanisms can be distinguished immediately by visual inspection of the MSD.
A well-established mathematical model for subdiffusion is the continuous time random walk (CTRW), where space is homogeneous and a broad distribution of waiting times is assumed from the very beginning. In this model, one expects weak ergodicity breaking, i.e., time-averaged measurements exhibit aging 59. Our experiments are incompatible with this scenario; rather, they suggest that the anomalous transport originates from the observed spatial heterogeneities, similar to the phenomenology of transport on percolating systems 58. An analogous conclusion has been made recently for a three-dimensional crowded dextran solution 60. From our experiments we exclude fractional Brownian motion (FBM) 61 too as a valid description, since it predicts spatially homogeneous dynamics.
One may speculate on the nature of the observed heterogeneous structures. The surface oligosaccharide groups of avidin as well as its positive surface charge has been postulated to cause lateral gel-like network formation 35. Therefore, it is possible that protein-protein interactions affect the spatial organization of avidin at the transition and give rise to the observed heterogeneity. The two-dimensional space accessible to membrane proteins may efficiently be blocked for topological reasons even at relatively low concentrations of proteins. Thus, the onset of anomalous diffusion being at the low surface coverage of supports the idea that protein motion is obstructed by spacious, ramified structures.
In the context of cell membranes, another important question is how crowding affects the state of the lipids. Here, we have taken advantage of fluid membrane that remains fluid even under a very crowded protein layer to eliminate this effect, and anomalous diffusion is due to protein crowding alone. The case of integral membrane proteins, such as rhodopsin, is more complex 62, and further studies are desirable, which introduce protein-induced heterogeneities in the lipid bilayer.
Acknowledgments
Financial support from the German Excellence Initiative via the program “Nanosystems Initiative Munich (NIM)” and from the Deutsche Forschungsgemeinschaft (DFG) contract No. FR 850/6-1 is gratefully acknowledged.
References
- 1 W. J. Greenleaf, M. T. Woodside and S. M. Block, Annu. Rev. Biophys. Biomol. Struct., 2007, 36, 171–190.
- 2 J. Kirstein, B. Platschek, C. Jung, R. Brown, T. Bein and C. Bräuchle, Nat. Mater., 2007, 6, 303–310.
- 3 A. Kusumi, C. Nakada, K. Ritchie, K. Murase, K. Suzuki, H. Murakoshi, R. S. Kasai, J. Kondo and T. Fujiwara, Annu. Rev. Biophys. Biomol. Struct., 2005, 34, 351–378.
- 4 M. J. Saxton and K. Jacobson, Annu. Rev. Biophys. Biomol. Struct., 1997, 26, 373–399.
- 5 S. Chiantia, J. Ries and P. Schwille, Biochimica et Biophysica Acta (BBA) - Biomembranes, 2009, 1788, 225–233.
- 6 O. Krichevsky and G. Bonnet, Rep. Prog. Phys., 2002, 65, 251–297.
- 7 Fluorescence Correlation Spectroscopy, ed. R. Rigler and E. S. Elson, Springer, Berlin, 2001.
- 8 P. Schwille, U. Haupts, S. Maiti and W. W. Webb, Biophys. J., 1999, 77, 2251–2265.
- 9 G. Guigas, C. Kalla and M. Weiss, Biophys. J., 2007, 93, 316–323.
- 10 M. Wachsmuth, W. Waldeck and J. Langowski, J. Mol. Biol., 2000, 298, 677–689.
- 11 P. Schwille, J. Korlach and W. W. Webb, Cytometry, 1999, 36, 176–182.
- 12 M. Weiss, H. Hashimoto and T. Nilsson, Biophys. J., 2003, 84, 4043–4052.
- 13 H. Sanabria, Y. Kubota and M. N. Waxham, Biophys. J., 2007, 92, 313–322.
- 14 D. S. Banks and C. Fradin, Biophys. J., 2005, 89, 2960–2971.
- 15 M. Weiss, M. Elsner, F. Kartberg and T. Nilsson, Biophys. J., 2004, 87, 3518–3524.
- 16 D. M. Engelman, Nature, 2005, 438, 578–580.
- 17 J. M. Crane and A. Verkman, Biophys. J., 2008, 94, 702–713.
- 18 M. Vrljic, S. Y. Nishimura, S. Brasselet, W. Moerner and H. M. McConnell, Biophys. J., 2002, 83, 2681–2692.
- 19 M. Tomishige, Y. Sako and A. Kusumi, J. Cell Biol., 1998, 142, 989–1000.
- 20 T. Feder, I. Brust-Mascher, J. Slattery, B. Baird and W. Webb, Biophys. J., 1996, 70, 2767–2773.
- 21 P. R. Smith, I. E. Morrison, K. M. Wilson, N. Fern ndez and R. J. Cherry, Biophys. J., 1999, 76, 3331–3344.
- 22 E. D. Sheets, G. M. Lee, R. Simson and K. Jacobson, Biochemistry, 1997, 36, 12449–12458.
- 23 R. N. Ghosh and W. W. Webb, Biophys. J., 1994, 66, 1301–1318.
- 24 E. Gielen, J. Vercammen, J. Sýkora, J. Humpolíčková, M. vandeVen, A. Benda, N. Hellings, M. Hof, Y. Engelborghs, P. Steels and M. Ameloot, C. R. Biologies, 2005, 328, 1057–1064.
- 25 P.-F. Lenne, L. Wawrezinieck, F. Conchonaud, O. Wurtz, A. Boned, X.-J. Guo, H. Rigneault, H.-T. He and D. Marguet, EMBO J., 2006, 25, 3245–3256.
- 26 A. K. Kenworthy, B. J. Nichols, C. L. Remmert, G. M. Hendrix, M. Kumar, J. Zimmerberg and J. Lippincott-Schwartz, J. Cell Biol., 2004, 165, 735–746.
- 27 H.-X. Zhou, G. Rivas and A. P. Minton, Ann. Rev. Biophys., 2008, 37, 375–397.
- 28 J. A. Dix and A. Verkman, Ann. Rev. Biophys., 2008, 37, 247–263.
- 29 R. J. Ellis, Curr. Opin. Struct. Biol., 2001, 11, 114–119.
- 30 M. A. Deverall, E. Gindl, E. K. Sinner, H. Besir, J. Ruehe, M. J. Saxton and C. A. Naumann, Biophys. J., 2005, 88, 1875–1886.
- 31 A. E. Hac, H. M. Seeger, M. Fidorra and T. Heimburg, Biophys. J., 2005, 88, 317–333.
- 32 E. Melo and J. Martins, Biophys. Chem., 2006, 123, 77–94.
- 33 M. R. Horton, C. Reich, A. P. Gast, J. O. Rädler and B. Nickel, Langmuir, 2007, 23, 6263–6269.
- 34 C. Rosano, P. Arosio and M. Bolognesi, Biomol. Eng., 1999, 16, 5–12.
- 35 C. Lou, Z. Wang and S.-W. Wang, Langmuir, 2007, 23, 9752–9759.
- 36 J.-P. Bouchaud and A. Georges, Phys. Rep., 1990, 195, 127–293.
- 37 A. Kammerer, F. Höfling and T. Franosch, EPL, 2008, 84, 66002.
- 38 F. Höfling and T. Franosch, Phys. Rev. Lett., 2007, 98, 140601.
- 39 M. J. Saxton, Biophys. J., 2007, 92, 1178–1191.
- 40 M. J. Saxton, Biophys. J., 1994, 66, 394–401.
- 41 B. J. Sung and A. Yethiraj, Phys. Rev. Lett., 2006, 96, 228103.
- 42 F. Höfling, T. Franosch and E. Frey, Phys. Rev. Lett., 2006, 96, 165901.
- 43 F. Höfling, T. Munk, E. Frey and T. Franosch, J. Chem. Phys., 2008, 128, 164517.
- 44 B. J. Berne and R. Pecora, Dynamic light scattering, Wiley, New York, 1976.
- 45 J.-P. Hansen and I. McDonald, Theory of Simple Liquids, Academic Press, Amsterdam, 3rd edn., 2006.
- 46 R. Shusterman, T. Gavrinyov and O. Krichevsky, Phys. Rev. Lett., 2008, 100, 098102.
- 47 R. G. Winkler, S. Keller and J. O. Rädler, Phys. Rev. E, 2006, 73, 041919.
- 48 J. Widengren, U. Mets and R. Rigler, J. Phys. Chem, 1995, 99, 13368–13379.
- 49 M. H. Jensen, E. J. Morris and A. C. Simonsen, Langmuir, 2007, 23, 8135–8141.
- 50 U. Mennicke and T. Salditt, Langmuir, 2002, 18, 8172–8177.
- 51 A. Benda, M. Benes, V. Mareček, A. Lhotsky, W. T. Hermens and M. Hof, Langmuir, 2003, 19, 4120–4126.
- 52 T. Wohland, R. Rigler and H. Vogel, Biophys. J., 2001, 80, 2987–2999.
- 53 P. G. Saffman and M. Delbrück, Proc. Natl. Acad. Sci. U. S. A., 1975, 72, 3111–3113.
- 54 Y. Gambin, R. Lopez-Esparza, M. Reffay, E. Sierecki, N. S. Gov, M. Genest, R. S. Hodges and W. Urbach, Proc. Natl. Acad. Sci. U. S. A., 2006, 103, 2098–2102.
- 55 G. Guigas and M. Weiss, Biophys. J., 2006, 91, 2393–2398.
- 56 E. P. Petrov and P. Schwille, in Standardization and Quality Assurance in Fluorescence Measurements II, Springer, 2008, vol. 6, ch. 21, pp. 145–197.
- 57 P. Sengupta, K. Garai, J. Balaji, N. Periasamy and S. Maiti, Biophys. J., 2003, 84, 1977–1984.
- 58 D. ben Avraham and S. Havlin, Diffusion and Reactions in Fractals and Disordered Systems, Cambridge University Press, Cambridge, 2000 (chapter 6).
- 59 A. Lubelski, I. M. Sokolov and J. Klafter, Phys. Rev. Lett., 2008, 100, 250602.
- 60 J. Szymanski and M. Weiss, Phys. Rev. Lett., 2009, 103, 038102.
- 61 K. L. Sebastian, J. Phys. A, 1995, 28, 4305–4311.
- 62 S. Niu and D. Mitchell, Biophys. J., 2005, 89, 1833–1840.