Nuclear Scaling and the EMC Effect
Abstract
Results of recent EMC effect measurements and nuclear scaling measurements have both been attributed to local nuclear density effects and not properties of the bulk nuclear system. This lead us to the phenomenological observation that the ratio of the slopes in the EMC data scale as the ratio of the nuclear scaling plateaus. Using this correlation, we developed a phenomenological relation which reproduces the general trends and features of the EMC effect for nuclei from 3He to 56Fe.
Introduction
In 1983, the European Muon Collaboration measured the deep-inelastic per nucleon cross section ratios of heavy nuclei to deuterium over a broad kinematic range [1]. This ratio revealed an unexpected structure which was subsequently confirmed by SLAC [2] and became known as the EMC effect. These cross section ratios are typically plotted as a function of the Bjorken scaling variable where with Q2 the four momentum transferred to the system, the energy transfer, and the mass of a proton. Plotted this way, there is a sharp rise for , a persistent dip around and a gentle rise from from 0.7 to 0.3. These results have generated considerable experimental and theoretical interest, with the explanation for the effect generally attributed to a change in quark distributions in nuclei or persistent nuclear effects [3, 4].
New high-precision EMC effect experimental data on light nuclei from Jefferson Lab [5] suggest that the slope in the region is a local density effect and not a bulk property of the nuclear medium. At similar four-momentum transfers, data from SLAC and Hall B have shown that the nuclear scaling plateaus, which are related to the high-momentum components of the nuclear wave function [6], are also a local density effect. With these two observations in mind, we noticed that that the ratio of the slopes in the EMC data scale as the ratio of the nuclear scaling plateaus.
Theory calculations have been done that use nucleon momentum distributions to try to reproduce the EMC effect [7, 8, 9, 10], The work of Kumano and Close even showed that local nuclear density effects and quark rescaling models are compatible, but that more data was needed to see if a true correlation exists [7]. In this work, we have used the new nuclear scaling data as a phenomenological tool for determining the magnitude of the high-momentum part of the nucleon momentum distribution for various nuclei.111By the Heisenberg uncertainty principle, , the wide distribution of the high-momentum tail, , implies a small local density, , as compared to the narrower mean field momentum distribution. We also make use of the observed dominance of initial-state quasi-deuteron correlations in nuclei [11, 12] to make a kinematic connection between the scaling plateaus and the EMC slopes.
Nuclear Scaling
In electron scattering, with and Q, Q2 independent plateaus have been observed in inclusive per-nucleon cross-section ratios. This inclusive nuclear scaling was first observed at SLAC [13, 14, 15] and subsequently by experiments at Jefferson Lab [16, 17]. In general, this scaling is attributed to initial-state nucleon-nucleon correlations causing the high-momentum tail in all nuclei. Assuming this is correct, then the magnitude of the nuclear scaling ratios give the relative strength of the nucleon-nucleon correlations in the various nuclei [18, 19].
Confirming this hypothesis, high-momentum recoiling nucleons have been observed in 12C two-nucleon knock-out experiments both with hadronic [11] and leptonic probes [12, 20]. The dominance of proton-neutron pairs to proton-proton pairs in these reactions has been attributed to initial-state tensor correlations as calculated using realistic nucleon-nucleon potentials [21, 22, 23].
The nuclear scaling plateaus in the (e,e’) ratios have been experimentally shown to start when the magnitude of the minimum missing momentum, , of the D(e,e’)pn reaction is greater than the Fermi momentum of 250 MeV/c where is the minimum initial momentum that the struck nucleon must have in order to produce an final state. Remember, for scattering from a free nucleon, there can be no values. To calculate one uses conservation of energy and momentum for quasi-elastic scattering from the deuteron where and are four momenta of the virtual photon, deuteron and recoil nucleon, respectively, along with the constraint that = Q [18, 16, 19].
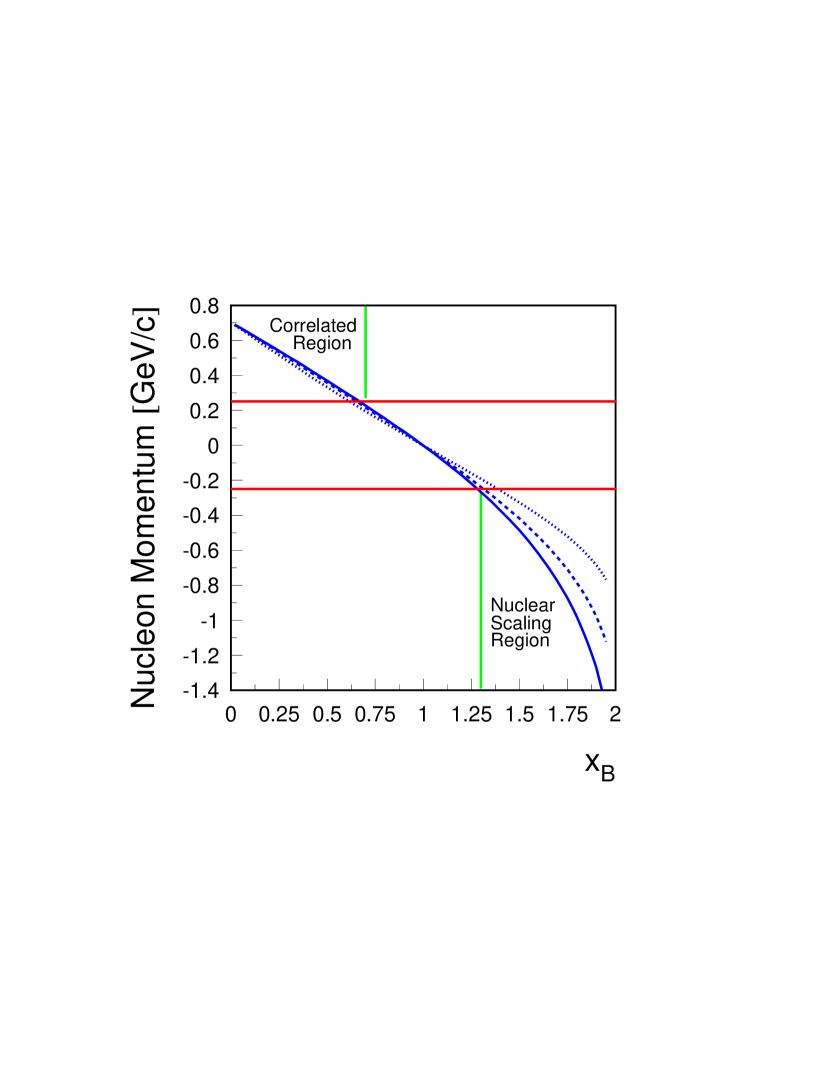
The phase space mapped out by this function for various Q2 is shown in Fig. 1 where the allowed nucleon momenta are negative for and positive for . The curve gives the Q2 dependent minimum kinematically allowed missing momentum, , for the D(e,e’)pn reaction as given value of . As the initial-state involves a correlated pair of nucleons, there is a corresponding value for every value. For example, for a Q2 = 10 [GeV/c]2 the -0.25 GeV/c point at is correlated with the 0.25 GeV/c point at . The areas of correspondence between the scaling region and the correlated region are labeled on Fig. 1 as the nuclear scaling and correlated regions, respectively.
The presence of flat, Q2 independent plateaus in the A(e,e’)/D(e,e’) nuclear scaling data simply indicates that the underlying functional form of the high-momentum distribution for various nuclei is only different by a scale factor. Thus, to a good approximation, one can use nuclear scaling results along with a realistic proton-neutron pair momentum distribution to calculate the absolute strength of the high-momentum tail for various nuclei. To do this, the Argonne v-18 potential [24] was used to calculate the deuteron’s nucleon momentum distribution, , where the function was normalized such that and the functional form of the high-momentum distribution, , of nuclei A was approximated for MeV/c by
| (1) |
where is the Q2 independent per-nucleon nuclear scaling ratio [8] which can be determined directly from experimental data [15, 16]. Thus, Eq. 1 allows a phenomenological calculation of the high-momentum distribution for any nucleus for which the nuclear scaling ratio has been measured. Since most of the new nuclear scaling data is taken as a ratio to 3He instead of D, we did need to use the calculated value of 2 to go from 3He to D [16, 17]; and have used nominal values of 2, 4, 4.8, 5.7 for the 3He, 4He, 12C, and 56Fe to deuterium scaling ratios, , respectively.
The EMC Effect
For electron scattering on a free nucleon, such as the proton, the observed (e,e’) reaction can kinematically cover a range from ; but for nuclei with an atomic mass A, the range can go from . As a thought experiment, one can consider a one-dimensional quasi-deuteron initial state made up of nucleons moving with relative momentum of MeV/c. When probed in quasi-elastic kinematics at a Q2 of 10 [GeV/c]2, this initial state would yield two peaks, one at = 0.7 and another at =1.3. When that same initial-state is probed in deep-inelastic kinematics, it would produce two super-imposed spectrum, one starting at = 1.3 (i.e. the maximum of one of the nucleons) and a second starting at = 0.7. Thus, in this thought experiment, only one nucleon of the two can contribute to an observed cross section in the region while both contribute to the region.
By using the experimental result that high-momentum components of the initial-state are dominated by quasi-deuteron nucleon pairs [12], the correspondence between initial-state momenta and values of as shown in Fig. 1 for a deuteron can be used to make a general connection between the nuclear scaling region and the region. To do this, we simply assume that initial-state nucleons either contribute to the cross section or are in a high-momentum state, like in the thought experiment, that kinematically cannot contribute. Thus, for the region the per-nucleon cross section ratio can be written as
| (2) |
where is the dependent fraction of the inital-state momentum distribution, , that is kinematically forbidden to contribution to the cross section. To calculate the , we use the nucleon momentum distribution, , from Eq. 1 and integrate for a given value of from to infinity
| (3) |
where the function has been divide by two to count only the positive contribution. The results of the integration for a Q2 = 10 [GeV/c]2 for various nuclei and values of are shown in Table 1. For the nuclear scaling plateau region we use
| (4) |
where the values of CA are obtained from experimental data.
| Deuteron | 3He | 4He | 12C | 56Fe | ||
|---|---|---|---|---|---|---|
| [MeV/c] | [%] | [%] | [%] | [%] | [%] | |
| 0.70 | 250 | 2.5 | 5.0 | 10 | 12 | 14.3 |
| 0.68 | 275 | 2.0 | 4.0 | 8.0 | 9.6 | 11.4 |
| 0.6 | 300 | 1.6 | 3.2 | 6.4 | 7.7 | 9.1 |
| 0.5 | 370 | 1.25 | 2.5 | 5.0 | 6.0 | 7.3 |
| 0.45 | 400 | l.1 | 2.2 | 4.4 | 5.3 | 6.5 |
| 0.4 | 440 | 0.9 | 1.8 | 3.6 | 4.3 | 5.2 |
| 0.3 | 500 | 0.65 | 1.3 | 2.6 | 3.1 | 3.7 |
Figure 2 shows the result of Eq. 2 and Eq. 4 for a Q2 of 10 [GeV/c]2 for various nuclei. In order to have the function cover the entire range from , it has been assumed in the limit of high Q2 that the simple Fermi motion can be ignored and a smooth interpolation can be made between the and nuclear scaling plateau, with the only constraint to the function being that the value at equal the value at to cause the known inflection around . The idea of simply connecting the regions with a smooth function is motivated by data where the typical dip around in the quasi-elastic (e,e’) ratios becomes less pronounced as Q2 increases (see Fig. 5.17 of [17]). In fact, the BCDMS collaboration’s Q2 = 50 [GeV/c]2 carbon data follows a smooth exponential in the region [25].

Figure 3 shows EMC data along with result of the calculation from Eq. 2, along with the interpolation to the plateaus. The plots are all made with the same scales and it can be seen that the general trends in the data are matched by this simple phenomenological model.
 |
 |
 |
 |
Summary
In summary, we note that the ratio of nuclear scaling plateaus and the ratio of data following the same pattern. Since recent leptonic and hadronic data which has shown that the nuclear scaling region is dominated by high-momentum initial-state quasi-deuteron pairs, we tried using the kinematics of pairs, to see if that same initial-state could be produce an EMC like effect by assuming the offshell state would not contribute to the measured cross section. Interestingly, this simple model reproduces the general features of the EMC effect, with a slope that in the region decreasing and the upward interpolation for generally agreeing with data. This phenomenological result seems to strengthen the hypothesis that both the EMC effect and nuclear scaling are due to local density effects and related to the high momentum components of the nuclear wave function.
Acknowledgements
This paper was inspired by a conversation between D.H. and Hugh Montgomery where the EMC effect and nuclear scaling were discussed and plots of and data were shown taped together. The paper is dedicated to our deceased colleague Kim Egiyan who pushed us to do the inclusive hadronic scaling experiments at Jefferson Lab. We thank Misak Sargsian for providing the deuteron momentum distribution function and for the constructive comments from Franz Gross and Jerry Miller. This work was supported by the U.S. Department of Energy, the U.S. National Science Foundation, the Israel Science Foundation, and the US-Israeli Bi-National Scientific Foundation. Jefferson Science Associates operates the Thomas Jefferson National Accelerator Facility under DOE contract DE-AC05-06OR23177.
References
- [1] J. J. Aubert, et al., Phys. Lett. B123 (1983) 275.
- [2] J. Gomez, et al., Phys. Rev. D49 (1994) 4348.
- [3] D. F. Geesaman, K. Saito, A. W. Thomas, Ann. Rev. Nucl. Part. Sci. 45 (1995) 337.
- [4] P. R. Norton, Rept. Prog. Phys. 66 (2003) 1253.
- [5] J. Seely, et al., Phys. Rev. Lett. 103 (2009) 202301.
- [6] P. E. Bosted, R. G. Arnold, S. Rock, Z. M. Szalata, Phys. Rev. Lett. 49 (1982) 1380.
- [7] S. Kumano, F. E. Close, Phys. Rev. C41 (1990) 1855.
- [8] C. Ciofi degli Atti, S. Liuti, Phys. Rev. C41 (1990) 1100.
- [9] F. Gross, S. Liuti, Phys. Rev. C45 (1992) 1374.
- [10] A. S. Rinat, M. F. Taragin, M. Viviani, Phys. Rev. C72 (2005) 015211.
- [11] E. Piasetzky, M. Sargsian, L. Frankfurt, M. Strikman, J. W. Watson, Phys. Rev. Lett. 97 (2006) 162504.
- [12] R. Subedi, et al., Science 320 (2008) 1476.
- [13] I. Sick, D. Day, J. S. Mccarthy, Phys. Rev. Lett. 45 (1980) 871.
- [14] D. B. Day, et al., Phys. Rev. Lett. 59 (1987) 427.
- [15] L. L. Frankfurt, M. I. Strikman, D. B. Day, M. Sargsian, Phys. Rev. C48 (1993) 2451.
- [16] K. S. Egiyan, et al., Phys. Rev. C68 (2003) 014313.
- [17] N. Fomin, Inclusive Electron Scattering from Nuclei in the Quasielastic Region at Large Momentum Transfer, Ph.D. Thesis (2008). arXiv:0812.2144.
- [18] M. M. Sargsian, et al., J. Phys. G29 (2003) R1.
- [19] L. Frankfurt, M. Sargsian, M. Strikman, Int. J. Mod. Phys. A23 (2008) 2991.
- [20] R. Shneor, et al., Phys. Rev. Lett. 99 (2007) 072501.
- [21] M. M. Sargsian, T. V. Abrahamyan, M. I. Strikman, L. L. Frankfurt, Phys. Rev. C71 (2005) 044615.
- [22] R. Schiavilla, R. B. Wiringa, S. C. Pieper, J. Carlson, Phys. Rev. Lett. 98 (2007) 132501.
- [23] M. Alvioli, C. Ciofi degli Atti, H. Morita, Phys. Rev. Lett. 100 (2008) 162503.
- [24] R. B. Wiringa, V. G. J. Stoks, R. Schiavilla, Phys. Rev. C51 (1995) 38.
- [25] A. C. Benvenuti, et al., Z. Phys. C63 (1994) 29.