Energy cross-calibration from the first CREAM flight: transition radiation detector versus calorimeter
Abstract
The Cosmic Ray Energetics And Mass (CREAM) balloon experiment had two successful flights in 2004/05 and 2005/06. It was designed to perform energy measurements from a few GeV up to 1000 TeV, taking advantage of different detection techniques. The first instrument, CREAM-1, combined a transition radiation detector with a calorimeter to provide independent energy measurements of cosmic-ray nuclei. Each detector was calibrated with particle beams in a limited range of energies. In order to assess the absolute energy scale of the instrument and to investigate the systematic effects of each technique, a cross-calibration was performed by comparing the two independent energy estimates on selected samples of oxygen and carbon nuclei.
1 Introduction
CREAM is a balloon-borne experiment designed to perform direct measurements of the energy spectra and elemental composition of cosmic rays (CR) up to the PeV scale. Two instruments, launched from McMurdo in 2004 and 2005, flew over Antarctica for 42 and 28 days, respectively. Both instruments achieved single-element discrimination by means of multiple measurements of the particle charge provided by a pixelated silicon charge detector (SCD), a segmented timing-based particle-charge detector (TCD) and a Cherenkov detector (CD). The particle energy was measured by a thin ionization calorimeter (CAL) preceded by a graphite target. During the first flight, the payload was equipped with a Transition Radiation Detector (TRD), thus allowing redundant energy measurements. A detailed description of the instrument can be found elsewhere [1]. In this paper, we present an analysis, based on the first flight data, that shows how it is possible to cross-calibrate the TRD and the calorimeter to assess the absolute scale of energy measurements in CREAM.
2 Complementary techniques for particle energy measurement
Direct measurements of charged CR are based on identification
of the incoming particle and measurement of its energy.
At present, the main active techniques for the determination of CR energy at TeV scale
are based on Ionization Calorimeters (IC)
and TRDs. A combination of a IC and a TRD
was implemented in the first CREAM payload.
The CREAM-1 TRD is made of 512 single-wire mylar thin-walled proportional tubes
inserted in a polystyrene foam radiator structure and arranged in 8 layers,with alternating X/Y orientations.
The 2 cm diameter tubes
are filled with a mixture of 95% xenon 5% methane at 1 atm
which has a high efficiency for TR x-rays of a few tens of keV.
The TRD can measure the energy of primary nuclei with Z3 by multiple independent sampling of
the energy deposit per unit pathlength (dE/dx) in the tubes. The ionization energy loss
increases logarithmically with the Lorentz factor in the relativistic rise region which extends from minimum ionization (MIP)
to the Fermi plateau. In the case of Xe the ratio plateau/MIP is 1.5.
At energies higher than a few hundred GeV/n, the ionization energy loss of a charged particle in Xe saturates.
Nevertheless, the energy can be determined from the additional ionization produced in the tubes by the
TR photons emitted as the particle crosses the foam radiator.
A reliable estimate of the energy deposit
requires a precise measurement of the pathlength of the primary particle traversing the TRD.
For this purpose, the detector
has been designed to provide accurate particle tracking, with a resolution of
the impinging point of the primary particle on the TCD to better than 2 mm. This allows to correct
the response of TCD and CD for
spatial non uniformities; it is also essential to
identify with a low probability of confusion, the TCD paddles and SCD pixel traversed by the
primary particle and hence reconstruct its charge.
Although the main purpose of the CD
is to provide, combined with the TCD signal,
a trigger for relativistic high-Z nuclei,
it can also be used
to measure the velocity of particles at low energies in the range
from the Cherenkov threshold () up to saturation ().
For a detailed description of the TRD and its performance
during the flight
see [2].
The CAL is a stack of 20 tungsten plates (5050 cm2,
each 1 X0 thick) with interleaved active layers
instrumented with 1 cm wide ribbons of 0.5 mm diameter scintillating fibers.
A 0.47 thick carbon target preceding the calorimeter induces a nuclear
interaction of the primary particle which initiates a hadronic shower.
The electromagnetic (e.m.) core of the shower is imaged by the CAL which is sufficiently thick
to contain the shower maximum and finely grained to provide
shower axis reconstruction.
The resolution
of the impact point
on the SCD is about 1 cm.
The concept of IC is imposed by the requirement of
weight reduction, making practically impossible to fly a conventional “total containment” hadronic calorimeters.
In a thin calorimeter, where only the e.m. core of the hadronic shower is sampled, the energy resolution
is affected by the statistical fluctuations
in the fraction of energy carried by secondaries
produced in the shower, whose decays generate the e.m. cascade. As a result, the energy resolution is poor by the standards of total containment hadron calorimetry
in experiments at accelerators.
Nevertheless, it is sufficient to reconstruct the steep energy spectra of CR
nuclei with a nearly energy independent resolution.
3 Calibrations with particle beams
Both the TRD and the CAL were calibrated independently at CERN before the final integration in the payload. The CAL was tested with beams of protons, electrons and heavy ions. While protons and electrons were mainly used to equalize the single ribbons for non-uniformity in light output and gain differences among the photodetectors, a beam of ion fragments was used to verify the linear response of the CAL up to about 8.2 TeV and to measure a nearly flat resolution at energies above 1 TeV [3]. The TRD was tested with protons, electrons and pions in a range of Lorentz factors from 150 to 3105. This allowed to calibrate the instrument in two separate intervals along the specific ionization curve: on the Fermi plateau and in the region of TR saturation. A MonteCarlo (MC) simulation of the apparatus based on GEANT4, including a modelization of the TR emission from the radiator, showed a remarkable agreement with the experimental data and was used to extend the calibration of the detector response at lower values than the ones available with the beam, i.e. to the relativistic rise region (10-500 GeV/n) [4]. However, an independent calibration based on flight data is preferable in order to validate the MC and to avoid systematic errors in the energy measurement of CR nuclei of a few hundred GeV/n. In fact, the TRD capability to provide a precise energy determination in the relativistic rise region is essential for an accurate measurement of the flux ratio of secondary to primary elements in CR, which is one of the main CREAM goals.
4 Cross-calibration with flight data
The TRD can be calibrated with flight data in energy intervals not covered at the beam test, by correlating its response with the energy measurements provided by the CD and the CAL.
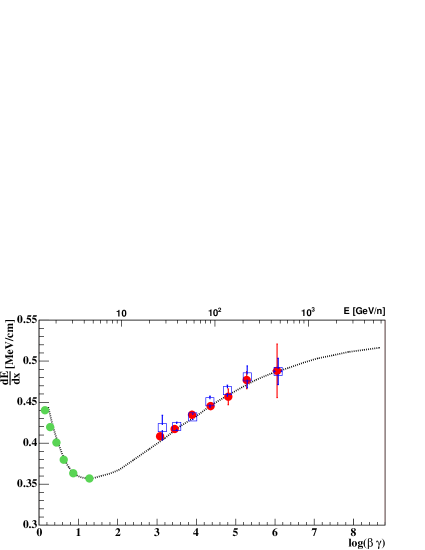
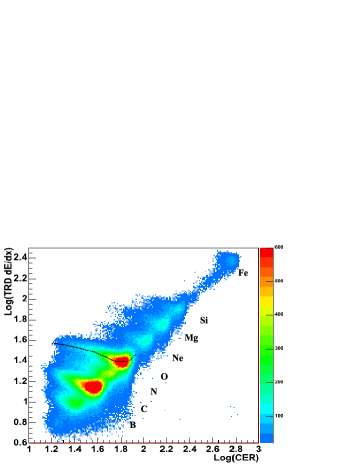
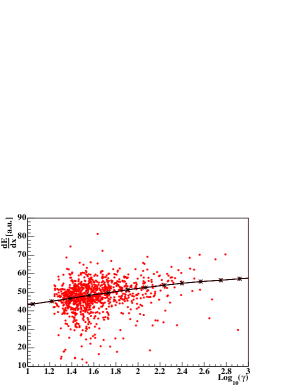
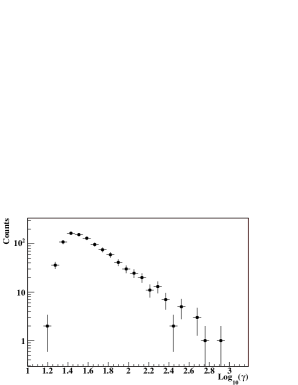
Events were selected by requiring that the primary particle track reconstructed by the TRD was within the TCD acceptance and had at least four proportional tubes hit in each view. The pulse heights of the track-matched TCD paddles were combined with the CD signal to get a measurement of the particle charge. An excellent separation of the charge peaks for elements from beryllium to silicon was obtained, with a charge resolution for carbon and oxygen better than 0.2 [5]. The energy deposit per unit pathlength (dE/dx) in the TRD was extracted with a likelihood fit, taking into account the impact parameters of the primary particle track and the signal in each tube. Events were rejected if the two measurements of dE/dx, obtained by using independently the X and Y views of the TRD, disagreed by more than 20%. The correlation of the measured dE/dx and CD signal (Figure 1) allowed to calibrate the TRD response in the region below the minimum of the specific ionization curve. Six different intervals of were selected with the CD, and in each interval the average dE/dx was measured. The scale factor to convert from arbitrary units (a.u.) to MeV/cm was obtained by matching the minimum ionization of O nuclei to the corresponding point of the MC simulated curve (Figure 3). The Cherenkov emission yield saturates above 10, therefore the calibration of the TRD in the relativistic rise region has to rely on the CAL energy measurement. For this purpose, two samples of C and O nuclei were identified with the primary particle crossing the TRD and then generating a shower in the CAL module. The dE/dx measurement was correlated with the particle energy measured with the CAL. The scatter plot for the O sample is shown in Figure 2 together with its projection on the horizontal axis, which represents the energy distribution reconstructed by the CAL. At values of Log 1.5, it exhibits the typical power-law behaviour expected from the energy dependence of the differential cosmic-ray spectrum. The range of measured has been divided into 7 bins wherein the mean and dE/dx values have been calculated. In this way the relativistic rise of the energy loss distribution was sampled as shown in Figure 3. The carbon points have been rescaled by taking into account the Z2 dependence of dE/dx, in order to plot them on the same scale as the oxygen data. The TRD calibration based on the CAL energy measurement shows excellent agreement with the MC simulation. In this way, we proved that the GEANT4 prediction for the specific ionization in Xe can be used as a reliable calibration to infer the primary particle energy from the dE/dx measured with the TRD, even at energies where the detector was not tested at accelerator beams. Moreover, the correct understanding of the absolute scale of the CAL energy measurement was confirmed.
5 Conclusions
A preliminary analysis of the data from the first flight of CREAM confirmed the possibility to cross-calibrate the energy measurements of TRD and calorimeter.
6 Acknowledgments
This work is supported by NASA, NSF, INFN, PNRA, KICOS, MOST and CSBF.
References
- [1] H. S. Ahn et al. The Cosmic Ray Energetics and Mass (CREAM) Instrument. In press in Nucl. Inst. Meth. A (2007)
- [2] S. P. Wakely et al. Adv. Sp. Res. (2007), doi:10.1016/j.asr.2007.03.080, in press
- [3] H. S. Ahn et al. Nucl. Phys. B (Proc. Suppl.) 150 (2006) 272-275
- [4] P. J. Boyle, S. P. Swordy and S. P. Wakely. Proc. of 28th ICRC (2003) 2233
- [5] S. Coutu et al. Nucl. Inst. Meth. A572 (2007) 485-487