Deep, ultra-high-resolution radio imaging of submillimetre galaxies using Very Long Baseline Interferometry
Abstract
We present continent-scale very-long-baseline interferometry (VLBI) – obtained with the European VLBI Network (EVN) at a wavelength of 18 cm – of six distant, luminous submillimetre-selected galaxies (SMGs). Our images have a synthesized beam width of 30 milliarcsec fwhm – three orders of magnitude smaller in area than the highest resolution Very Large Array (VLA) imaging at this frequency – and are capable of separating radio emission from ultra-compact radio cores (associated with active super-massive black holes – SMBHs) from that due to starburst activity. Despite targeting compact sources – as judged by earlier observations with the VLA and MERLIN – we identify ultra-compact cores in only two of our targets. This suggests that the radio emission from SMGs is produced primarily on larger scales than those probed by the EVN, and therefore is generated by star formation rather than an AGN – a result consistent with other methods used to identify the presence of SMBHs in these systems.
keywords:
galaxies: starburst – galaxies: formation – cosmology: observations – cosmology: early Universe1 Introduction
With bolometric luminosities rivalling quasars, submillimetre galaxies (SMGs) are some of the most extreme objects in the Universe (for a review, see Blain et al., 2002), yet they outnumber similarly luminous quasars by many orders of magnitude (Chapman et al., 2005). Selected via their dust-reprocessed thermal emission, they are thought to be powered by intense bursts of star formation triggered by major mergers of gas-rich galaxies (Tacconi et al., 2006, 2008; Younger et al., 2008a, 2010) at (Chapman et al., 2005) with a significant tail extending out to higher redshifts (Eales et al., 2003; Younger et al., 2007, 2009a; Wang et al., 2007; Wang et al., 2009; Greve et al., 2008; Capak et al., 2008; Schinnerer et al., 2008; Daddi et al., 2009; Coppin et al., 2009), and are the likely progenitors of massive galaxies in the local Universe (Scott et al., 2002; Blain et al., 2004; Smail et al., 2004; Swinbank et al., 2006). In addition, it is thought that infrared- (IR-)luminous objects () come to dominate the cosmic star-formation rate density at high redshift (; Blain et al., 1999; Hopkins et al., 2010; Hopkins & Hernquist, 2010), making the SMG population an important contributor to the build-up of stellar mass during the epoch of galaxy formation.
At the same time, over the past twenty years it has become clear that super-massive black holes (SMBHs) in the nuclei of galaxies are common, even at high redshift (e.g. Ivison et al., 2008) and that their masses are strongly correlated with the stellar component of their host galaxies (e.g., Kormendy & Richstone, 1995; Magorrian et al., 1998; Gebhardt et al., 2000; Ferrarese & Merritt, 2000; Tremaine et al., 2002; Novak et al., 2006; Hopkins et al., 2007b). These correlations are indicative of a close and fundamental link between SMBHs and stellar populations, and the enormous difference () in linear scales suggests that this may be accomplished via accretion-related radio jets or radiatively-driven winds. Recent theoretical models cast the co-evolution of SMBHs and galaxies in the context of a cosmic cycle driven by major mergers (Hopkins et al., 2008b, a, and references within), wherein gas-rich, spiral galaxies collide and trigger a gas inflow, thereby fuelling a nuclear starburst (Hernquist, 1989; Mihos & Hernquist, 1994, 1996) and feedback-regulated SMBH growth (Silk & Rees, 1998; Page et al., 2004; Di Matteo et al., 2005; Hopkins et al., 2007a; Younger et al., 2008b), eventually revealing a bright quasar, after which gas exhaustion and violent relaxation transform the remnant into a red elliptical galaxy (Barnes & Hernquist, 1992).
These models of galaxy evolution, which match constraints from both galaxy (Hopkins et al., 2006) and SMBH populations (Robertson et al., 2006; Hopkins et al., 2007a; Younger et al., 2008b), predict that hyperluminous starbursts at high redshift will be associated with periods of active SMBH growth. SMGs are thus likely candidates for the transition objects that theory predicts should be powered by a mixture of star formation and active black hole growth (see also Younger et al., 2009b). To date, searches for actively growing SMBHs in SMGs have focused on X-ray observations (Alexander et al., 2005, 2008) and mid-IR photometry and spectroscopy (Ivison et al., 2004; Lutz et al., 2005; Menéndez-Delmestre et al., 2007, 2009; Valiante et al., 2007; Pope et al., 2008). Whilst promising, these approaches are often compromised: even hard X-ray searches will miss Compton-thick SMBHs, and the interpretation of mid-IR spectra can be very sensitive to modelling assumptions, especially regarding the origin of power-law spectra (Yun et al., 2001; Younger et al., 2009b).
Very-high-resolution radio imaging, provided by continent-scale very-long-baseline interferometry (VLBI), avoids many of these issues; even in the most extreme environments, the interstellar medium is optically thin to radio emission and the dominant radio emission mechanisms are well understood. In fact, there is a well-known upper limit to the brightness temperature () a starburst can achieve ( k – Condon et al., 1991), and any compact object detected at VLBI resolution will exceed (or be close to) this limit.
A number of authors have used this technique in order to distinguish between AGN and starburst activity in both high-redshift QSOs (Beelen et al., 2004; Momjian et al., 2005, 2007) and in ultra-luminous infrared galaxies (ULIRGs), the low-redshift analogues of the SMGs. The latter are particularly important as they present a far more detailed view of the relationship between the star formation and AGN emission in an intense starburst than will ever be possible in a distant SMG, and aid in the interpretation of these less spatially resolved sources; the synthesised beam of a typical VLBI array is high enough, for example, to resolve individual supernova remnants in local ULIRGs e.g. Arp 220 (Lonsdale et al., 2006) and IRAS 17208-0014 Momjian et al. (2006). Examples of ULIRGs that are believed to contain an AGN include Arp 220 (Downes & Eckart, 2007) and Mrk 273 (Carilli & Taylor, 2000).
Only one VLBI observation of a classical, high-redshift, optically-faint SMG (Momjian et al., 2010) has been published to date, continuum emission from GOODS 850-3 having been detected in a tapered High Sensitivity Array (HSA) image. In this paper we present the first VLBI survey of SMGs, using the European VLBI Network (EVN) to search for ultra-compact cores in a sample of objects in the Lockman Hole. These data, with a synthesized beam size of 30 milliarcsec (mas) fwhm, are the highest-resolution radio detections of SMGs ever achieved and have allowed us to put the tightest constraints to date on the brightness temperatures of a significant sample of high-redshift starbursts.
This paper is organised as follows: in §2 we describe our target selection and in §3 give details of the observing strategy, data reduction and imaging. In §4 we present our high-resolution images of each SMG and describe each source in detail. In §5 we discuss our findings before presenting our conclusions in §6.
Where necessary we have assumed a flat CDM cosmology of , and km s-1 Mpc-1 (Hinshaw et al., 2009).
2 Target Selection and Auxiliary Data
| Name | SHADES | 8-mJy | BOLOCAM | MAMBO |
|---|---|---|---|---|
| SMG06 | LOCK850.30 | LE850.12 | … | … |
| SMG10 | … | … | … | LH1200.008 |
| SMG11 | … | … | 1100.003a | … |
| SMG01 | LOCK850.01 | LE850.01 | 1100.014 | LH 1200.005 |
| SMG02 | LOCK850.04 | LE850.14 | … | LH 1200.003 |
| SMG04 | LOCK850.16 | LE850.07 | … | LH 1200.096 |
| Name | |||||||||
|---|---|---|---|---|---|---|---|---|---|
| () | () | (mJy) | (mJy) | (mJy) | (Jy) | (Jy beam-1) | |||
| SMG06 | 10:52:07.49 | +57:19:04.0 | … | ||||||
| SMG10 | 10:51:41.43 | +57:19:51.9 | … | … | |||||
| SMG11 | 10:52:13.38 | +57:16:05.4 | … | … | … | ||||
| SMG01 | 10:52:01.25 | +57:24:45.8 | , | ||||||
| SMG02 | 10:52:04.23 | +57:26:55.5 | |||||||
| SMG04 | 10:51:51.69 | +57:26:36.1 |
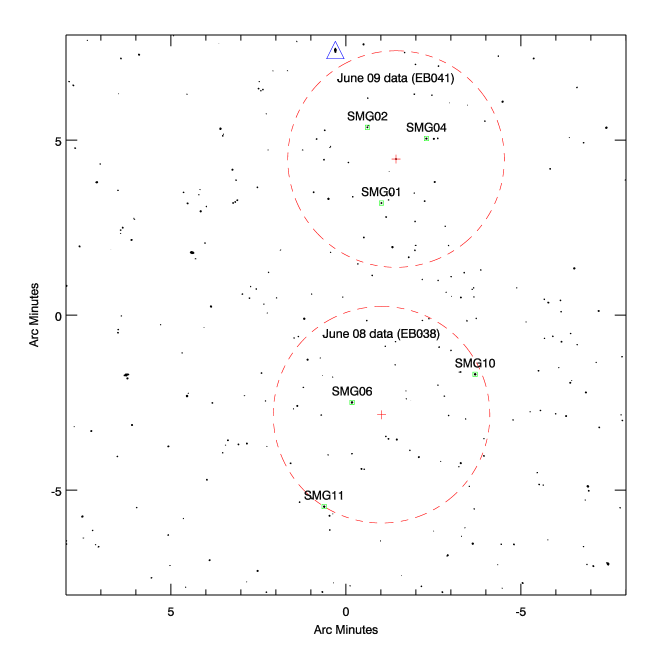
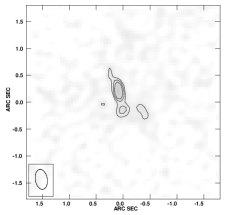
The six targets were drawn from the Biggs & Ivison (2008) sample of SMGs in the Lockman Hole with high-resolution (synthesized beam size 200–500 mas) radio imaging provided by the Multi-Element Radio-Linked Interferometer Network (MERLIN), an array of seven telescopes across the United Kingdom. Table 1 gives the various names of each SMG (most are detected in several submm surveys at different wavelengths) whilst in Table 2 we reproduce various observational data, including the position of the radio counterpart, their submm and 1.4-GHz flux densities (measured both by MERLIN – Biggs & Ivison 2008 – and the VLA – Ivison et al. 2002; Biggs & Ivison 2006) and radio spectral index (Ibar et al., 2009, 2010). A spectroscopic redshift is given where available. The first three SMGs were selected on the basis of their high peak flux density in the MERLIN map, as well as the presence of compact emission that could not be resolved at full MERLIN resolution. In addition, with a maximum separation of 5.7 arcmin, they could be observed with a single pointing of the EVN (the primary beam of the Effelsberg telescope is 6 arcmin at 18 cm; see Fig. 1). In order to widen the range of luminosities in the sample – and hence to probe galaxies representative of the wider SMG population – the second group of SMGs are considerably fainter (by 3, based on their VLA flux densities) and also detected by MERLIN. The maximum separation between these three sources is only 2.2 arcmin, so the primary beam attenuation is reduced compared to EB038 – useful when trying to detect such faint sources.
The 850-m data for this sample was provided by the Submillimeter Common User Bolometer (SCUBA – Holland et al., 1999; Coppin et al., 2006) on the 15-m James Clerk Maxwell Telescope, the 350-m data are from SHARC-ii imaging at the 10-m Caltech Submillimeter Observatory (CSO – Kovács et al., 2006; Coppin et al., 2008), and the millimetre (m) survey data (Greve et al., 2004; Laurent et al., 2005, 2006) are from the MAMBO bolometer (Kreysa et al., 1998) on the Institut de Radio Astronomie Millimétrique’s (IRAM’s) 30-m telescope and from Bolocam (Haig et al., 2004) on the CSO.
3 Observations, Data Reduction and Imaging
Our EVN observations of the Lockman Hole were split into two separate observing sessions, the first targeting the brightest three SMGs (project code EB038; 2008 June 3 and 5) and the second (EB041; 2009 June 5 and 6) targeting the remaining three (Fig. 1). The EB038 and EB041 observations had durations of 12 and 14 hr. The seven telescopes which participated in EB038 are detailed in Table 3 and include the 76-m Lovell telescope at Jodrell Bank, the 100-m telescope at Effelsberg and the Westerbork array of 14 25-m antennas. EB041 also included the 25-m Urumqi dish in Western China, this providing much longer baselines and therefore tighter constraints on the brightness temperature, . Due to a mechanical failure of the Lovell telescope shortly after the beginning of EB041, this was replaced by the 25-m Mark ii telescope (also located at Jodrell Bank) for the vast majority of the project.
| Telescope | Diameter (m) | Project |
|---|---|---|
| Lovell, UK | 76 | EB038 |
| Mark II, UK | 25 | EB041 |
| Effelsberg, Germany | 100 | both |
| Westerbork, The Netherlands | both | |
| Onsala, Sweden | 25 | both |
| Medicina, Italy | 32 | both |
| Noto, Italy | 32 | both |
| Torun, Poland | 32 | both |
| Urumqi, China | 25 | EB041 |
The faintness of the targets made phase referencing essential and for our calibrator we used the unresolved 200-mJy source, J1058+5628, which is located only one degree from the SMGs. For EB038 we used a cycling time of 300 s, but increased this to 600 s for EB041. As explained in §2, the targets lie within the primary beams of the largest telescope and so could be observed in a single pointing. An exception was the WSRT which in phased-array mode has a field of view of only 11 arcsec. Therefore, this telescope was cycled consecutively through the three SMG positions, changing after every second SMG scan. This strategy required that the data be correlated three times, once at each of the three WSRT pointings. The bright quasars 3C 345 and 4C 39.25 were both observed for 600 s as bandpass and delay calibrators.
Both EB038 and EB041 were observed with dual circularly-polarised receivers tuned to a wavelength close to 18 cm. The total bandwidth was 64 MHz (88-MHz bands) sampled at 2 bits for a total data rate of 512 Mbits s-1. The data were correlated at the Joint Institute for VLBI in Europe (JIVE) with the EVN Mark iv Data Processor; bandwidth and time smearing losses were restricted to 10 per cent at a radius of 1 arcmin from the phase centre of each image by averaging the correlator output every 1 s and splitting each 8-MHz band into 64 channels. Unfortunately, during the correlation of data for SMG02, the disk containing the data from the Effelsberg telescope failed. As a result, only one quarter of its data were salvaged and the sensitivity of the images of this source and of SMG04 are significantly worse than those of the other targets.
The data for each target/epoch were reduced using in the following way: initial amplitude calibration was accomplished by applying system temperatures measured during the observations, with the standard gain curves of each antenna. After finding and removing corrupted data (as well as the WSRT scans corresponding to the other two SMG positions) the delay error on each antenna was calculated from a small portion of 4C 39.25 data and removed from the entire dataset. The same source was also used to measure and flatten the bandpass shape in both amplitude and phase. Residual delay, rate and phase solutions were then calculated for the phase calibrator and interpolated onto the target SMG. Finally, time-dependent amplitude gain corrections were determined for J1058+5628 and applied to the target data.
Once calibrated, the target data were imaged using imagr and naturally weighted to ensure maximum sensitivity. For the EB038 data, the combination of this and the coverage resulted in a nearly circular synthesised beam of mas2 and an r.m.s. noise level of 10.5 Jy beam-1. For the EB041 data, we found that applying a Gaussian taper to the weights (with a value of 30 per cent at a distance of 5 M in both the and coordinates) produced the best images. This produces r.m.s. noise levels between 10.7 and 14.3 Jy beam-1 and a synthesised beam with dimensions of mas2.

4 Results
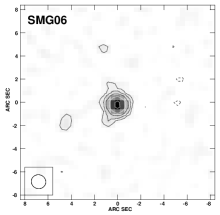
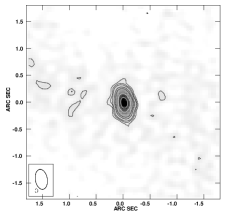
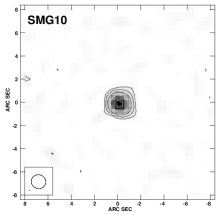
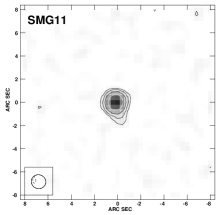
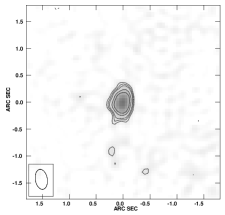
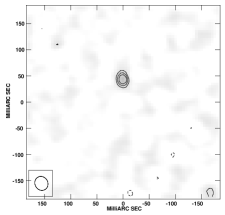
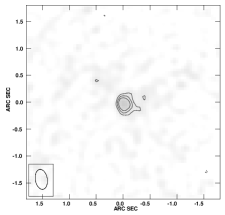
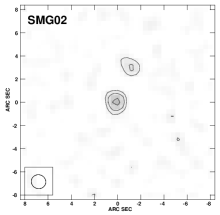
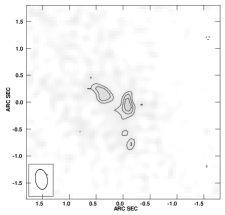
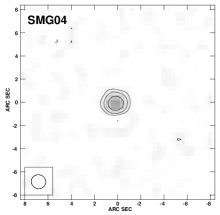
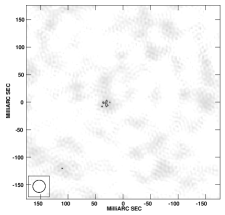
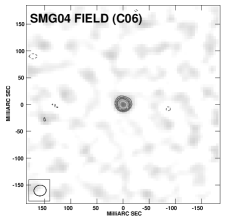
The final images are shown in Fig. 2. Of the six SMGs that we targeted, two (SMG06 and SMG11) have been detected. Of the other four, we have searched for emission on larger scales by tapering the data in the () plane. The shortest baseline in our EVN array (between the WSRT and Effelsberg) is also the most sensitive and corresponds to emission on scales of approximately 100 mas, still a factor of four smaller in beam area than that of the MERLIN maps. This, combined with the tapered maps having sensitivities that are poorer by about 50 per cent and the higher sidelobes in the synthesised beam, resulted in the continued non-detection of all SMGs other than SMG06 and 11.
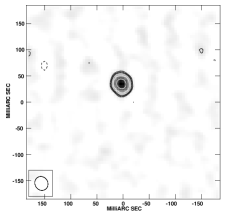
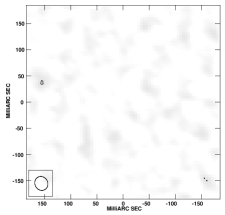
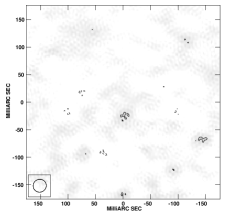
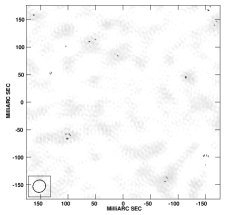
The lack of detections from the EB041 data might be ascribed to problems with the observations (especially the phase referencing) and/or the data reduction. However, as our data were correlated with a large number of channels and short integration times we can search for emission from sources elsewhere in each SMG’s field. Three clear detections were made, one in each field and are shown in Fig. 4. We can be confident therefore that the phase referencing was successful and that the failure to detect emission from SMG01, SMG02 and SMG04 is due to the lack of suitably-bright compact emission in these sources.
For the two detections, we have measured their flux densities using jmfit in . The fitted flux density values need to be corrected for the attenuation of the primary beam and, as with the MERLIN flux densities, this is not straightforward because of the different diameters of the telescopes. We have therefore taken the weighted mean of the attenuation factors for each baseline, assuming that the primary beam of each is Gaussian in form and using the Strom (2004) formulism for the primary beam of an interferometer pair. The resulting values and the corrected peak flux densities are both shown in Table 4.
The attenuation factors are generally insignificant, apart from SMG10 and SMG11. As already noted, all MERLIN flux densities have been corrected for bandwidth smearing and primary beam attenuation, the latter calculated in a similar fashion to the EVN values. The pointing centre of the MERLIN observations was the centre of Fig. 1 and so the attenuation factors are in general larger than for the EVN.
We now give brief descriptions of each source:
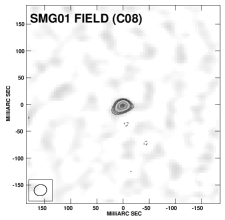
SMG01: The first source of the faint subsample is actually the brightest submm source in the Lockman Hole East region (850.01). Recent Spitzer mid-IR spectroscopy has determined a reliable redshift, (Coppin et al., 2010). SMG01 is detected as a single component by MERLIN with a 1.4-GHz flux of 90 Jy, a morphology that is consistent with its flat spectrum, . This would have corresponded to a 9- detection were it unresolved at the EVN resolution, but only weak (3- i.e. 30 Jy beam-1 peak) emission is seen near the centre of the map.
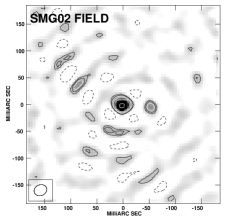
SMG02: The MERLIN map shows two distinct components, but neither are detected in the EVN image.
SMG04: The MERLIN map is dominated by a single component which is elongated slightly, north-south. There is no significant detection in the VLBI map, although we note that there is weak (3- i.e. 45 Jy beam-1 peak) emission in the EVN map close to the expected position of the source.
SMG06: This source is detected robustly by the EVN, is found to be unresolved by jmfit and has a flux density that is significantly in excess of the VLA value, presumably due to the source variability first noted by Ivison et al. (2002). The MERLIN image is slightly resolved, but has a peak flux density (296 Jy beam-1) that is similar to the EVN value. SMG06 has a highly-inverted radio spectrum, , as also noted by Ivison et al. (2002).
SMG10: Despite being the brightest radio source in our sample (VLA flux density = 295 Jy), SMG10 is not detected by our EVN observations. An examination of the MERLIN map shows that this source contains two components, although the brighter of the two dominates, with a peak flux density of 157 Jy beam-1. It is possible that the weaker of the two components represents a jet, but it could equally be one component of a late-stage merger. The radio spectral index of the entire system, , is consistent with an optically-thin radio jet or a canonical starburst (Ibar et al., 2010). As noted by Ivison et al. (2007), matched high-resolution imaging at multiple frequencies are required to disentangle the various emission components in sources like SMG10.
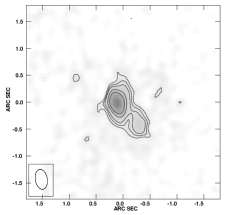
SMG11: This source is also detected by the EVN, but at a considerably lower significance than SMG06, partly due to the primary-beam attenuation. Even taking this into account, only 38 per cent of the VLA flux is recovered. The MERLIN image is dominated by a single (resolved) component with a peak flux density of 209 Jy beam-1. The EVN detection is also marginally resolved, approximately along the north-south axis. The deconvolved size along this axis is 20 mas which is equivalent to a spatial extent of 165 pc at the assumed redshift of 2.4 for this source.
5 Discussion
The power of true, continent-scale VLBI instruments like the EVN to identify actively growing SMBHs lies in their ability to distinguish between different emission mechanisms via , separating ultra-compact radio cores from more extended emission (Lonsdale et al., 1993). Condon et al. (1991) showed that there exists a maximum brightness temperature, , for radio emission associated with a starburst. Assuming a canonical starburst i.e. synchrotron, with a spectral index of , an electron kinetic temperature of K and scaling the observed temperature to the rest-frame of the SMG, we derive maximum values of of approximately K for all our sources. Both of our EVN detections shown in Fig. 2 have K (Table 4), significantly above this critical value and both are therefore extremely likely to be produced by an active SMBH.
For the SMGs that are not detected, Table 4 shows that at most one half of the radio emission detected by the VLA could be contained within a compact – i.e. VLBI – component and therefore that the implied upper limits on are rather low, K for each. Although the limits are not quite low enough to definitively rule out the presence of a radio-emitting AGN in these SMGs, if such a component is present it must be very near the level of detectability in our EVN images.
What is clear though is that for these four systems the bulk of the radio emission must arise on scales larger than the EVN beam. This can be attributed to several mechanisms: cosmic rays accelerated by supernova remnants created by short-lived, massive stars (i.e. star-forming galaxies obeying the far-IR/radio correlation: Condon, 1992; Thompson et al., 2006; Ibar et al., 2008; Lacki et al., 2009; Lacki & Thompson, 2009; Ivison et al., 2010a), or low-surface-brightness AGN-driven radio emission, e.g. jets. Given that the presence of an AGN seems unlikely given the non-detection of compact components in 4 out of 6 of the SMGs, the evidence favours the first explanation, i.e. that the radio emission in these objects is predominantly produced by a starburst. Furthermore, since this sample was selected for compact emission at 300-mas resolution and as most SMGs display extended radio emission at that resolution (Biggs & Ivison, 2008), these results suggest that the radio luminosity produced by SMGs is generally dominated by star formation, a similar finding to that of Momjian et al. (2010) who, in the only other published VLBI observation of an SMG to date, find that GOODS 850-3 is also consistent with star formation being the origin of the radio emission.
It is also possible that the clearest case of an AGN detection in our sample, SMG06, may not actually be a starburst galaxy at all, but a highly-obscured AGN-dominated system. The presence of an AGN is virtually guaranteed by the source variability that results in the EVN flux being in excess of that detected by the VLA, but the large EVN flux also leaves very little or no flux that might originate from a powerful starburst. In this scenario, the slight resolution of the MERLIN image might be due to a radio jet that is resolved out by the EVN beam although we stress that the evidence for resolution in the MERLIN image is slight, the total flux only exceeding the peak flux by 9 per cent. However, given that the source has clearly brightened since the VLA observations in 2001, simultaneous EVN and VLA imaging might have detected a clear excess of flux with the larger beam.
| Name | r.m.s. noise | Primary beam | EVN peak flux | EVN total flux | Recovered VLA | Spatial Resolution | |
|---|---|---|---|---|---|---|---|
| (Jy beam-1) | attenuation | (Jy beam-1) | (Jy) | flux fraction | (K) | (pc2) | |
| SMG06 | 10.5 | 0.98 | 1.24 | ||||
| SMG10 | 10.3 | 0.85 | … | ||||
| SMG11 | 10.6 | 0.83 | 0.38 | ||||
| SMG01 | 10.7 | 0.97 | … | ||||
| SMG02 | 11.7 | 0.97 | … | ||||
| SMG04 | 14.3 | 0.98 | … |
That starburst emission is dominant in our sample is not necessarily unexpected, given the predictions of current models of SMG formation and evolution (e.g., Baugh et al., 2005; Swinbank et al., 2008; Narayanan et al., 2010, 2009a, 2009b; Davé et al., 2010) and observations (e.g. Chapman et al., 2004; Alexander et al., 2005; Valiante et al., 2007; Younger et al., 2008a, 2010; Pope et al., 2008; Biggs & Ivison, 2008; Menéndez-Delmestre et al., 2007, 2009; Ivison et al., 2010b) which suggest that the luminosity of SMGs is dominated by star formation. However, it is not necessarily consistent with observations of the far-IR/radio correlation in these systems. While several authors have claimed that the local correlation holds at high redshift (e.g. Garrett, 2002; Appleton et al., 2004; Ibar et al., 2008; Younger et al., 2009c; Murphy, 2009), SMGs have been found to fall systematically below the local relation. This is usually taken to be indicative of AGN activity (e.g. Condon, 1992) and therefore potentially in conflict with a diagnosis of star-formation-dominated radio emission.
In Table 5, we summarise the far-IR/radio properties for the sample presented in this work. All available far-IR photometry was fitted with an isothermal greybody (Hildebrand, 1983) with – where is the dust emissivity, is the physical dust temperature, and is the Planck function – and the errors in the fitted parameters were estimated using a Monte Carlo simulation assuming Gaussian errors in the photometric data. This form of the greybody function assumes the interstellar medium is optically thin in the far-IR, which may break down in the most luminous starbursts (e.g., Scoville et al., 1991; Downes & Solomon, 1998; Papadopoulos et al., 2010), but while the fitted temperature is sensitive to the the full emissivity term, and (the logarithmic far-IR/radio ratio) are robust for GHz (see also Yun & Carilli, 2002).
For SMG10 and SMG11, which have only one photometric point available, we have fixed K, appropriate for typical SMGs (Kovács et al., 2006; Coppin et al., 2008), and for SMG11 we have assumed (the median and interquartile range for SMGs with spectroscopic redshifts – Chapman et al., 2005). We have also fixed , which is consistent with local ULIRGs (Dunne et al., 2000; Yang & Phillips, 2007) as well as current dust models (Weingartner & Draine, 2001). For the radio, we adopt radio spectral slopes derived from 610-MHz maps obtained with the GMRT (Ibar et al., 2009, 2010) in conjunction with the VLA 1.4-GHz data. As with the mean estimated for SMGs with 350-m photometry (: Kovács et al., 2006), the objects in this sample fall below the local value. In fact, the mean for the star-formation-dominated SMGs with no detection in EVN imaging is ; well below the local value of (Yun et al., 2001).
| Name | ) | |||
|---|---|---|---|---|
| (K) | ||||
| SMG06 | ||||
| SMG10 | ||||
| SMG11 | ||||
| SMG01 | ||||
| SMG02 | ||||
| SMG04 |
There are three possible explanations for this discrepancy. First, owing to a combination of sparse sampling and bad approximations (e.g. an isothermal dust population; see Clements et al., 2010), it may be that the far-IR luminosity is systematically underestimated and these objects do, in fact, fall on the local relation. Second, despite some observational evidence to the contrary (e.g., Garrett, 2002; Appleton et al., 2004; Younger et al., 2009c), the far-IR/radio correlation could evolve with redshift and/or environment (Ivison et al., 2010a). Finally, because SMGs are thought to be driven by major mergers (Greve et al., 2005; Tacconi et al., 2006, 2008; Younger et al., 2008a, 2010; Narayanan et al., 2010, 2009a), there could be luminous synchrotron bridges analogous to those seen in interacting systems in the local Universe (Condon et al., 1993, 2002; Murphy, 2009). We note that there are also several more prosaic explanations, e.g. sample bias, flux boosting and/or mis-identifications in the radio waveband.

For those targets with detections – SMG06 and SMG11 – we can use their inferred radio luminosity to estimate the SMBH mass. Radio observations of quasars – including both radio-loud and radio-quiet objects – have established a strong correlation between their radio luminosity and SMBH mass (Lacy et al., 2001). Assuming that this relation holds for AGN in heavily obscured environments, and that accretion is Eddington-limited (which is expected during the peak of both starburst and SMBH activity from merger-driven models – Springel et al., 2005), then this observed relation is:
where is measured in the rest frame. Though the intrinsic scatter is large – approximately 1.1 dex in at fixed – we can use these observations to provide a rough estimate of the masses of SMBHs detected in the EVN imaging. Again, for the radio we adopt the spectral slopes determined using 610-MHz maps obtained with the GMRT (Ibar et al., 2009, 2010) and estimate black hole masses for SMG06 and SMG11 of 8.7 and 9.1 respectively. Errors on these are taken to be equal to the intrinsic scatter (1.1 dex) in the Lacy et al. (2001) relationship.
At the same time, for the non-detections (SMG10, SMG01, SMG02, and SMG04), we can utilise the observed correlation to derive upper limits on for these systems. This again requires we assume that no radio-quiet AGN are present, and that emission from large-scale jets is both negligible in these systems and in driving the observed correlation, and therefore represents a fairly rough estimate. However, keeping these assumptions in mind we find the 3– detections for SMG10, SMG01, SMG02 and SMG04 imply upper limits of 8.1, 8.2, 7.5 and 7.6, respectively.
Stellar masses and their associated uncertainties (Table 5) were then estimated from model fits to the observed optical–IR photometry following the methodology of Dye et al. (2008). The resulting correlation with SMBH mass is presented in Fig. 5 along with the empirical relationship determined by Häring & Rix (2004) for a sample of 30 nearby galaxies. While there is considerable uncertainty in the inferred SMBH masses (and also in the assumed Eddington ratio) owing to the large intrinsic scatter in the observed radio luminosity-black hole mass relation, we find that the two SMGs with EVN detections are statistically consistent with the local relation to within the systematic uncertainty in the black hole mass estimates.
Of the non-detections, the predicted black hole masses are lower than for the EVN-detected SMGs. Only SMG10 is clearly consistent with the Häring & Rix (2004) local relationship although the uncertainties are such that two others could also be classed as consistent. In only one case (SMG02) does it appear likely that the black hole is undermassive compared to the theoretical relation. However, as they are upper limits, it cannot be ruled out that all are undermassive, a result that would be consistent with the conclusions of Alexander et al. (2008) using X-ray photometry, and with the expectations of current theoretical models (Narayanan et al., 2010, 2009a) i.e. that submillimetre selection preferentially identifies starbursts, prior to the peak of SMBH activity in massive, gas-rich systems.
6 Conclusions
We have undertaken a program designed to uncover AGN radio cores in a sample of SMGs in the Lockman Hole, using very-long-baseline interferometry with the EVN. Our sensitive, high-resolution images have detected only two of our six targets, despite a strong selection bias in favour of compact emission. From their brightness temperatures, there can be little doubt that we are seeing radio emission from active nuclei. For the other four SMGs we place upper limits on the radio flux density of any compact component associated with an AGN and conclude that star formation is probably the dominant source of their radio emission.
Acknowledgements
The European VLBI Network is a joint facility of European, Chinese, South African and other radio astronomy institutes funded by their national research councils. This work has benefited from research funding from the European Community’s sixth Framework Programme under RadioNet R113CT 2003 5058187. This work has also been supported by the European Community Framework Programme 7, Advanced Radio Astronomy in Europe, grant agreement nl.: 227290. JDY acknowledges support from NASA through Hubble Fellowship grant #HF-51266.01, awarded by the Space Telescope Science Institute, which is operated by the Association of Universities for Research in Astronomy, Inc., for NASA, under contract NAS 5-26555. RJI acknowledges an RCUK Individual Merit award. We thank the referee for their helpful comments.
References
- Alexander et al. (2005) Alexander D. M., Bauer F. E., Chapman S. C., Smail I., Blain A. W., Brandt W. N., Ivison R. J., 2005, ApJ, 632, 736
- Alexander et al. (2008) Alexander D. M. et al., 2008, AJ, 135, 1968
- Appleton et al. (2004) Appleton P. N. et al., 2004, ApJS, 154, 147
- Barnes & Hernquist (1992) Barnes J. E., Hernquist L., 1992, ARA&A, 30, 705
- Baugh et al. (2005) Baugh C. M., Lacey C. G., Frenk C. S., Granato G. L., Silva L., Bressan A., Benson A. J., Cole S., 2005, MNRAS, 356, 1191
- Beelen et al. (2004) Beelen A. et al., 2004, A&A, 423, 441
- Biggs & Ivison (2006) Biggs A. D., Ivison R. J., 2006, MNRAS, 371, 963
- Biggs & Ivison (2008) Biggs A. D., Ivison R. J., 2008, MNRAS, 385, 893
- Blain et al. (2004) Blain A. W., Chapman S. C., Smail I., Ivison R., 2004, ApJ, 611, 725
- Blain et al. (1999) Blain A. W., Smail I., Ivison R. J., Kneib J., 1999, MNRAS, 302, 632
- Blain et al. (2002) Blain A. W., Smail I., Ivison R. J., Kneib J., Frayer D. T., 2002, Phys. Rep., 369, 111
- Capak et al. (2008) Capak P. et al., 2008, ApJ, 681, L53
- Carilli & Taylor (2000) Carilli C. L., Taylor G. B., 2000, ApJ, 532, L95
- Chapman et al. (2005) Chapman S. C., Blain A. W., Smail I., Ivison R. J., 2005, ApJ, 622, 772
- Chapman et al. (2004) Chapman S. C., Smail I., Windhorst R., Muxlow T., Ivison R. J., 2004, ApJ, 611, 732
- Clements et al. (2010) Clements D. L., Dunne L., Eales S., 2010, MNRAS, 403, 274
- Condon (1992) Condon J. J., 1992, ARA&A, 30, 575
- Condon et al. (2002) Condon J. J., Helou G., Jarrett T. H., 2002, AJ, 123, 1881
- Condon et al. (1993) Condon J. J., Helou G., Sanders D. B., Soifer B. T., 1993, AJ, 105, 1730
- Condon et al. (1991) Condon J. J., Huang Z., Yin Q. F., Thuan T. X., 1991, ApJ, 378, 65
- Coppin et al. (2006) Coppin K. et al., 2006, MNRAS, 372, 1621
- Coppin et al. (2008) Coppin K. et al., 2008, MNRAS, 384, 1597
- Coppin et al. (2010) Coppin K. et al., 2010, ArXiv e-prints
- Coppin et al. (2009) Coppin K. E. K. et al., 2009, MNRAS, 395, 1905
- Daddi et al. (2009) Daddi E., others , 2009, ApJ, 694, 1517
- Davé et al. (2010) Davé R., Finlator K., Oppenheimer B. D., Fardal M., Katz N., Kereš D., Weinberg D. H., 2010, MNRAS, 360
- Di Matteo et al. (2005) Di Matteo T., Springel V., Hernquist L., 2005, Nature, 433, 604
- Downes & Eckart (2007) Downes D., Eckart A., 2007, A&A, 468, L57
- Downes & Solomon (1998) Downes D., Solomon P. M., 1998, ApJ, 507, 615
- Dunne et al. (2000) Dunne L., Eales S., Edmunds M., Ivison R., Alexander P., Clements D. L., 2000, MNRAS, 315, 115
- Dye et al. (2008) Dye S. et al., 2008, MNRAS, 386, 1107
- Eales et al. (2003) Eales S., Bertoldi F., Ivison R., Carilli C., Dunne L., Owen F., 2003, MNRAS, 344, 169
- Ferrarese & Merritt (2000) Ferrarese L., Merritt D., 2000, ApJ, 539, L9
- Garrett (2002) Garrett M. A., 2002, A&A, 384, L19
- Gebhardt et al. (2000) Gebhardt K. et al., 2000, ApJ, 539, L13
- Greve et al. (2005) Greve T. R. et al., 2005, MNRAS, 359, 1165
- Greve et al. (2004) Greve T. R., Ivison R. J., Bertoldi F., Stevens J. A., Dunlop J. S., Lutz D., Carilli C. L., 2004, MNRAS, 354, 779
- Greve et al. (2008) Greve T. R., Pope A., Scott D., Ivison R. J., Borys C., Conselice C. J., Bertoldi F., 2008, MNRAS, 389, 1489
- Haig et al. (2004) Haig D. J. et al., 2004, in Society of Photo-Optical Instrumentation Engineers (SPIE) Conference Series, Vol. 5498, C. M. Bradford, P. A. R. Ade, J. E. Aguirre, J. J. Bock, M. Dragovan, L. Duband, L. Earle, J. Glenn, H. Matsuhara, B. J. Naylor, H. T. Nguyen, M. Yun, & J. Zmuidzinas , ed, Society of Photo-Optical Instrumentation Engineers (SPIE) Conference Series, p. 78
- Häring & Rix (2004) Häring N., Rix H., 2004, ApJ, 604, L89
- Hernquist (1989) Hernquist L., 1989, Nature, 340, 687
- Hildebrand (1983) Hildebrand R. H., 1983, QJRAS, 24, 267
- Hinshaw et al. (2009) Hinshaw G. et al., 2009, ApJS, 180, 225
- Holland et al. (1999) Holland W. S. et al., 1999, MNRAS, 303, 659
- Hopkins et al. (2008a) Hopkins P. F., Cox T. J., Kereš D., Hernquist L., 2008a, ApJS, 175, 390
- Hopkins & Hernquist (2010) Hopkins P. F., Hernquist L., 2010, MNRAS, 402, 985
- Hopkins et al. (2006) Hopkins P. F., Hernquist L., Cox T. J., Di Matteo T., Robertson B., Springel V., 2006, ApJS, 163, 1
- Hopkins et al. (2008b) Hopkins P. F., Hernquist L., Cox T. J., Kereš D., 2008b, ApJS, 175, 356
- Hopkins et al. (2007a) Hopkins P. F., Hernquist L., Cox T. J., Robertson B., Krause E., 2007a, ApJ, 669, 45
- Hopkins et al. (2007b) Hopkins P. F., Hernquist L., Cox T. J., Robertson B., Krause E., 2007b, ApJ, 669, 67
- Hopkins et al. (2010) Hopkins P. F., Younger J. D., Hayward C. C., Narayanan D., Hernquist L., 2010, MNRAS, 402, 1693
- Ibar et al. (2008) Ibar E. et al., 2008, MNRAS, 386, 953
- Ibar et al. (2010) Ibar E., Ivison R. J., Best P. N., Coppin K., Pope A., Smail I., Dunlop J. S., 2010, MNRAS, 401, L53
- Ibar et al. (2009) Ibar E., Ivison R. J., Biggs A. D., Lal D. V., Best P. N., Green D. A., 2009, MNRAS, 397, 281
- Ivison et al. (2010a) Ivison R. J. et al., 2010a, MNRAS, 402, 245
- Ivison et al. (2007) Ivison R. J. et al., 2007, ApJ, 660, L77
- Ivison et al. (2004) Ivison R. J. et al., 2004, ApJS, 154, 124
- Ivison et al. (2002) Ivison R. J. et al., 2002, MNRAS, 337, 1
- Ivison et al. (2008) Ivison R. J. et al., 2008, MNRAS, 390, 1117
- Ivison et al. (2010b) Ivison R. J., Smail I., Papadopoulos P. P., Wold I., Richard J., Swinbank A. M., Kneib J., Owen F. N., 2010b, MNRAS, 261
- Kormendy & Richstone (1995) Kormendy J., Richstone D., 1995, ARA&A, 33, 581
- Kovács et al. (2006) Kovács A., Chapman S. C., Dowell C. D., Blain A. W., Ivison R. J., Smail I., Phillips T. G., 2006, ApJ, 650, 592
- Kreysa et al. (1998) Kreysa E. et al., 1998, in Society of Photo-Optical Instrumentation Engineers (SPIE) Conference Series, Vol. 3357, T. G. Phillips , ed, Society of Photo-Optical Instrumentation Engineers (SPIE) Conference Series, p. 319
- Lacki & Thompson (2009) Lacki B. C., Thompson T. A., 2009, ArXiv e-prints
- Lacki et al. (2009) Lacki B. C., Thompson T. A., Quataert E., 2009, ArXiv e-prints
- Lacy et al. (2001) Lacy M., Laurent-Muehleisen S. A., Ridgway S. E., Becker R. H., White R. L., 2001, ApJ, 551, L17
- Laurent et al. (2005) Laurent G. T. et al., 2005, ApJ, 623, 742
- Laurent et al. (2006) Laurent G. T. et al., 2006, ApJ, 643, 38
- Lonsdale et al. (2006) Lonsdale C. J., Diamond P. J., Thrall H., Smith H. E., Lonsdale C. J., 2006, ApJ, 647, 185
- Lonsdale et al. (1993) Lonsdale C. J., Smith H. J., Lonsdale C. J., 1993, ApJ, 405, L9
- Lutz et al. (2005) Lutz D., Valiante E., Sturm E., Genzel R., Tacconi L. J., Lehnert M. D., Sternberg A., Baker A. J., 2005, ApJ, 625, L83
- Magorrian et al. (1998) Magorrian J. et al., 1998, AJ, 115, 2285
- Menéndez-Delmestre et al. (2007) Menéndez-Delmestre K. et al., 2007, ApJ, 655, L65
- Menéndez-Delmestre et al. (2009) Menéndez-Delmestre K. et al., 2009, ApJ, 699, 667
- Mihos & Hernquist (1994) Mihos J. C., Hernquist L., 1994, ApJ, 431, L9
- Mihos & Hernquist (1996) Mihos J. C., Hernquist L., 1996, ApJ, 464, 641
- Momjian et al. (2005) Momjian E., Carilli C. L., Petric A. O., 2005, AJ, 129, 1809
- Momjian et al. (2007) Momjian E., Carilli C. L., Riechers D. A., Walter F., 2007, AJ, 134, 694
- Momjian et al. (2006) Momjian E., Romney J. D., Carilli C. L., Troland T. H., 2006, ApJ, 653, 1172
- Momjian et al. (2010) Momjian E., Wang W., Knudsen K. K., Carilli C. L., Cowie L. L., Barger A. J., 2010, AJ, 139, 1622
- Murphy (2009) Murphy E. J., 2009, ApJ, 706, 482
- Narayanan et al. (2009a) Narayanan D., Cox T. J., Hayward C. C., Younger J. D., Hernquist L., 2009a, MNRAS, 400, 1919
- Narayanan et al. (2009b) Narayanan D. et al., 2009b, ArXiv e-prints
- Narayanan et al. (2010) Narayanan D., Hayward C. C., Cox T. J., Hernquist L., Jonsson P., Younger J. D., Groves B., 2010, MNRAS, 401, 1613
- Novak et al. (2006) Novak G. S., Faber S. M., Dekel A., 2006, ApJ, 637, 96
- Page et al. (2004) Page M. J., Stevens J. A., Ivison R. J., Carrera F. J., 2004, ApJ, 611, L85
- Papadopoulos et al. (2010) Papadopoulos P. P., Isaak K., van der Werf P., 2010, ApJ, 711, 757
- Pope et al. (2008) Pope A. et al., 2008, ApJ, 675, 1171
- Robertson et al. (2006) Robertson B., Hernquist L., Cox T. J., Di Matteo T., Hopkins P. F., Martini P., Springel V., 2006, ApJ, 641, 90
- Schinnerer et al. (2008) Schinnerer E. et al., 2008, ApJ, 689, L5
- Scott et al. (2002) Scott S. E. et al., 2002, MNRAS, 331, 817
- Scoville et al. (1991) Scoville N. Z., Sargent A. I., Sanders D. B., Soifer B. T., 1991, ApJ, 366, L5
- Silk & Rees (1998) Silk J., Rees M. J., 1998, A&A, 331, L1
- Smail et al. (2004) Smail I., Chapman S. C., Blain A. W., Ivison R. J., 2004, ApJ, 616, 71
- Springel et al. (2005) Springel V., Di Matteo T., Hernquist L., 2005, MNRAS, 361, 776
- Strom (2004) Strom R., 2004, in R. Bachiller, F. Colomer, J.-F. Desmurs, & P. de Vicente , ed, European VLBI Network on New Developments in VLBI Science and Technology, p. 273
- Swinbank et al. (2006) Swinbank A. M., Chapman S. C., Smail I., Lindner C., Borys C., Blain A. W., Ivison R. J., Lewis G. F., 2006, MNRAS, 371, 465
- Swinbank et al. (2008) Swinbank A. M. et al., 2008, MNRAS, 391, 420
- Tacconi et al. (2008) Tacconi L. J. et al., 2008, ApJ, 680, 246
- Tacconi et al. (2006) Tacconi L. J. et al., 2006, ApJ, 640, 228
- Thompson et al. (2006) Thompson T. A., Quataert E., Waxman E., Murray N., Martin C. L., 2006, ApJ, 645, 186
- Tremaine et al. (2002) Tremaine S. et al., 2002, ApJ, 574, 740
- Valiante et al. (2007) Valiante E., Lutz D., Sturm E., Genzel R., Tacconi L. J., Lehnert M. D., Baker A. J., 2007, ApJ, 660, 1060
- Wang et al. (2009) Wang W., Barger A. J., Cowie L. L., 2009, ApJ, 690, 319
- Wang et al. (2007) Wang W., Cowie L. L., van Saders J., Barger A. J., Williams J. P., 2007, ApJ, 670, L89
- Weingartner & Draine (2001) Weingartner J. C., Draine B. T., 2001, ApJ, 548, 296
- Wright (2006) Wright E. L., 2006, PASP, 118, 1711
- Yang & Phillips (2007) Yang M., Phillips T., 2007, ApJ, 662, 284
- Younger et al. (2010) Younger J. D. et al., 2010, ArXiv e-prints
- Younger et al. (2007) Younger J. D. et al., 2007, ApJ, 671, 1531
- Younger et al. (2009a) Younger J. D. et al., 2009a, ApJ, 704, 803
- Younger et al. (2008a) Younger J. D. et al., 2008a, ApJ, 688, 59
- Younger et al. (2009b) Younger J. D., Hayward C. C., Narayanan D., Cox T. J., Hernquist L., Jonsson P., 2009b, MNRAS, 396, L66
- Younger et al. (2008b) Younger J. D., Hopkins P. F., Cox T. J., Hernquist L., 2008b, ApJ, 686, 815
- Younger et al. (2009c) Younger J. D. et al., 2009c, MNRAS, 394, 1685
- Yun & Carilli (2002) Yun M. S., Carilli C. L., 2002, ApJ, 568, 88
- Yun et al. (2001) Yun M. S., Reddy N. A., Condon J. J., 2001, ApJ, 554, 803